Fishbone Diagram Explained with Example
417.28k views1139 WordsCopy TextShare

EPM
In this video, we provide a fishbone diagram (aka Ishikawa diagram) tutorial.
In the video we'll cov...
Video Transcript:
hello and welcome to today's lesson where we're looking at explaining the fishbone diagram also known as the Ishikawa diagram no matter what line of work you are in sometimes things go wrong some things that go wrong will be obvious and easy to resolve while others will be more complex and when these complex problems occur a fishbone diagram can help you to think about and categorize all of the different factors that may have led to the issue now by using a fishbone diagram you're more likely to find it the root cause or causes of the problem
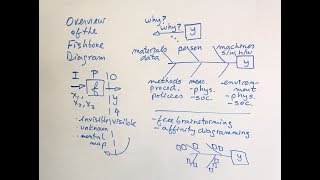
rather than simply jumping into an immediate solution which may later turn out to be incorrect and in this way you become much more likely to permanently resolve the problem first time so in a nutshell using a fishbone diagram can help you find the root causes of a problem now a fishbone diagram takes its name from the fact it resembles the shape of a fish skeleton the head of the fishbone diagram represents the problem you want to investigate the backbone of the skeleton connects the spines which represent the range of likely causes and related causes are
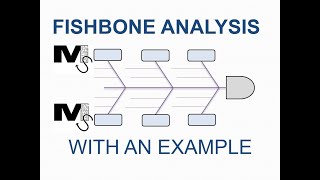
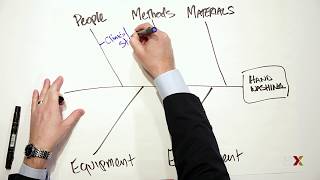
bundled together in two categories now the most common way to create a fishbone diagram is brainstorming with your team and when doing this the categories can be useful as they focus the discussion on a particular group of causes rather than trying to consider all possible factors at the same time now you can use any categories you like in manufacturing it's common to use what's known as the 5ms and that stands for man-machine material method and measurement and in service industries it's common to use the four SS standing for surroundings suppliers systems and skill now the
fishbone diagram goes by a number of other names including a cause and effect diagram Ishikawa diagram and herringbone diagram and all of those can be used interchangeably so let's take a look at an example so for this example suppose you run a business selling products online and your website and expectedly crashes now as the website was crashed your first priority will be to get the website going again as soon as possible but once this is done you decide to use fishbone diagram to perform a deeper analysis of what caused the website to crash so that
you can prevent the same problem from happening again now to do this you get the key members of your team together along with a fishbone template and brainstorm the potential reasons the website crashed and there's four steps you need to do to use the fishbone diagram so firstly you state the problem then you define your categories then you brainstorm each category and finally you analyze your results so let's take a look at each step in a bit more detail so step one state the problem so the first step in the process is to state the
problem you wish to remedy and this is usually done in the form of a question so for our example it will be why did our website crash and we update the fishbone template to reflect this the next step step two is to define the categories you will use to guide the brainstorming now these don't need to be set in stone and you can always create new categories or remove categories later as the brainstorming session causes your thinking to evolve but for our example we decide to use the following three categories system to capture causes associated
with the system itself process to capture any process issues that might have caused the website to crash and finally human to capture any potential human errors that may have caused the website to crash step 3 is to brainstorm that likely causes a category at a time now as you brainstorm with your team you're going to generate a list of top-level ideas that may have caused the website to crash and it can be useful to dig deeper into each of these potential causes using a technique called the five whys and the purpose of the five why's
is to help you ensure you've uncovered the true root cause rather than just a superficial cause and the technique is really simple it works by asking why five times so as an example suppose we initially thought the website crashed because it ran out of memory well why did it run out of memory well because it was incorrectly configured and why was that well because the site administrator made a mistake and why did he make a mistake well he made a mistake because the development team hadn't provided adequate instructions and why was that well because they
assumed it was obvious now in this example we can see that we asked why four times and were then unable to delve any deeper but notice that by using the five why's we shifted our thinking that the website crashed because it ran out of memory to realizing that it may have been a human error an engineer assumed something was obvious when to the site administrator it wasn't obvious at all now as you brainstorm all causes category by category you update your fishbone template and it will end up looking something like you see here except there
will probably be much more causes now there are a number of advantages and disadvantages associated with fishbone diagrams so in terms of advantages they are easy to understand and they show clearly the relationship between cause and effect they help find the most likely cause of the problem they can be applied to a range of problems and the whole team gains a better understanding of the issues in terms of disadvantages then the diagram doesn't help you prioritize causes you have to do that for yourself the output of the brainstorming is only really as good as your
brainstorming session with your team they can also become unwieldy to use for very complex issues you can imagine where you may hundreds of potential causes it's very difficult to represent that graphically and finally you may waste time discussing causes that have very full impact on the problem so in summary the fishbone diagram or Ishikawa diagram was developed in the 1960s and provides a visual way to find the causes of the problem we can be used in any industry and for many purposes including identifying manufacturing defects and improving processes and the process of creating the fishbone
diagram can also help you create a shared understanding of a problem amongst the members of your team so that's it from me really hope you enjoyed this lesson and I look forward to speaking to you again soon
Related Videos

20:10
Fishbone Diagram EXPLAINED - Root Cause An...
The Business Analysis Doctor - IIBA Certification
16,284 views
14:25
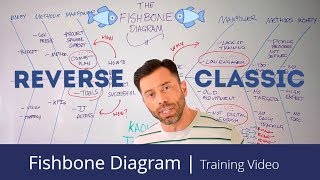
The Classic & Reverse Fishbone Diagram | A...
i-nexus strategy software
48,755 views

27:14
Transformers (how LLMs work) explained vis...
3Blue1Brown
5,525,533 views
10:58
Fishbone Cause and Effect Analysis and Exa...
Mister Simplify
60,047 views
3:17
How to create cause-and-effect diagrams
Harvard Online
622,713 views

20:04
The Dumbest Drivers Ever
Daily Dose Of Internet
3,367,323 views

14:17
How the Elite rigged Society (and why it’s...
Alliance for Responsible Citizenship
4,186,727 views

21:43
FMEA, the 10 Step Process to do an FMEA (P...
CQE Academy
269,854 views
20:37
Title: How to Construct a Fishbone Diagram...
Invensis Learning
5,622 views

12:56
How to Make a Fishbone Diagram (Ishikawa D...
David McLachlan
93,142 views
19:23
Using the Fishbone to Solve a Complex Aero...
Learn Lean
9,047 views
10:36
Six Sigma Overview | Fishbone Diagram | Gr...
fkiQuality
50,644 views
10:25
PEST Analysis (PESTLE) Explained with Example
EPM
198,024 views

28:18
Root Cause Analysis Techniques | Root Caus...
Invensis Learning
152,264 views
11:20
How to Make Root Cause Analysis in Excel (...
David McLachlan
17,575 views
28:28
Russell's Paradox - a simple explanation o...
Jeffrey Kaplan
8,543,789 views

5:23
How to Solve a Problem in Four Steps: The ...
DecisionSkills
652,962 views
18:40
But what is a neural network? | Deep learn...
3Blue1Brown
18,964,473 views
8:28
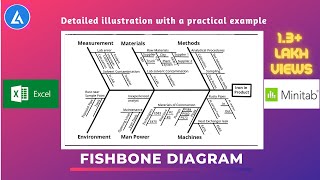
Fishbone Diagram (Ishikawa): Explained wit...
LEARN & APPLY : Lean and Six Sigma
190,129 views

14:03
Root Cause Analysis WITH (ACTUAL Example)
Learn Lean
86,575 views