How to Find the Best Chart for Trading
23.1k views3004 WordsCopy TextShare
Thomas Wade
In this video, you will learn how to identify the best chart for trading when introducing a new inst...
Video Transcript:
in this video we will cover the methodology that will help you to find the best chart to trade and how to find the right time frame for every instrument to identify the best places on a chart where to enter and to take the best trades Traders use price action rules price action rules help us understand where the Market's going to go where are the key entry points and what is the high probability setup Traders use these price action rules not only for scal trading but also for swing trading and because price action rules are Universal
we can apply these rules in every single time frame and in every single instrument why is this important well because High prity setups they take time to develop everything in price action must align and Traders many times struggle with patient they're jumping the gun they're taking setups they're way too aggressive or TRS are not that experienced yet and in order to avoid making these mostly male errors what shads can do they can add more instruments to their trading Arsenal and they can increase the chances of a high probability setup forming because if You observe more
instruments and you miss a good high prity setup on one instrument you're not that bother with it because you know you got opportunity on other instruments the highy setup will form eventually we are going to cover how to find the best stick chart for every instrument because stick charts offered enhanced symmetry they provide provide more details and we have better insight into market dynamics how can Traders determine the most suitable time frame and Implement effective money management strategies tailor to each instrument this is what we're going to cover in this video so now that I
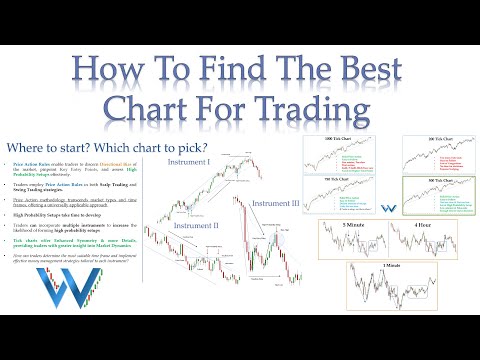
decided the type of instrument that I want to incorporate into my trading Arsenal where am I going to start which chart to pick your first objective that you need to understand is that you want to trade a chart that offers plenty of trading opportunity but the chart is not too fast for you to make bad decisions or it is almost impossible to execute right trades or that there are fake outs so every Trader's objective is to identify the right time frame that offers plenty opportunities but it's not too fast or not too slow because if
a chart is way too slow you're going to be waiting a very long time for a high probability setup Now High time frames are good to identify the overall bias and they are good for mainly swing Traders but you need to adjust to bigger stops bigger targets and you have to understand there are fewer opportunities you need to understand that the chart you're going to select needs to fit your individual personality and your trading style you need to be comfortable with the chart you're going to be trading on the right you can see we have
2,000 tick chart for the es and we have 10,000 tick chart for the es 10,000 dickart as you can see looks good is symmetrical key entry points are easy to find but it offers low amount of training opportunities and it's mainly used for higher time frame analysis the 2000 thck chart for yes is the perfect time frame that sculps use because it offers a lot of opportunities to trade it is a perfect balance but there are not too many fake outs and it's not moving too fast so it is hard for us to execute our
trading decisions and this is the goal for Trader to have a chart that offers good enough opportunities but it's not too fast with impossible to execute correctly or there's too much clutter and noise on the chart for this reason you should avoid really trading a time frame that is less than 1 minute because there is so much noise it is very hard to execute trades properly it is moving too fast you're going to be making M errors and there can be a lot of fake outs how to select the most useful chart every single time
I want to find the best stick chart for a new instrument that I want to trade the number one step is I need to find a thck chart that is most similar to one minute chart because one minute chart is optimal time based chart for sculping but I want to find Optimal tick chart because time based charts are not as symmetrical and they don't provide as many details so we have one minute chart for the GC Futures example Market moves in pairs of twos and I'm going to randomly plot thousand tick chart I need to
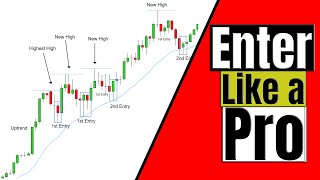
start from somewhere now my goal is to find a tick chart that is similar to one minute chart and the step two is I'm going to be applying price action rules and I'm going to be looking for symmetry I'm looking for key levels I'm looking for if there is enough high probability setups and if there's enough fars overall so I'm going to be taking a look around these areas because I see a lot of clutter here a lot of clutter here and I want to see some nice probity set up at the key entry point
following the price action rules so I'm looking for symmetry I'm looking there's enough bars and I want to see if there are high prity setups or not and how many of those High prity setups are there Market Moves In of twos now the Thousand tick chart looks okay but if I'm going to analyze the amount of bars you can see low amount of bars on the chart not that many trading opportunities if I'm going to select the 500 tick chart I'm going to go a little bit lower decrease the tick chart number you can see
okay now we're talking a little bit more similar to one minute chart you can see more bars more trading opportunities why for example there is no lower high here I want to see some little pullback so this is what I'm looking for I want to find key levels key entry points I'm looking for high relity setups I'm looking for the amount of bars I want my tick chart to be similar to one minute chart if the chart contains low amount of bars with very few hypoy setups I will lower the number of ticks on the
other hand if the chart contains many price moves and lot of fake outs I will increase the number of ticks so the 500 chart looks optimal for the GC example step five watch the chart for several days and confirm if you're comfortable and compatible with but you want to back test it you want to check multiple days to truly see if there are a lot of trading opportunities if it's not too fast or too slow apply this to any other instrument next instrument I want to add this CL for example to my trading Arsenal so
I'm going to start with 200 tick chart but this sck chart as I can see has a lot of bars on a chart and has a lot of fake outs it is very hard to follow it is printing too fast it has a lot of small congestions I have no time to make the right decision all the bars are forming very fast when I'm watching this live this is Extreme sculping and this is not what I want to trade because there a lot of fake outs a lot of noise it is very hard to trade
and this sck chart is simply too small I want to trade a chart that will get rid of the fake outs and I have time to make trading decisions I have time to place orders on the chart and I can analyze the chart properly so I'm going to increase the number of ticks let's say I'm going to go to th000 tick chart still the CL now this price action looks solid it is easy to follow I can identify the key entry point but when I analyze this chart closely I have very few entries very few
High prity setups I have a lot of first entries I have very few second entries very few high lows very few F second entries this chart is good for high time frame but I don't have that many opportunities every single time I see a lot of first entries and I see entries far from the EMA this chart feels way too big because I'll be waiting a whole day for just one setup so now 200 tick chart is too fast and th000 tick chart is too small so I need to find the medium I'm going to
lower my tick chart I'm going to go to 750 tick chart okay solid price action still easy to follow decent amount of setups but it still feels a little bit slow now this chart is already good to trade but I'm going to ask myself a question if I miss a setup are there other trades and by the way I'm not doing this only for one day I'm back testing several days so I can fine-tune the best sck chart and I can see that there are not as many setups in case I'm going to miss another
setup if I'm going to lower it just a little bit just a tat to 500 thck chart this is the best thick chart to trade easy price action it is symmetrical there are no fake outs no congestions I can make decisions in time it is also offering me plenty of trading opportunities so I don't have to sit here the entire day waiting for a few setups enough time to make decision so 500 TI chart for the CL that's the optimal chart so these are the steps that I'm going to do if I want to find
the optimal tick chart you don't want to trade chart that is too small a lot of fake outs too much noise hard to make decisions but the chart that is too big is also not ideal if you are intraday Trader and you want to find several setups not just very very few so this is the best optimal chart and here we have for example the dance deck as you can see at the bottom 1 minute chart 1500 tick chart looks very similar to one minute chart it offers more details Market insights and it is more
symmetrical so this is how we're going to find the best sck chart we're going to start with the one minute chart you're going to be tweaking the number of ticks and you're going to be looking for optimal tick chart looking for Price action rules if they're being followed you're looking for Symmetry and you're looking for the areas if there are highy prity setups or not a lot of beginner Traders they want to start trading micro Futures not regular Futures because they want to make sure they're not going to blow their trading capital while they are
in their developing stage and this is very smart so in order for me to identify the right thick chart for micro Futures we're going to apply very similar steps but the number one we're not going to look for One Mini chart no you're going to select the main regular chart for the regular es instrument you want to follow using micro Futures so for example we're going to use the es2000 tick chart and 1,500 NASDAQ so these are the main charts we use for intraday sculping so if I want to find the best the optimal micro
future Mees or mq tick chart I want to find a tick chart that is similar to 2,000 es and 1500 tick charts once again I'm going to tweak these tick charts I'm going to look for the ideal number and as you can see Mees 950 thick chart is very very similar to 2000 and mnq 2500 di chart is very very similar to 1500 di chart so in that way I can trade the micro Futures by being very similar to regular Futures chart once again increase or lower the amount of ticks if you want to find
the best chart watch it for several days and make sure if you are comfortable and compatible with it we chose the instrument we found the best stick chart and now the last question is how do I figure out the proper money management strategy and do I have to adjust price action rules to each instrument you don't price action rules work exactly the same on every single instrument there is no adjustment you need to do you will still apply the very same price action rules but you need to adjust slightly your risk to reward and your
money management strategy so for ES the main target profit we use for sculping is let's say around 8 to 10 tick that's the scul profit 8 to 10 tick scalpers profit is quite similar to one to one risk to reward slightly less the bars on average are a little bit bigger so that's already a clue that you need to understand if you want to find the best money management and risk reward on other instruments so what are the steps if you want to find the best risk reward ratio and you want to trade position size
that is similar to how we trade the es what you have to do is you're going to plot the other instrument the selected TI chart and you're going to measure the average size of the bar you can even use the ATR indicator but you can also also do it manually you're going to select many days and you're going to back test and see how big those signal bars are for the hyperal setups because you want to start at first from 1: one restk reward ratio so you're going to go to a new instrument you're going
to look how big the average bar size is and that will help you to understand what's going to be your target profit for each new instrument so for example we're going to take a look at the CL and if I want to understand what's going to be the optimal sculping Target profit I'm going to take a look and I'm going to measure the bar size of high prity setups because I want to understand what the average stop L is going to be so I have 10 ticks here 17 ticks 19 9 24 this a bit
too big 16 19 14 and 10 and this CL was a little bit more volatile than normal these are much bigger than normal they are because for example other day is a little bit slower 10 ticks 10 ticks 11 12 8 and 7 so I want to find a good average number for optimal sculping position so you can already see an eyeball it it's going to be around let's say 15 14 ticks so every single time I want to find the optimal scalers Target profit for each new instrument I'm going to measure the signal bar
size because I want to find what is the average size of the single bar I want to know how big the stop lus is going to be I I want to find a Target profit at first that's going to be similar to 1 to1 risk reward and then I'm going to make it slightly lower than 1 to1 just like es because on Es as we trade 8 to 10 ticks is just slightly lower than 1:1 you're going to observe Market's volatility and for the CL 500 tick chart for example optimal Target profit is 10 12
14 ticks around that and for Nasdaq 1500 dick chart it's going to be 10 12 14 points around that you don't have to follow this perfectly to the te there is absolutely no problem if you will tweak this number a little bit you will increase a little bit more or decrease a little bit more it is around this number for the es we use this guideline based on the ATR to adjust our Target profit based on the Market's volatility and how fast it is if you don't want this headache you can simply make your initial
scalp being one to one risk to reward ratio only problem with that is that sometimes the signal bar is going to be way too big and your target profit may be way too big is not going to be a scalers Target profit it may be much much bigger but going one to one risk reward ratio on most trades is definitely a valid strategy as well before you're going to find the best scalpers profit or you can just use the one to restore rual the whole time and no matter what your stop loss always goes one
tick above the single bar when selling and one take below the single bar when buying on every single time frame and instrument you're trading if you're going to add more instruments and more charts to trade make sure you're going to test it first to see if you're not being too overwhelmed if you're not missing setups and don't overdo it it's just an idea that can help you to look for more Hy prod setups in case the market is very slow make sure you're going to test it and it fits your trading style and personality good
luck with your Trading
Related Videos
14:37
Market Rules EXPLAINED - How To Count Entries
Thomas Wade
251,533 views
10:35
Adding to Winning Trades - How and Why?! ✔️
UKspreadbetting
17,263 views

25:02
050325 Fibonacci Elliott Wave price & time...
Day Trader S&P 500
25 views

46:30
The ULTIMATE Guide to CANDLESTICK Pattern ...
Thomas Wade
8,559 views

24:47
The psychology of adding to winning trades
Trader Tom
104,495 views

43:14
VWAP Trading Strategy Crash Course - BEST ...
Humbled Trader
504,955 views

29:37
Largest Bitcoin Miner Reveals His Bull Mar...
Anthony Pompliano
114,573 views
19:19
Risk Management In Forex Was Hard.. Till I...
The Trading Channel (The Trading Channel)
335,851 views

6:51
Adding to Your Winning Trades, a Guide 👍
UKspreadbetting
21,634 views

26:44
13 best PRICE ACTION signals I found after...
Tradeciety.com
2,292,673 views

14:27
China ‘In a Panic’ to Start War, The U.S. ...
ITM TRADING, INC.
365,357 views
16:18
The Language Of Price Action - Market Fund...
Thomas Wade
1,975 views
51:41
10 SWING TRADING strategies - Best Signals
Tradeciety.com
249,390 views

31:16
5 Price Action Rules EVERY Trader NEEDS To...
Thomas Wade
2,028,393 views

20:52
Price Action Trading For Beginners: How to...
Thomas Wade
36,839 views

8:06
Trading Price Charts Using Price Action Rules
Thomas Wade
1,160 views
12:04
4 powerful signs that the Trend is Ending ...
Tradeciety.com
92,227 views

27:40
The ONLY Beginner's Guide To Trading Trade...
Thomas Wade
147,024 views
20:02
Tick Charts - What Is The Advantage Of Usi...
Price Action Volume Trader
3,207 views
17:23
Master Institutional Supply and Demand Tra...
Matt Donlevey - Photon Trading
1,223,560 views