Lec 10, Probability Distributions - III
42.41k views3605 WordsCopy TextShare

IIT Roorkee July 2018
Probability Distributions, Normal distribution, standardized normal distribution, Continuous distrib...
Video Transcript:
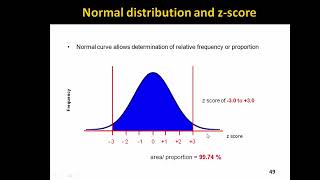
[Music] [Music] [Applause] [Music] [Applause] [Music] welcome back students now we are going to discuss another important continuous distribution and that is normal distribution normal distribution can be called as mother of all distribution because if you a new phenomena if you are not aware about the nature of the distributions you can assume that it follows normal distribution most of the statistical test or whatever analytical tools which are going to use in this course going to have some assumptions that he'd follow normal distributions knowing the properties and behavior and assumptions about the normal distribution is very important for this course some of the properties normal distribution is bell-shaped curve right because for me a bell-shaped curve it is symmetrical you can fold it so after folding both the sides are same another important property mean median and mode Tzar equal the location is characterized by its mean mu the spread is characterized by standard deviation the random variable has an infinite theoretical range there is minus infinity to plus infinity the formula for normal probability density function is f of X equal to 1 by 2 pi into Sigma e to the power 1 minus 1 by 2 X minus mu by Sigma whole square where E is the mathematical constant the value is 2. 71828 pi is the mathematical constant the value is 3. 14 nu is the population mean Sigma is the population standard deviation X is any value of the continuous variable the shape of the normal distribution will change based on its spread by varying parameters mu and Sigma we obtain different normal distributions for example this one where the Sigma is very low in this case Sigma is little normal this is Sigma is very big changing mu shipped to the distribution left or right if you increase the value of MU it can go right side or left side changing Sigma standard deviation increases or decreases the spread generally when you decrease the Sigma the spread will decrease when you increase the Sigma the spread will increase there is another normal distribution standardized normal distribution any normal distribution with the mean and standard deviation combination can be transformed into standardized normal distribution one thing what you have to do we need to transform X unit into Z units zette is nothing but that conversion method is X minus V by Sigma the standardized a normal distribution has a mean 0 and the variance or standard deviation is 1 that translate from X to the standardized normal that is the distribution by subtracting the mean of the X and dividing by its standard deviation so that conversion from a normal distribution to standardized normal distribution is done with the help of this Z transformation where Z equal to X minus mu by Sigma X is the random variable mu is the mean of the population Sigma is the standard deviation of the population the formula for the standardized normal probability density function if you substitute the Z equal to X minus mu by Sigma in our previous equation it will become f of z equal to 1 by root of 2 pi e power minus Z square by 2 where pi is the mathematical constant Z is any value of this standardized normal distribution standardized normal distribution the shape how they look like also known as the Z distribution mean is 0 standard deviation is 1 the value above the mean have positive Z value values below the mean will have negative Z value let us see how to do that conversion from normal distribution standardized a normal distribution if X is a distributed normally with the mean of 100 and standard deviation of 50 the Z value of x is 200 then corresponding Z value is X minus mu by Sigma X is 200 minus mu 100 during Sigma 50 equal to 2.
0 this says that X 200 is 2 standard deviation above the mean of 100 okay there's a two increments of 50 units the Z value nothing but how many times of its standard deviation that is nothing but your Z here two increments of 50 that's why the Z value is to look at the the conversion now this will be so convenient for you the red one where the mean is zero the X 200 we have asked to find out when X equal to 200 what is the corresponding Z value the red one shows in the simple normal distribution the black one shows the standardized normal distribution you see that the mean of the distribution is 100 in a standardized scale it becomes zero when X equal to 200 any a normal distribution in standardized normal distribution the X and corresponding Z value is 2 okay where the mean mu equal to zero Sigma 1 note that the distribution is the same only the scale has changed we can express the problem in original units are standardized units but there is advantage why we ought to convert into standardized normal distribution sometime you may be required to find out the area of your distributions because if you if you are not standardizing you cannot use that your Z table z statistic table every time to know the area you have to integrate it that is a very cumbersome process that is why every normal distribution is converted to standardized normal distribution for the convenient of looking at the Z value directly from the table that will simplify our task the probability is measured by area under the curve in a continuous distribution the probability you know that it is mentioned area under the curve suppose always it has to be expressed between between a and B if you want to know the probability exactly at the a are exactly B that will not form the area so the probability is 0 so in the context of continuous distribution the meaning of probability is area under the curve but if it is a discrete probability distributions the probability can be read directly by looking at X and corresponding pfx totally area under the curve is 1 and the curve is symmetric so how is the above the mean of is below so CP of minus infinity to X less than or equal to MU is 0. 5 similarly mu less than equal to X less than equal to plus infinity is 0. 5 so the total area is 1 suppose if you want to know the area is it less than two point zero zero C this was when these it is let's say this area is point nine seven seven to one way you can read directly from the Z table suppose in the rows the Z value is given the column the decimal surf is given suppose if you want to know Z 2.
00 you have to look at in row two point zero zero the corresponding area is this one say the rows shows the value of Z to the first decimal point the column views the value of Z to the second decimal point the value within the table gives the probability from Z minus infinity up to desired value when we look at the table a statistical table especially a Z table you should be very careful whether the area is given minus infinity there are two possibilities sometime the area may be given minus infinity to 2 plus x value sometime area may be given only the positive value this ideally 0 positive value of Z is given if I want to know if you want to read the negative value of Z because it is symmetric so you can read justly just only the positive value then we can take that value into the negative side so finding normal probability procedure we will see one problem to find P of a less than X less than B when X is distributed normally the first one is draw the normal curve of the problem in terms of X whenever you are going to find out area it is always good to draw the distribution draw the normal distribution then you can intuitively you can read from the picture so the next step is translate x value to Z values then use standardized normal table where you can get the area let X represents the time it takes to download an image file from the internet suppose X is the normal with mean 8 and standard deviation 5 if we want to know what is the probability of X less than 8. 6 that means what is the probability of downloading time is below 8. 6 right so first you have to mark the mean then you have to find out this x value is 8 point 6 so since it is asked less than eight point six the left side area so the first step is this eight point six has to be converted into you can integrate it by using normal distributions you can substitute the minus infinity to to eight point six behind you can integrate it you will get the area there is no problem but it's a very time-consuming process so one easy way is you have to convert that normal distribution into standard normal distribution that means the x value has to be converted into Z scale we can read that you can use the table to find out the area for the corresponding Z value suppose X is a normal with mean 8 and standard deviation 5 X less than 8.
6 use the Z equal to X minus mu by Sigma formula to get Z value when X equal to eight point six so we got zero point one two so now when Z values zero point one two you can read this value directly from the normal table to know the probability you see that Z value zero point one two so we can say the Z value zero point one two so this area is 0. 5 748 finding normal probability suppose X is greater than eight point six so now we have to look at the area of the right side so P of x greater than eight point six is equal to that we have to convert it to set scale outer getting since its greater than since the area is 1 1 minus P of Z less than 0. 1 two will give you the the blue side area right so one when Z equal to 0.
12 corresponding area is 0. 5 4 so this side area is how to subtract it from one will getting we are getting 0. 45 to two suppose X is a normal with mean 8 and Center deviation file so find P of y 8 less than X less than 8.
6 now the two value of x is given both the values has to be converted when X equal to 8 we are getting Z value 0 when X equal to 8. 6 we are getting Z value 0. 12 so now we have to know the area of Z 0 to z 0.
12 so that means 0 to 0. 12 one way from the table is first you find the area up to minus infinity to Z value is 0. 12 so we are getting 0.
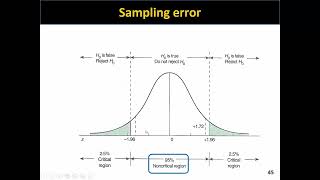
5 4 7 8 then subtract when Z equal to zero when Z equal to zero left side area we know it's a point five so the remaining is point zero four 78 now just the reverse of that the probability is given you want to find out the x value okay let X represents the time it takes to download an image file from the internet suppose X is normal with mean eight and strand deviation five find the X such that twenty percentage of the download times are less than X there are two point over here 1 is less than X another one is 20 percent age so on the left hand side when ad I equal to 0. 2 what is the corresponding x value okay so for that first you have to find out Z value from the Z you want to find out the x value okay now we look at the table so when area is equal to point two corresponding Z value is minus zero point eight four this is the value of Z so we know that Z value is minus zero point eight four yeah this formula has come from this simple formula X minus mu by Sigma now we know the value of Z from this you had to find out value of X okay and one more thing the when you are finding the value of Z you should be very careful what kind of normal distribution you are using to find out the value of Z if normal distribution is like this that is area is given from zero to positive Z right so if you are measuring area on the left hand side so you'll get some Z value but you have to attach negative sign to that so we should be very careful so mu equal to eight point zero plus minus zero point 8 4 multiplied by five we are getting three point eight zero so twenty percentage of the download times from the distribution with the mean eight and standard deviation five are less than three point eight seconds another important thing gives us normality because the normality assumption is very important for other type of inference mystics I will tell you why it is important because in we will be studying a concept called central limit theorem where when you do the sampling of the sampling that will follow normal distributions so lot of many analytical tools many statistical tools follow the assumption that data should follow normal distributions that is why as soon as you collect the data the first step is cleaning the data when the cleaning in that process is here to verify whether the data follow normal distribution or not otherwise you may not otherwise you will you may end up with choosing wrong statistical techniques or analytical techniques okay it is important to evaluate how well the data set is approximated by a normal distribution normally distributed data should approximate theoretical normal distribution like the normal distribution is bell-shaped where the mean is equal to the median the empirical rule applies to the normal distribution the interquartile range of in normal distribution is 1. 33 standard deviations these are the way to test the normality another way to assess the normality is construct your charts or graph now you can look at the shape of the distribution for small or moderate sized data set do stem and leaf display and box and whisker plot and check whether it is looks symmetrical or not as I told you in the beginning of the lectures in if you look at this terminal if plot you should follow this kind of shape then we can say it follow normal distributions in the box and whisker plot for example box and whisker plot is like this right the middle line that is median line should be middle of the box then only we can say the data set follows normal distribution for a large data set does the histogram or polygon appears bell-shaped you can draw a histogram also you can verify whether it follow normal distribution other way you can compute descriptive summary measures whether you can check mean median mode how this your value is the interquartile range approximately 1.
3 3 Sigma is the range is approximately 6 Sigma these are the some descriptive measures to check whether the data follow normal distribution or not then you can find the skewness when the skewness is 0 then we can say this data follow normal distribution some more example to check the normality observe the distribution of the data set these are the conditions due approximately 2/3 of the observations lie within the plus or minus 1 Sigma then we can see it for normal distribution though approximately 80 percentage of the observations lie within plus or minus 1 point 2 8 standard deviations are due approximately 95% of the observation lie within the mean or plus or minus 2 standard deviations this is the Z table you see the previously the Z table is starting from 0 it is not starting from minus infinity so this is second decimal this one suppose Z to 0 the probability 0 here it is given what is given only one side for this the area is given only this one so if you are finding you have to add a point five suppose if you want to point zero don't add point five to get the Z table another important point which I am planning to willing to share with you you see this when Z equal to 0 Z 2 equal to 1 see this is 0. 34 1 3 right between 0 & 0 & 1 so first if we want to move minus infinity to 1 you have to add 0. 5 with that plus 0.
5 so you'll get the values another one when you see when you look at the normal distribution I'll come back to that if X is normally distributed with MU 485 and Sigma 1 0 5 so the 485 to 600 when X is 485 you were to convert to Z scale it is 0 when X equal to 600 corresponding set value is 1 point 1 so Z to 0 to 1 point 4 point 3 6 4 3 is the area under the curve dear students we have seen so far the properties of normal distribution then we we have seen standardized normal distribution and normal distribution how these are interrelated and we have seen how to find out the area with the help of table 1 property you can look at the normal distribution the normal distribution shape is like this so you look at this it won't touch this is x axis Y is your probability f of X it will not touch the x axis you may have this doubt why it is not touching this distribution normal distribution why it is not touching exact says because suppose if I'm plotting age of the students in the class follow normal distribution see the average ages say 19 right there is a possibility somebody suppose I'm closing this way somebody's age maybe say around 30 somebody age maybe around say around 10 so since this normal distribution was drawn with the help of sample I was not exactly knowing that this kind of rare value of X whether it is X equal to 30 or X equal to 10 so why I am NOT closing why this normal distribution not touching x axis because we have a given provision for the rare events that means X's may be very high value X may be very low value but I'm not sure about that that is why the normal distribution did not touch with the x axis the another doubt you may have when you look at the Z table when you look at the Z table the value of Z to most of the time I go back I go back I'll show you see this the value of Z is 3. 5 the question may come why the value of Z is maximum 4 or 5 in the statistical table you remember in the beginning of the class I was saying from the mean if you travel on either side with one Sigma distance you can capture 68 percentage if you travel to Sigma distance from the mean from the mean from the mean that is this distance to Sigma distance minus 2 Sigma distance you can capture 95 percentage of the 95 percent of the area of the normal distribution if you travel 3 Sigma distance this extreme distance I can use some other color please bear with me if you travel 3 Sigma distance this portion if you travel 3 Sigma distance you can cover 99. 7 percentage of the data ok so why the value of Z is no beyond three the possibility of the Z values beyond three is only 0.
3 percentage the same time the probability of X value to become extremely high are extremely low is only 0. 3 percentage what is the meaning of that only find 3 personally charged the value of Z will will be more than 3 that is why all statistical tables are given only 3. 5 or 4 not beyond that okay the another reason also why we are not closing with x-axis the probability of that extreme events to happen is only 0.
Related Videos

21:15
Lecture 11, Python Demo for Distribution
IIT Roorkee July 2018
64,091 views

28:19
Lec 6, Introduction to Probability-I
IIT Roorkee July 2018
98,835 views

34:16
Lec 12, Sampling and Sampling Distribution
IIT Roorkee July 2018
58,978 views

34:44
Lec 1, Introduction to Data Analytics
IIT Roorkee July 2018
520,185 views

29:14
Lec 7, Introduction to Probability-II
IIT Roorkee July 2018
65,893 views

29:34
Lec 9, Probability Distribution - II
IIT Roorkee July 2018
49,924 views
14:50
UNIT 2 Central tendency Part 7
DMtutoring
16 views

32:36
Lec 5, Central Tendency and Dispersion - II
IIT Roorkee July 2018
103,270 views

43:41
Lec 19, Errors in Hypothesis Testing
IIT Roorkee July 2018
26,492 views

5:54
Basic guidelines for sheet metal design in...
Kreatorzone
28,177 views

25:22
The INSANE Story of How the Mormons Create...
Johnny Harris
766,652 views

19:01
How to Win in the AI Hype Cycle | Guru, Ri...
EO
13,921 views

24:37
Lec 13, Distribution of Sample Means, popu...
IIT Roorkee July 2018
40,773 views

8:37
Why Technocracies are Increasingly Popular...
TLDR News EU
72,536 views

32:33
Lec 16, Hypothesis Testing- I
IIT Roorkee July 2018
52,328 views

1:25:20
The Man Taking on Tesla in the Race for Hu...
Peter H. Diamandis
35,957 views

8:50
The Six Major Crises Facing Labour
TLDR News
51,345 views

19:48
Lec 15, Confidence Interval Estimation: Si...
IIT Roorkee July 2018
26,183 views
14:24
UNIT 3 Inferential statistics Part 7
DMtutoring
7 views