The ONLY Price Action Setup Traders NEED To Know
288.49k views2467 WordsCopy TextShare

Thomas Wade
In trading traders buy low and sell high. In order for traders to not buy high or sell low, they nee...
Video Transcript:
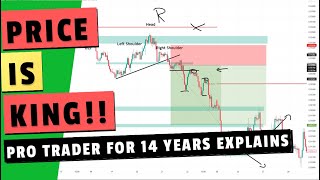
there are a few high probability setups but one of the most important high probability setups that we can identify using price action is a with trend setup why because on most charts there are multiple trends being present whether it is a big trend the large trend for the day or just a bunch of small trends that are working inside of a training range unless the train range is very tight there are small trends playing out every trend has multiple phases we have a correction phase and we have a push phase correction phase followed by a
push phase correction phase followed by a push phase correction phase and followed by another push phase this is the behavior according to price action when it comes to trends and the burden on traders is to identify where this correction is over and when the push phase is about to begin because if you can understand and read the market correctly when the push phase is about to begin you can capitalize on the width trend momentum and this is where our high probability price action setup will come into play as price session traders we can identify when
the correction is over just by counting bars just by looking at the proper pattern now to like a pullback is a number one high priority setup if it forms under the right conditions we're going to talk about what those right conditions are too like a pullback helps us to identify when the correction is over and when the push phase can potentially begin and it comes down to human psychology to human behavior when humans try something once they will just not give up they will try it one more time to see if it will fail again
or if it works too like a pullback will offer a second entry high probability setup now second entry if it forms under the right conditions it needs to form at proper key entry points the key entry points are trend lines exponential moving average 21 bar ema and support and resistance key levels as a price asking trader you're not interested in using any indicators you need to learn through the price action alone just using the price session tools and the correction needs to play out for second entry to be a high probability the two legged pullback
will hint us where it is the safe place to sell since we're talking about downtrend in order for us to safely identify the tool like a pullback and second entry short we need to understand how to count the legs the bullish lag is a series of bullish bars or it can be even just one bullish bar bearish lag is a series of bearish bars it can be just one bearish bar and since we have a downtrend working lower when we are looking for opportunity to sell when we're looking for the two like a pullback we
always start the count from the lowest low so this right here is the lowest low it broke lower count reset so this is the lowest low inside of this downtrend so this is where the count begins and we can see that we have first bullish lag the first bullish leg consists of this one bullish bar the second bullish bar now this bullish lag is going to be in play unless there is a break below the low of the last bar inside the series of the bullish life we have a series of two bars first bullish
lag second bullish flag and suddenly we have a break below the low of this bar right here indicating first entry short and the first bullish lag played out and the first bullish lag is over and the first bearish leg may begin notice the second leg is continuing and this right here is a second bullish lag and we have a break below indicating a second entry short this right here is the first bar second bar and third bar on the third bar of the second bullish lag we finally had a break below its low indicating that
the second bullish lag played out and this is the two-legged pullback indicating to us that the bullish correction played out and the main trend resumed that's the whole point of this two-legged pullback of this price action setup it will tell you when you can start looking for resuming the trend and looking to sell if it forms at the right key entry point which you did and the other conditions are in favor as well every time the lack will be broken it will form a chance for sellers to sell so this right here is the first
bullish lag trigger below indicating first entry short second bullish like forming trigger below indicating second entry short it resulted in a nice trend continuation setup downtrend is in play and we have another key entry point trend line so you combine two key entry points and a two legged pullback this is a high quality setup just by counting bars bearish like can be serious of multiple beige bars or just one beige bar our first bearish leg inside of this correction is a two bar leg we have a first bearish bar followed by a second berry bar
there is no trigger above neither one of these bars highs and then we have a third bar creating this first bearish lag but we have a trigger above notice one thick trigger above this bar right here indicating first entry long and the first bearish lag is broken and then we have a second bearish leg starting to form because the first century long was stopped so we have a second better schlag the next bar after this big bench bar just had a trigger above its high indicating that this second bearish flag is over and we have
a first century long pull back second inch long first leg down pull back second leg down is a two legged pullback at the key entry point indicating that the bearish pullback played out that it is okay to resume the buys and be buying the market at this point and also notice you have a small little high here but this high is higher by just one tick which means you reset the count from the highest high the highest high is always the place where the count is being reset we start our count from this high right
here first century long second entry long first entry long and the first entries in general may not be as reliable because they're indicating that the correction may continue the pullback may not be over just yet only after there are two legs and there's the second attempt this is where the bears will throw in the towel and bulls are about to resume the market as a price session trader i'm going to use the exponential moving average just as a supportive indicator to help me identify where possible key entry points are going to be and i'm going
to be drawing shortened or long term trend lines so i can properly identify the key entry point and at that point once i see that the structure is bullish i'm just looking for pullbacks and looking for triggers if there is a second entry as a first bearish lag first bar second bar third bar no break above and then we have a bullish bar indicating break above so this first bearish lag is over and first bullish lag may start second base like started and then we have trigger above this bullish bar indicating a second entry long
new high first century long pullback second entry long trend resumption entry as the trend is continuing i'm just looking for the same pattern all over again new high right here which i'm going to reset the count i'm going to count here but we have only first century long and count reset new high first bearish lag one single bearish bar instantly form a first century long just by one tick broke above the high of this bullish bar the second bearish lag is continuing making its way all the way to key entry point and above this doji
bar a second entry long trigger first leg first century long second bearish lag second entry long we have a first century long pull back second and drilling you can see sometimes the legs may not be as visible this right here is a first bearish lag first century long just by one take break below and we have a second entry long it can be this tiny but it is a variation of the two like a pullback and it is a second inch long 2k entry point while the uptrend is about to resume and this pattern appears
on every single time frame and on every single instrument this is apple stock weekly time frame here we have a nasdaq five minute chart we have new low form right here first century short break below pull back second entry short two key entry points notice this bullish lag has one bearish bar inside of it does that concern us no that doesn't because there is no break below this bearish bar that doesn't mean what color it is as long as there is no break the bullish leg continues the bullish leg was broken right here after there
is a one take break below this bar right here second bullish leg continuing second entry short where i can continue pushing lower new low first century short pull back second entry short so in this scenario bullish lag is just one bar here correction second bar here bullish leg ended normal formed first century short pullback second entry short two-legged pullback at the key entry point to like a pullback is designed to predict a small market move for a scalp you're not about to predict a massive swing trade you're about to predict a smaller portion of a
scalp from two key entry points to resume the trend after the correction played out daily chart the bitcoin new high formed first bearish lag first entry long trigger above this bar right here second bearish like continuing two bearish bars and the second entry long second entry long trigger technically above this bar right here but you need to go along above bullish bar so this is why i'm marking this bar right here another new high first century long just by one single tick this bar right here broke one tick higher above this polish bar instantly stopping
the first entry long because the correction may continue sometimes for centuries will work sometimes they won't it is all 50 50 and you will not make consistent money you will only make it consistent if you keep waiting for the high probability setup to make its way to the key entry point and there is a second entry long forming first bearish slack pull back second bearish lag and a second inch long your stop loss goes one tick above the signal bar you would have had to write this out but eventually market would resume and the uptrend
would continue and here we have a micro two like a pullback because we have a new high right here first bearish bar second berry bar third base bar all indicating bearish momentum we have a trigger one tick above this bearish bar indicating first century long and then it gets stopped instantly and notice while the first entry long was stopped the bar instantly reversed to the upside forming a second entry long on the same bar when the first entry long was stopped new high first century long it stopped second inch long one take about this bar
right here goal level price session trader is to predict where the pullback is going to end and then the trend is going to resume the correction phase will end and push phase will begin and the two-legged pullback is indication of bearish momentum being over depleting and buyers are about to step in allowing you to buy low and sell high new high formed first bearish lag no tick above this bar right here remains unbroken and right here we have even continuation of the first bearish lag this inside bar has one tick trigger above its high breaking
the first bearish lag indicating first century long pullback second bearish lag beginning second entry long right here stop loss goes one take below the entire swing in this case because this is a inside bar it is a key entry point new high bearishly continuing no break above its highs first bar that received a break above its high first century long pullback second entry long at two key entry points another new high indicating push phase is about to end correction phase is beginning first century long take one thing higher pull back two barbary flag second entry
long triggering one tick trigger above its high right here on this inside bar of two key entry points we can see two bearish lags in each correction now second entry needs to form under the right conditions for us to consider it a high probability setup it needs to form at the key entry point the correction trend has to play out signal bar must be bullish to go long and signal bar must be bearish to go short what does it mean correction has to play out you're drawing the channels for the main trends but you're also
drawing the channels for the shortened corrections if you have a bearish downtrend the bullish correction has a trend inside of it as well and it needs to form a new extreme for us to consider the opportunities safe to sell new law correction in play no safe energy to sell new low correction in play break new high of the correction indicating that this bullish trend played out and we have a first entry short counting from this low first attempt to sell pullback second attempt to sell buy the best is a two key entry point signal bar
is bearish and correction played out this is a high probability price action setup followed by a lower high confirmation setup and a felt second inch long second inch long is going to be a trap why because the context is bearish so you can use even the two like a pullback in opposite direction to help you identify a trap but it's a whole other story
Related Videos

27:40
The ONLY Beginner's Guide To Trading Trade...
Thomas Wade
147,013 views

45:59
The 3 Scalping Setups That Make Me A Livin...
Etienne Crete - Desire To TRADE
752,589 views

31:16
5 Price Action Rules EVERY Trader NEEDS To...
Thomas Wade
2,028,336 views

29:22
5 Steps to Finding Today's Trades
Brooks Trading Course
1,001,305 views

1:27:23
The GOAT Teaches You How To Master Price A...
10,000 Trades
124,595 views
32:40
Price Action Trading like a Pro - I share ...
Tradeciety.com
1,449,021 views

26:44
13 best PRICE ACTION signals I found after...
Tradeciety.com
2,292,673 views

14:48
The Two-Legged Pullback Master Setup EXPLA...
Thomas Wade
148,899 views

23:08
Price Action Trading Was Hard, Until I Dis...
The Trading Channel (The Trading Channel)
2,181,860 views

16:23
😱 Même les USA sont choqués par ce que vi...
MoneyRadar
80,391 views
11:45
The ONLY Candlestick Pattern Guide You'll ...
TradingLab
4,405,005 views

20:26
Rules For Scalping Trading Money Management
Thomas Wade
45,299 views

10:13
Tesla, the fall of the Empire? (-800 billi...
Automoto
30,069 views

8:06
Trading Price Charts Using Price Action Rules
Thomas Wade
1,110 views

14:52
Assassinat d'Aboubakar Cissé : l'avocat de...
Quotidien
148,355 views

1:35:36
Wall Street Trader: I Will EXPOSE Exactly ...
Words of Rizdom
610,222 views

28:55
Best Trend Lines Trading Strategy (Advanced)
Wysetrade
4,891,912 views

43:16
Michel Onfray : "Pour Jean-Luc Mélenchon, ...
Europe 1
28,949 views

14:27
China ‘In a Panic’ to Start War, The U.S. ...
ITM TRADING, INC.
359,574 views

27:21
🪐Worse than nuclear: The London Smog Disa...
AstronoGeek
173,013 views