Como criar ROBÔ TRADER de RSI EMA HILO para Profit e Black Arrow Nelogica
18.68k views5947 WordsCopy TextShare

Clube do Robô Trader - Profit e Vector da Nelogica
====== ⚠ IMPORTANTE! LEIA A DESCRIÇÃO COM ATENÇÃO ⚠ ======
✅ Clique 👉 https://rebrand.ly/yt_ClubeDo...
Video Transcript:
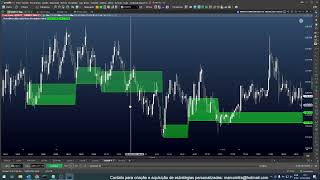
in this video you will learn how to build a trailer robot from absolute zero for Nelogica platforms easily and quickly using three incredible indicators that generated this result for the Brazilian market and this result for the international market in dollars anyone who follows the step by step from this video even if you don't know anything about programming you will be able to put this robot to run on your account even today talk guys welcome to my channel if you don't know me my name is Danilo Leandro I'm an engineer trader and robot programmer if you you liked the idea of this content already send that click on the like to enjoy this video now let's go program this robot come with me and back the PROFIT let's together here define how this automation will work so as suggested there is an automation that we will use three indicators that will be the exponential moving average plus the RSI for those who don't know RSI is the same as IFR that is the relative strength index and also the HILO so let's add the three indicators together here so we can see how it will work of this automation so the first thing we are going to put here is the moving average and the moving average that we are going to use here is twenty-nine periods ok I added it here on the chart itself the next indicator that we are going to add will be the RSI and then when you Put RSI , the two names are already here, so you can confuse us . first graph let me change the HILO parameter here so the HILO here will be two periods and its appearance let me just change the color here to make it easier for us to see it here in the graph okay the HILO is already there and here is the ifr right it it came here in nine periods and we are also going to change this pyrodicity so for that we enter here in the parameters in the properties and we are going to use the period fourteen ok here inside the setup it asks us to consider the line in the value fifty so I will add it here for those who don't know, just click here when you have a native indicator, right from PROFIT, just click here on the price scale in the fixed grid properties and you can add the lines here, right ? that we are not going to use add the horizontal agride ok the line we need has appeared here and let's go there knowing that we are going to use these three indicators what is the rule that we are going to establish here for the setup for automation regarding the moving average we have to check here that the closing needs to be higher and the moving average that we put this is the first rule the second rule that we need to evaluate is that the RSI also needs to be greater than the fifty value and the third condition is to evaluate whether the HILO is giving a buy condition also remembering that this condition because we are drawing it here is a buy condition so the HILO needs to be indicating a buy ok and knowing this rule the sale is exactly the opposite let's consider here a moment of a sale here so we look here at this sequence here at which moment a sale will appear there that we will consider a sale here the HILO already since that moment is signaling a sale but in these first boxes here the closing of the box is still above the moving average from this box here it closed below the moving average and that's what we need to evaluate and right now the RSI down there is below fifty look here I can't exactly tell just by looking but it might be below if not the sale happens here because Liz can be equal to the RSI, right, equal to fifty the value of the RSI it would happen in the next box because here it continues to signal the low red ray that is the sale here the box is already closing below the moving average and here visually we have certainly seen it and it is the RS is also below the fifty important value here that visually sometimes we cannot perceive whether the value is the same or not but if you stop the mouse here you can have the exact value of rc here is forty-nine point twenty-eight so in this case here as it is below fifty, the sale would already happen in this first box here and let's see also just confirm if the box here also in the same way if it is below the average then we can stop here the minimum of the box there is half nine out of sixteen and the average for the mouse here the average half nine twenty-one so in this case here also the closing of the box was below average so surely here we would need to have a sale, right?
there is a sell entry at the close of this box here this is a selling moment and what a buying moment let's see if we can establish a buying moment here at the end of our day let's look at this part here of the of the graph and let's check if it's all right to go long here part of this box the closing is already above average the HILO is giving buy condition and then we just need to see if the RSI is above fifty so at that moment here there would be a buy so we already have the buy and sell signs here so we can go there and build the robot together I'm going to change the screen here I'm going to put the code next to it and we're going to start building this robot together, let's go there every week I upload new videos about automated strategies and robot development in a simple way Would you like to learn how to develop your own robots to operate alone for you in the financial market ? the codes ready first hand oh and if you don't know how to enter the strategies editor the path is simple just click on strategy editor strategies this screen will appear click on blank strategy ready we are here let me organize the screen play here to the left and the graphic to the right and here in the strategies editor I'm going to bring here our base code to create any robot that we created together here on YouTube so if you don't already have this base code I'll leave it here on the card and also in the description From this video, the video where we create this base code from scratch, I 'm going to bring it here so we can go straight to the point in the development of this robot . it will allow you to create practically any robot using three simple steps that I talk about in the other video I will quickly explain here how our base code works for this I will maximize our strategies editor here and check out our base code it comes here with the three steps you need to follow to create practically any strategy first step you need to load here the indicators that we are going to use so here we are going to load the three indicators that we are going to use in this strategy then we are going to define what the entry signals are and finally we are going here too the third step is to define the exit signals so what moment will the robot enter into an operation will it buy or sell initiating an operation and what moment will it exit from this operation already started and here what it is saying right so from here we do not it will change but I will explain it to you step by step first step here is the entry execution so what is the code saying if there is a buy signal that we will define here in step two and the robot has neither bought nor sold , that is, it does not have any open position, it will buy the market in the same way if there is a sell signal and it is not positioned, it will execute a market sale and the exit execution is as follows if it is already bought and there is a stop c that we are going to set up here in step three , it will exit this purchase in the same way if it is sold, the stop signal v occurs here, it will also exit this sale by doing the inverse operation and here is the coloring part and what is the code saying here if there is a buy signal, paint the candle green if not a sell signal, paint the candle red and if there is neither a buy nor a sell signal at that moment, paint it white and down here he's saying right if the previous candle is green and there isn't a stop of yours or it hasn't stopped this operation, keep painting the candle green to give that continuity so you can visually see the moment of entry and exit of the operation in the same way as the inverse for selling painting the candle red ok and here is where the Paint bar function actually is which is the function that calls the color that we defined to paint the candle here below knowing that let's go there to build the robot that will stay this construction is very clear to you following these three simple steps the first thing we are going to do here is step one which is to load the indicators and what are the three indicators that we are going to load the first one is going to be the moving average that we are going to click here to load the moving average we put here the variable that is giving that error there and I will explain to you why then the moving average will be the exponential average which is the XP average function which opens here the NTSL relatives already tell you here what are the information right what are the parameters that you need to pass in this function first of them is the period we will define here as twenty-nine and the second parameter is the data the series of data that we will use the closing then closing we close this first line second indicator that we need to bring here is the ifr so we will bring here ifr value and we will bring here the IFR function this IFR function only asks for information you want period information so period fourteen that we are going to use here this code and the third indicator the HILO that we are going to define here as the direction of the HILO and we are going to bring here with the function HILO ACTIVATOR only information that we need to pass here to the HILO is also the period the period that we are going to use it here for HILO is period two and it is important to show you this detail here that many people had doubts in the other video is a straight bar you have this vertical bar there on your keyboard so it is this vertical bar that we are going to use, it is not square brackets, normally we use square brackets to inform it is past times, right from the past candle but here in this case it is not the situation in this case here is a straight bar a straight bar on the Hilux that it will bring us the information of a value one when it indicates the HILO for the purchase and when the HILO reverse indicates a sale it brings the value zero ok these are the differences here you can see that it is painted in red here, right because it is the following you stop the mouse here on the top here of the error the NTSL brings you what error is happening in this case here the highlaw one is not a valid pain identifier that is you forgot to declare this variable or you have the wrong variable there so in this case here we will declare the variables ok so we will declare the variable mm there as moving average comma b IFR which is the value of the IFR and the last indicator there, the last variable we need is i low and if you're starting and you don't know what type of variable you need to consider, right when you create a variable at the bottom it's very simple here we're using each variable to receive the value of a function so omm to receive is the value of the moving average the vfr to receive the ifr and the ir radiusu to receive the information here from the radiusu so you know what type of variable you need for each one of them just hover the mouse over the function and it brings it here automatically help type like this the information of this function and it brings the information here the result of this function will return a value of type float or real ok here in the declaration where I put real here the English word for real would be right for the type of real value would be float ok so in this case here I can also put float here if you have questions don't worry and I'll stop the mouse here over the others and you'll see there too is a float and here in the case of the average it is also of the float type ok so that's why we declare the three variables here using the same flout type that's it done, step one is finished, right, we already loaded the three indicators that we need for this automation and just see that here in our base code there is always help on the side, right so here we load the strategy variables and he puts it here, put the necessary variables here we already put it now step one load the indicator we already loaded it he says here look put the necessary indicators here now let's go to step two step two is to define the entry signal and here it says to put here the configuration of the buy entry signal and then I left it here for you to remove the two bars from the beginning of the line before editing so knowing that because then if you also don't know when we put the two slashes at the beginning of the line it's a comment everything to the right of the two slashes is a free comment ok so here see just that there were two slashes here at the beginning I took it now and there are two bars here everything that is to the right here continues to be a comment but what is to the left is not so let's define the buy signal here I will reduce the screen here to put the graph on the side to make it easier we consider what the rule will be, what will be the logic that we will define here for the buy signal I'm going to reduce it, I left the graph on the side here that will make it easier for us to make those entry settings so the first point that we need to consider the closing price needs to be above the average, that's what we said at the beginning of the video, right, then the closing of the box's candle price needs to be above the moving average variable so the first parameter we already use the value of the moving average here in our logic second parameter that we need to consider here in the buy signal input logic so let's put it here and open and we close the relatives and let's put the second signal let's consider the RSI then the RSI that is there in our variable as v IFR needs to be above what value of the value fifty is being considered here by this line our the arrow was big but it was ok understand closed so done that we are already considering let me reduce this arrow here so it will be strange so here we are considering ifr above fifty we are already considering here that the closing needs to be above average and now the third condition is that the HILO is signaling a buy and for that what we need to do here consider that the direction of HILO it needs to be equal to one and you are wondering, Danilo, how do you know that this function will return this this is in the NTSL documentation that we already showed you in other videos and here this parameter straight bar a straight bar exactly what it says this function will bring us the number one value this case here when the HILO indicates a buy that is when it has painted here in green and it will bring when I have painted the zero value here in red here in this position ok so this is why I called this variable as highlight that is highlô direction one is buy zero is sell ok done that we already defined here a The rule for buying and selling is exactly the opposite so I'm going to copy these three conditions here and I'm going to paste them here I'm going to delete them here so I don't forget the semicolon and they're going to invert this whole sign, right so for sales I'm going to paint it red arrow to indicate the first moving average point and we know what will lead to a successful sale because we had already evaluated the moving average before, that is, the closing of the box or the candlestick has to be below the moving average, then here we are going to invert the closing it needs to be lower than the moving average second value here the ifr needs to be below fifty so here in this position the fr has to be below the value fifty so here we are going to invert for sell and the HILO we already talked here because one and because zero right here it is indicating a sale so in this case the direction of HILO by the function will return us the value zero done that we have already defined the inputs here now let's define the output when the output happens a we ended up not saying it there at the beginning but it's very simple let me delete everything here when this sale will exit that will happen here when HILO indicates buy ok then when HILO indicates buy here it will exit the sale in the same way the reverse when he has here he bought this position when he is going to exit he is still positioned he will only exit here when the HILO is the sell position as we are going to establish this in the rule here for the exit so we made a stop here, right so the stop c when it is going to exit the operation, we will only consider the HILO value if to buy the HILO you have to have value number one the exit will be when the HILO is zero so going Taylor equal to zero it will leave the purchase and when will he leave the sale, right when he has sold look at him to sell he needs to have a HILO zero now here we will put the value of HILO the value of HILO one I will take it here I pasted exactly the top value but I can't forget to change here that the HILO so it's very clear now that you realize that in the purchase the closing needs to be above average the ifr needs to be above fifty and the low radius indicating buy to exit buy one once we entered the buy stop c since it is positioned when we will exit when the low radius turns to sell and the same way in the sale here, right since we entered the sale when we will exit the sale when the direction of the low ray reverses to the purchase and this is done in a few minutes our robot is one hundred percent finished and because here the lower part of the code as I already explained to you does not need to be changed in every part of the execution of our base code I already brought it to you let's do the back test as we do first thing we need to save this code so I'll put it here with the name robot club moving average plus RS plus Taylor underline YouTube maybe now I'll click here on this icon to open it here below we will consider in the valley let me look at here the graph is at twenty r so let's put twenty r here so you come here in the period change here to renco value twenty as our standard that we have been using here in the video I will put it here thousand actions but you can simulate it with a hand size that you would really consider in your day to day life and I'm going to press play here so we can see the result of this back test it showed here I'm going to maximize this window and then you're liking this content so no don't forget to subscribe to the channel and activate the bell so you don't miss any new videos and receive the codes ready first hand and if you believe that this type of content can help other people share it with your friends send it to that group of traders and let's go together create a great community wow 64,262 results here from the back test of course it's 1 state of the back test look at this 1 detail guys you can see that my mouse here is not allowing me to pull it just click here for example in the editor it goes back to the mix and then it will allow you to pull here ok let me increase this step here and let's analyze this result together here so here it is saying that the total net profit sixty-four thousand two hundred and sixty-two the average of winning operations eight hundred and thirteen reais then the average of winning operations eight hundred and thirteen and the average of the losing operations four hundred and ten in the same way that the biggest winning operation was five thousand five hundred biggest losing operation two thousand two hundred that is really interesting here the gains compared to the losses right the percentage of winning operations here thirty-six percent a lot of people can look and say wow but it's a very low percentage that you can improve in several ways for example considering a hollow order and other details other adjustments that you can also optimize there in your code the profit factor very good point four that's why even with this low percentage here it's giving an interesting result which is this ratio here of the difference between the biggest right here of the average of winning operations versus the average of losing operations the duradal here top to bottom eighteen percent I decline the maximum trade a trade five point half two I consider it ok to start with less than fifteen but this depends a lot on the setup of the type of asset but this throughout your tests you will consider it, you will see what actually works for you let's see the equity curve here very good equity curve let me increase it a little bit here look here we are considering a back test of one year is of operation you can increase and see other parameters for your back test if you want to include your costs, so let me go back here, go back to the summary sixty-four thousand here of the back test result and here if you want to put the brokerage cost, just click on the right button brokerage cost, you put here the cost you have to brokerage that the result will be automatically recalculated ok if you also want to simulate interesting slippage ok I always say here if you have an operation you are doing a back test of a setup and you put a slippage and here the value goes to for negative look at that one oh I'm going to go back here to zero zero slippage it's sixty-four I put one and I lipeige a slippage it was for forty-eight I put two it went to thirty-four that is of course the more slippage you consider the smaller the result will be but if you put a slip and it already passes by 1 negative value, study it better, test better this setup that you are automating because it could be OR very probably when you go to the real account OR even to the simulation account it may give 1 result different from the one that's in the backtash so one way to see if it's closer to what you expect is to do these tests by adding your brokerage costs and also the slip Page we always talk about in the videos here without you being aware of other things you can do here is also to put the entry time right to decrease here is the Range of moments that this code can operate also considers here the time that it will reset this operation so for example if you want to make this operation just a day trade right that ends on the same day, you can come here to put these parameters in the same way that you can put the parameters here for the daily gain objective for both guin and for them here, for example , if you are considering here the parameters for I gave 3 ok done that we finalized this same code it is important for you to know that you can run it on the black arrow and for those of you who are looking for quality ready made robots look at this path here o click on strategy strategy store it will drop here in the analogical strategy store right then here in the ABA store and you filter here by robot club OK, once that is done, it will filter here by our ready-made robots, just click on it and it will be available for you to operate, right, do your own tests and put it to run on your platform and here we will make available both our free robots like this case here the free Williams home that we created here on the channel and this other Williams raimion home that they have is super complete one of the files more complete here from the store at neológica where you can see here that it is not only execution, right a robot but it also brings the color indicator alarm screen and text ok if you don't know what each of these items means we will bring click on a video whenever you want to know the news, go here at the neológica store, right along the path I showed you filter by robot club that you will have here our accesses to our robots are ready ok then clicking there for example about the robot it comes here about the details you can choose one of the ways here is plans here and also click on this button and test it for free for seven days but here below you have the information the video referring to the robot and here all the part of configuration so this robot here is one of the most complete as I said it has a lot of configuration it has the screen you can use the screen you can enable the alarm it has the color indicator in short everything you need to configure just come here in the images that already show here how to configure and you have then the robot is ready to carry out its tests and put it to run in your account even today ready already here with our Black arrow pro open how do we open the strategies editor the same way as PROFIT is strategies menu strategies editor click here on blank strategy we are here with the strategy editor delete any data that is in this window and I will give a control v there of the code that we just created in PROFIT it is already here I will simulate here for this asset even for gold I will put five here minutes, which will even allow you to day trade and I'm going to press play let's see the result together wow twenty-four thousand seven hundred and twenty dollars sensational here let's see the operations the graphs here of gain and loss right for each operation and here the equity look at the equity curve very interesting it's been here since the beginning of March because it's five minutes right so it doesn't pull back too much let me filter here so we can see this graph better so let's consider that two thousand and twenty-three March I'm going to take it from the first day here ok so it makes it easier for us to see here the graph I'm going to increase it a little here and see that the very good equity curve saw this result here for gold let's look again here the summary summary here the net balance total twenty-four thousand dollars it is theoretically positioned because it is varying the profit factor of one point twelve average of winning operations two hundred and forty-one dollars and when it loses here, right by the back test the average of the losing operations one hundred and thirteen largest operations winner three thousand dollars and biggest losing operation one thousand seven hundred dollars the drodau here thirty-seven percent I consider it high I think you need to do some tests to consider a better drodão result, right ?
eleven point thirty-nine percent of course one thing to observe many people see on YouTube asking look I used this same strategy in the mini in if it is giving the bad result of the back test it is normal a strategy you need to modify the parameters to it adapts both to the asset and the timeframe you are using so here for example we are using the average of twenty-nine with ifr of fourteen and a two-period HILO since for Gold it is the best configuration, you can change it and test other configurations to know in fact if it is the best configuration or not so whenever I say here we show the back test results but the most important thing is that you have put the code there on your platform, this one is already PROFIT , black Heard or even in Vector you can also do your back tests and do your own tests to understand which asset it best behaves in which timeframe right for you to get the back test result, put it there in the real account, these automations think that they are going to start making money overnight, it is very important that you do your own tests there and after many tests with your conclusions that you would evolving then do the back test then leave it running with the lowest possible contract for a while there in the simulation account and when you actually decide to go to the real account it will be small even if you are earning money there, right in the simulation account it does not go right away putting a heavy lot in the real account starts small , don't worry, there's a market every day, the most important thing is that you understand the automation process and do the step-by-step to start the right way , so here on the channel, we're always bringing you the way right to start in the world of automations beauty and now after finishing you can decide to copy line line as we were creating here in the video, you can take a print here and simply copy this code or you have other ways to get this code complete source without the risk of copying something wrong forgetting a semicolon and causing your robot to lose money, right, do operations that are not programmed here in the setup so you don't run the risk and have this complete source code, what are the ways you can download it and still have it today the first way for you to have access to this complete source code is a super new thing here on the channel is that you become a supporting member by becoming a supporting member of the elite club you have access direct to the most recent source codes developed here on the channel and for you to become a supporting member just click on the button just below the video called become a member or also in the video description there is a link for you to become a supporting member the second way for you to have access to this complete source code you have to become a member of the club of codes and when you join the club of codes you will not only have access to this source code but you will have access to all the source codes that we have already developed here on YouTube videos and the benefits of the code club don't stop there you will also have access to all the source codes that we develop together here on YouTube for twelve months this and all other benefits you can check there on the page the link is in the description of this video and the third way for you to have access to this complete source code is to enter our community on Telegram. On Telegram I will provide the link for you to download this source code completely free of charge , but be quick because this link will be available for a few days and If you enter our community and the link is no longer available, no problem. Being in our community, you will stay on top of the news here at the robot trader club and for you to join our Telegram community all you have to do is click on the link in the description of this video .
Related Videos

1:20:49
SETUP TRAP STORMER - FABRÍCIO LORENZ E OGR...
Clube do Robô Trader - Profit e Vector da Nelogica
19,612 views

30:03
President Trump delivers his inauguration ...
LiveNOW from FOX
333,143 views

30:31
Full Donald Trump inauguration speech: 'I ...
PalmBeachPost
224,191 views

26:25
Pres. Donald Trump's inauguration: FULL SP...
FOX 4 Dallas-Fort Worth
145,514 views

39:49
How to create MACD TRADER EA for Profit an...
Clube do Robô Trader - Profit e Vector da Nelogica
23,125 views

24:00
Man Insults Keanu Reeves on a First Class ...
Heroic Acts
1,818,947 views

21:58
How I Nailed Trading with the MACD Indicat...
Ross Cameron - Warrior Trading
564,991 views

21:49
Convert TradingView Indicators into Strate...
Michael Automates
852,466 views

26:26
O Simples ROBÔ de DAY TRADE que captura re...
No Risk No Gain - Robôs Para Day Trade
22,977 views

18:26
O Novo ProfitChart Gringo (BlackArrow)! Pl...
EDUca Trader - com Eduardo Melo
34,425 views

8:58
New Rule: Political Firestorm | Real Time ...
Real Time with Bill Maher
1,872,295 views

20:10
How to create HiLo EA BOT Trading for Blac...
Clube do Robô Trader - Profit e Vector da Nelogica
31,314 views

LIVE: Trump Inauguration Day 2025 | FOX 7 ...
FOX 7 Austin

1:02:38
O único vídeo de análise técnica que você ...
Viva de Si
1,543,167 views

28:31
ROBÔ FIMATHE GRÁTIS para PROFIT e BLACKARR...
Clube do Robô Trader - Profit e Vector da Nelogica
38,390 views

30:52
'GOLDEN AGE': President Trump delivers ina...
Fox News
317,593 views
9:29
Order Block no Profit Pro - Indicador grat...
MarconiTrader Indicadores Profit Vector BlackArrow
15,736 views

Watch Live: The Inauguration of President-...
The Wall Street Journal

15:28
Nvidia CEO Huang New Chips, AI, Musk, Meet...
Bloomberg Technology
197,415 views

1:10:47
Introdução a IA com From Zero to Heroes
Microsoft Reactor
521 views