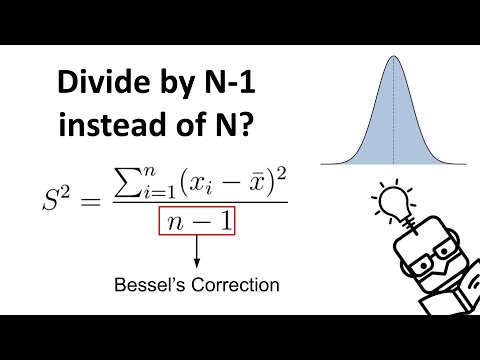
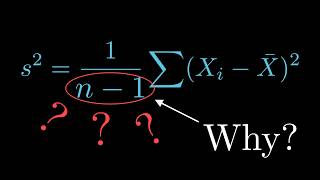
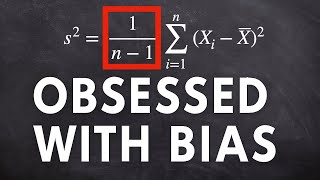
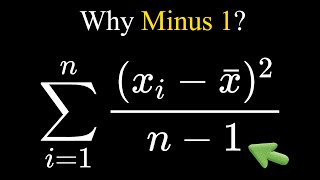
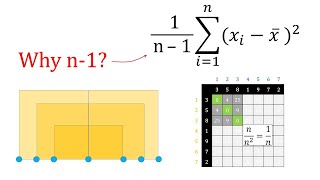
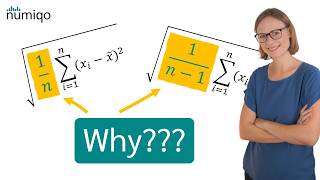
hi everyone this is yml and today we are going to talk about bias correction that appears in the variation formula known as the bezel correction to be more precise we'll explore when and why we divide by n minus 1 instead of n in the equation which calculates the sample variance first things first we need to understand the difference between a sample and its corresponding population so in Statics this we are trying to measure and analyze some interesting facts about the population unfortunately we usually don't have access to the whole data available of the given population
so what we do instead is to take a sample that we hope is significant enough to give us insights about the characteristics of the world population so why does this difference matter you may ask well it matters a lot because if you were to calculate the variance of the wall population then we will not deploy the bias correction that we discussed about at the beginning of the video while if you wanted to estimate the variance using only the information available within a sample from this population then we would have to employ the bezel bias correction
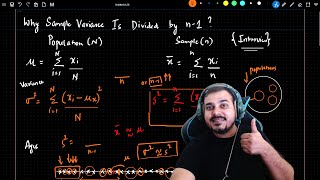
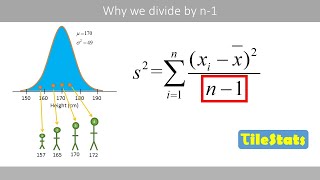
even more interesting if we knew the true mean of the population then again we would not have to employ any bias correction when estimating the variance using the data points available in the sample so what's really happening here to better understand this let's look at an example where we are trying to estimate the variance of the height within a country we know beforehand that the heads are normally distributed and that the average height is equal to 175 and the variance is equal to 36. now because we don't have access to the population data all we
can do is take a sample let's say the following one and try to estimate the variance using the values available in it this time we are not employing the vessel bias correction we can observe that the resulting value is lower than the actual variance of the population we can repeat this experiment Again by taking another sample Computing the variance and we can again observe that the resulting value is a little bit closer but still lower than the population variance actually if we were to repeat this experiment a lot of times and take the average of
the variances we would have observed that we ended up with a value that is lower than the population variance even more interesting if we were to multiply this value with 4 the number of samples and divide it by 3 the number of samples minus one we would end up with a value that is quite close to the population variance I hope that you see where I'm going well in more formal statistical terms what we have been doing previously was to calculate the rough approximation of the expected value for the sample variance without the bias correction
which has been mathematically proven to always underestimate the population variance being always equal to n minus 1 over n of the population variance and that's why the little trick we did previously where we multiply the variance by the sample size and divided the result by the sample size -1 plot us closer to the real population variance the mathematical Row for this is quite long and a little bit accomplice for the videos I want to create but I've left a link in the description if you want to take a look however I would like to dig
a little bit deeper into this and try to build at least an intuition around it to attain that I am going to use a more extreme example where we draw only two height samples one of the things that we can immediately notice is that their mean is not identical to the population mean also their distances to the sample mean is smaller in comparison with the distance to the population mean the same whole stroke if we draw another set of two samples their mean is again different in comparison with the population mean in the distance to
the sample mean is lower than the distance the population mean in fact that's what usually happens for small sample sizes the data points are closer to the sample mean compared to the population mean and as a result by using the sample mean instead of the population mean we usually underestimate the population variance so we have to divide the sum of squared instances by a smaller amount to compensate for this hence for the division by n minus 1 in the variance formula another way of thinking about this if you are familiar with the terminology is that
when we estimate the population mean with the sample mean we lose one degree of Freedom which is the reason behind why we extract one from the sample size let's see what I mean by that so let's say that we draw a sample of three from some random population distribution when we compute the mean of those samples there is no issue we divide by 3 the number of data points in our sample however as I've said when we try to estimate the variance using the sample mean we lose one degree of freedom because if we have
the sample mean we don't need to know all three data points but actually only two because the third can be estimating using the mean and the other two data points so we have to divide by two as a result the amount of information we have when we try to estimate the variance is always equal to 2 in this case or the sample size -1 in General on the other hand if we were using the population mean instead then we will need all the data points in the sample since we can't calculate the third data point
using the population mean and the other two data points and henceforth we divide by 3 or the sample size this is the end of this lecture thank you for watching I hope that now you've got a better understanding of why we divide by n minus 1 when we estimate the variance use it as sample mean please leave a like to this video If you enjoyed it or dislike if you didn't and let me know in the comments below why also don't forget to subscribe to this channel so you can be up to date with the
new content see you next time bye