$14,982.14 using this Formula to Find the BEST Stocks to Day Trade (Step-by-Step Guide)
41.34k views11271 WordsCopy TextShare

Ross Cameron - Warrior Trading
Download my Stock Selection PDF Worksheet 💻 https://warrior.app/how2-find-stocks-pdf
We now offer ...
Video Transcript:
in today's episode I'm going to teach you how to find stocks to day trade every single day with consistency and confidence you know how we're going to do it we're going to do it by creating a process that is repeatable I'm going to share with you the process that I've been using every single day for more than a decade to find the best stocks to trade what you might find interesting is that on any given day I'm typically trading different stocks that's because as an active Trader I crave volum volatility it goes without saying that
you don't make money buying something at $5 and selling something at 5 you want to buy something at 5 and sell it at550 for a 10% return and now the challenge is how do I find the stocks today to have the potential to make a 10 20 30 40 50% or higher return the best way to do this is to search for stocks that have a catalyst a breaking news event this morning I'm going to share with you the tools I use and the process that I go through every single morning to find these stocks
we're going to jump onto the screen share and what you're actually going to see is my trades from today will be a perfect case study of this system that I use I'm up $1,982 14 and I did that finding a stock through the system I'm going to share and then trading it according to the momentum trading strategy that I'm also going to share with you in today's episode let me be the first to tell you that my results are not typical my my name is Ross Cameron I'm a full-time Trader in fact I funded my
first real money account in 2001 that was when I began trading and back in those days I was trading large caps today it's much different you'll see the stocks I trade they're lower price they're highly volatile and in today's episode I want to compare and contrast large caps versus small caps and help you understand why I think the stocks I trade every single day really are the best for active retail Traders okay let's go ahead and we're going to make this slide Deck full screen we've also got my whiteboard here so if we need to
take some notes and draw here this will be helpful for you guys and we're going to start with going over the topics for today's class naturally I'm going to share with you what I think are the best stocks to day trade in my humble opinion I'm going to share with you five pillars of stock selection the criteria that I use to evaluate whether or not a stock is even worth trading I'm going to share with you the scanners that I use and how I filter them and how I've used the settings to search the market
in real time for the stocks that I think are the best we're going to talk about large caps versus small caps and I'm going to share with you my day trading strategy are you guys ready to jump in we've got a lot to cover and for those of you that want to be able to have all the notes for this class in one nicely organized place I'm actually going to give you a PDF that you can download the PDF right here it is a six-page PDF that's going to break down all of myit criteria for
stock selection including my process there will be a link pinned to the top comment and Linked In the description that you guys can download so check out that download that way you don't have to take notes while you're listening you can just enjoy this episode and then print out the notes later and use them um on your own as you're practicing as always I'd encourage you when you're learning a new strategy and you're practicing the strategy that I share with you practice it in a simulator to test it out before you take the risk of
putting real money on the line so first before we talk about the best stock today trade let's talk about the worst stock today trade I think by looking at the very worst this can sometimes help just to sort of invert it because now you know what you don't want to trade and and no offense to Ford Motor Company and to anyone driving a Ford this is not a a personal attack by any means but Ford is not a stock you want to day trade why because it's going sideways this is a barcode we we call
stocks barcodes when they look like this and pop off the cap of these two boom boom boom boom boom it's going sideways you don't make money buying a stock that goes sideways so a stock like Ford a stock like Bank of America serious satellite radio these stocks just go sideways in fact if we looked at the market right now I would wager that approximately 98% of all stocks in the market right now are trading within a range of less than 5% up and less than than 5% down so that's the bulk of all the stocks
in the market but there are a small percentage right now that are up more than 5% uh or down more than 5% and these are the ones that we want to pay attention to these are the stocks doing something exceptional today and for most of them they've got a catalyst they've got a reason to Buck the trend of the overall Market they're up 30 40 50% in some cases because the company just came out with breaking news and it's good news and and investors are jumping on it so a stock like Ford you can obviously
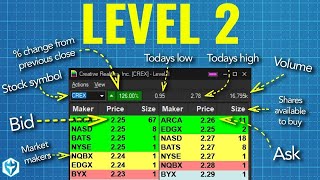
see the chart is going sideways and if you looked at the level two this is called a level two window it's the depth of the market so this is actually showing us all of the buy orders on the left this is the bid and all of the sell orders on the right this is the ask this is the auction where all the buyers and sellers come buyers are sitting here sellers are sitting here and they're waiting for Traders to come and buy their shares or sell shares to them so what we notice here is that
this is what we would call a very thickly traded stock you've got two four six8 10 12 14 15 and even more because I'm not scrolled down all the way 15 buyers all bidding at this same price of 1044 now you might think 15 buyers in the entire stock market that's not too many but this does have 27 million shares of volume and each one of these buyers represents in some cases thousands or tens of thousands of shares so this is hundreds of thousands even millions of dollars sitting on the bid waiting to buy and
they have the same thing on the offer so when a stock has this many buyers and sellers I want you to imagine for a second jumping into a swimming pool filled with oatmeal how slow you would move through it it might even hurt when you jump in this is a stock that's going to move very slowly there are so many buyers there are so many sellers in order for this stock to go up 10% it would need millions and millions of shares of volume it would need so much volume that in fact it it's almost
not plausible that it would go up that much in a single day and you know what that makes Ford a great stock for a pension fund for a mutual fund maybe for a 401k because you don't want a stock that's going to drop 50% in one day and if you don't want to drop 50% in one day also means it probably doesn't have the potential to go up 50% in one day so you want to reduce your risk for those long-term holds where you really want slow steady gains but as a day trader slow and
steady gains aren't going to pay the bills now when I got started I had a goal of producing $11,000 per week from the market but I didn't have a big account I wanted $1,000 a week and when I first funded my account I funded it with $5,000 so to make $1,000 a week with a $5,000 account that's a 20% weekly return getting 20% a week is not easy getting 20% a year is not easy and you're not going to do it with stocks like Ford or Bank of America or satellite rate series satellite radio or
any of those you need to find a little bit of a different area in the market now of course everyday Trader I suppose is going to come to the market with a different account size perhaps different expectations different goals but what I have found is that most retail Traders most of us start with relatively small accounts and so in order to make money we need stocks that are going up 10 15 20 30% 40% 50% or maybe even more in a single day and what you're going to learn is those stocks all share a set
of common denominators those are the five pillars of stock selection that I'm going to share with you so this I would say is one of the best stocks to trade certainly today this is my pnl for today like I said just under $155,000 and I made it in about well the 12,000 I made in about 30 minutes on CG that was my best stock that I traded today and this is a day where I I really did quite well this is five uh sorry three times my $5,000 daily goal so I had made a promise
that anytime I was double the daily goal or higher I would teach a long form episode about the strategy the process or the technique that I used on that particular day and so the topic of today's class of courses how to find the best stocks to day trade and by the way if you haven't already hit the thumbs up or subscribe to the channel I hope you do both so you can watch more episodes about trading strategy just like this one so this is of course the stock that I trade today and I'm going to
do a case study on how I found this stock and why I chose this stock out of all the others in the market that I could have possibly chosen this is another stock this was just on uh Monday a share all the way up to nearly $11 an incredible intraday move and in fact by the end of the day it went up to nearly $21 a share this is another stock a third one here this stock uh again very big move from 50 cents up to a dollar a share up over 100% on breaking news
gave me about $11,000 a total profit on the day in part thanks to that stock and this was actually uh my best day in the last uh well the LA this year my best day so far this year and this was about a month ago uh we had a stock that went up about 600% from $2 to $12 here absolutely incredible and this is a day where there was a lot of stocks that were trading really nicely I locked up 45,000 but in fact every single stock here all of these stocks share the same common
denominators that I'm going to share with you okay so let's talk about the five pillars of stock selection number one is price so I have found that I do the best test on stocks between 2 and 20 now when I first started trading I was part of a um uh when I was in school in the late 1990s we had a semester dedicated to the stock market where it was sort of a stock market Club where every day we were partnered up with uh you know kids that were in the in class and our teacher
would come in and we had sort of a mock um stock market that we created in the classroom and we were updating based on the current stock prices of these um stocks and we had this big chalkboard and we all had our little portfolio that got me inspired and so in 2001 I funded my first account with real money and at that time I bought large cap stocks because I really didn't know anything different anything better so I bought shares of companies that I was Vaguely Familiar with Exxon Mobile us steel caterpillar um fizer these
were shares of large companies S&P 500 companies Dow Jones Industrial Average companies general motor General Electric that I just sort of knew about you know what happened over the course of the next 3 months my account was more or less unchanged because I bought into stocks that while now 20 years later have pretty much all increased in value over the course of three months didn't really do that much and certainly wasn't enough with my small thousand account to give me enough money to put a whole lot of attention on it so when I came back
into the market and became a full-time Trader years later after I uh graduated high school and gotten through college I took a little bit of a different approach I had a friend in high school his name was Ben who actually made $116,000 trading a penny stock so when I came in back into the market I decided that I should trade penny stocks just like Ben if it worked for him in high school I thought surely it would work for me and I actually struggled with penny stocks and the reason that I struggled with penny stocks
was because I had a really hard time finding the best ones to trade so I would Google penny stocks that I should buy and I would see these Yahoo message boards and you know these different like articles or websites where you put in your email and they'd start sending you emails for hot penny stocks and while some of these stocks went up a lot of them crashed miserably and so I lost money on them and I got frustrated and after a period of about two years of trial and error I accumulated a lot of trading
data and a lot of losses and what I discovered was that I didn't make money on large caps mostly because they were too expensive they didn't move enough and for me it felt like I was fighting against the high frequency trading algorithm they were always one step ahead of me I didn't make a lot of money on these really cheap penny stocks because they always seem to crash and burn but in fact the stocks I tended to do quite well on were priced actually between about $220 and these are my metrics uh right here that
you can see on the screen this is uh data of about 27,500 trades about $13 million in gross profit right here and you can see the bulk of my profit is trading stocks between 2 and 20 I've done well on stocks over 20 but periodically I'll get a couple nice trades on something higher and every now and then I get some trades on something a little lower priced but if I was going to tell a beginner Trader The Sweet Spot that's the most consistent for me I would say it's going to be between 2 and
20 that's the spot you really want to focus and in fact within that sweet spot between 5 and 10 is really the best and you know why it's because I take the approach of focusing on base hit trading if you watched some of my other episodes you may already know that rather than try to swing for home runs My Philosophy is that I want to just lock up a lot of nice small base hits I don't want to take a lot of risk I don't want to try to swing for a home run or do
anything crazy I just want a nice base hit trade and to me a nice base hit trade is a trade where I lock up about 15 cents per share of profit and you know what I found it's a lot easier to find 15 cents a share per day than to try to find a150 per share per day even though it may be 10% here on a stock that's priced a $150 and this is 10% on a $115 stock this is a lot easier to find 15 cents a day and so I started searching for 15
cents a today and I found that stocks below two getting 15 cents can be trying to get you know 10% in one move that could be a little tricky stocks above $10 well those can go up and down more than 15 cents so quickly the losses can get a little big so the price range of 5 to 10 is sort of The Sweet Spot for trying to capture those nice 10 15 20 cent base hits and hey every now and then you're going for a base hit but you know you kind of get lucky and
you get a 30 40 50 Cent win or even a dollar a share it's always nice when that happens especially when you weren't really taking a whole lot of risk so the first pillar of stock selection for me is to find a stock each day that's priced ideally between 2 and 20 the second pillar is to find a stock that's already up at least 10% now as I said in the entire market right now of thousands and thousands of stocks that you could possibly choose let's see how many right now in that entire Market are
up more than 10 %. so we're going to go down here we're going to scroll down so well this is the top 50 so right now we've got about 50 stocks in the market that are up more than 12% this only shows 50 stocks so out of all the stocks in the entire Market 99% of them are not up more than 12% all right there's a very small handful that are so what we can kind of do in a sense is we started with let's say 8,000 different equities in the market and now now just
by saying minimum 10% we've now filtered this down to about 50 stocks wow that is pretty good if you're trying to find the needle and the hay stack this has actually made it a whole lot easier so now we've got 50 stocks to work with Okay but wait a second let's not forget price filter so we've got to add that price filter on there between 2 and 20 if we do that we're going to probably knock this down to about 40 stocks what you're going to find is that most days the biggest percentage movers are
lower price stocks it's not very common to see $100 $200 a share stocks up uh 30 40 50% in one day so all right so now let's say we've got approximately 40 stocks on any given day this scanner right now is not doing a price filter this one is actually showing me everything in the market that is up more than uh well actually it's more than 5% but it's just the top 50 and it's sorted from biggest percentage Gainer to lowest so okay we've got a good list here but let's see if we can filter
it down a little bit more number three the stock should have high relative volume this is a phrase that not everyone is familiar with relative volume is the amount of volume a stock is trading today relative to what's normal for that stock okay so let me give you an example here we've got a C today cing this is the stock that I traded and it's currently trading on 993 times relative volume the relative volume ratio so shows 993 and what that means is that it's trading 993 Times Higher volume today than what is average for
that stock whoa so what is average for the stock well yesterday it traded 104,000 shares and today it has 100 million shares of 100 million shares of volume this is absolutely crazy we've got 98 mil 582,000 shares of volume right now by the end of the day this is going to be over 100 million shares unbelievable how does the stock go from 100,000 shares to 100 million shares overnight well the result clearly is a catalyst now in in contrast to what some people believe it's not about the stock that has the most volume there may
be stocks out there that have more volume but it's about the stock that has the biggest imbalance between what is average and the volume that it's experiencing today so high relative volume is important because it's a symptom of a stock that is experiencing a likely once in a year perhaps once in a decade type of event for a stock to go from 100,000 shares to 100 million clearly something big is happening for that stock now if a stock trades on 100 million shares of volume every single day then 100 million shares even though the number
is the same isn't really significant we look for the things doing the stocks doing something exceptional because that's where things get exciting so number three pillar number three is high relative volume and I set at a minimum of five now if we look at this scan back here you're going to see that there are going to be some stocks on here that have lower relative volume because this scanner is just searching for the biggest percentage gainers and then I manually sort out which ones I like from which ones I don't like so this has relative
volume of zero this one's got. 39 this one's just over the cusp at 5.89 5.39 this one's good this one is too low too low too low good good right so now we add this additional filter so we've gone from 50 and let's just make this a little bit easier so we went first from 50 we added our first filter which was uh price and that actually didn't do a whole lot because there's a whole lot of um stocks that have low price but are not appropriate so if we actually filtered it sort of based
on which ones will do the biggest uh damage 10% brought us down to about 50 stocks and then adding price brought us down to about 40 and now adding five times relative volume has brought us down to probably about 25 stocks so all of a sudden we have filtered down from potentially 8,000 stocks to day trade to 25 we can do better okay we've got to find two to three good stocks to trade just the way I found a few today I've got a total of four stocks I traded and I'm green on all four
okay so let's jump back in here number four is we want to find a news Catalyst this is preferred a news catalyst is going to be the reason the stock is up as much as it is now there will be times where a stock will go up without a clear Catalyst I don't love it when that happens cuz I always feel a little like it just doesn't make sense but there are times a stock will go up with clear Catalyst and it's still worth trading because it's very obvious it's maybe the number one leading percentage
gainer in the entire market so in those cases okay fine I'll trade it but for the most part we prefer to see the stock has a news Catalyst and in this case CG we've got a catalyst here which is um that they were issued a patent so now we're going to say we like to see news this is preferred so now we're going to come down to probably about 15 stocks okay that's good now we've got one more filter that we're going to add right here okay and this is float float is the number of
shares available to trade so we'll jump back into the slide deck we'll jump forward to float pillar number five see there we go we want to see a float of less than 20 million shares available to trade so if we go back to our scanners the number of shares available to trade is determined when a company does its initial public offering and then of course the float can change if the company does stock split a traditional split or a reverse split or if the company does share BuyBacks uh or if the company does uh secondary
offerings which will dilute the value of the of the stock so in this case here if we're going to say the filter's uh 20 million shares out out this one's Barely There out and out okay so now what we've done is we've whittel down our list to generally speaking it's going to be about 10 stocks and what I'm going to focus on my Approach is that I'm going to focus on the stocks that have the highest number one percentage gain so I'm going to focus my top list each day is sorted by Leading percentage Gainer
this is how it's sorted and then from there I'm going to make sure I only focus on the stocks that are priced between 2 and 20 that have a float of under 20 million shares lower is better and have high relative volume and then I check to see what the news is so I check the news the news isn't going to be on here I'm going to check it separately and when I do this I'm going to be narrowed down each day typically based on the top percentage Gainer we're going to go back to the
top of the scan so we've got two stocks at the top of the scan that are reverse splits they don't have high volume and they're not um they're not worth trading so those don't fit into the strategy because the Gap is 4,000% but it's not because it's actually gapping up that much it's because the stock conducted a reverse split so the first true gapper is c n right here cing this is the number one leading gapper that is a true gapper not from a reverse split okay so when I pull up this stock right here
let's go through and let me let me actually jump over here I'm going to jump into the slide deck for one second so these are our five pillars and I want to kind of walk you through the way these scanners are set up so my scanners are searching for these stocks in real time but as you'll see there's a couple of different scans on here so this scanner here is a list that's giving me basically what I would consider to be the top candidates at this very moment however by the time the Stock's up 165%
naturally I've kind of missed some of the move so how do I find it when it's up 15% 20% it may not yet be the number one leading percentage Gainer but it's moving in the right direction and the way I find that is with this scan right here this scanner is kind of like radar for the stock market it is searching the stock market in real time for stocks that meet these criteria so it's actually sorting through all of the data of stocks making new highs new lows moving up and down as long as they
meet these criteria right here I'm going to get an alert so I now have a radar that is alert leting me in real time if a stock meets my criteria so this morning C hit my scanner when it was about $3 a share so let's go way back here it hits the scanner right here as soon as it's up more than 10% the stock hit my scanner okay so at that moment it hits my scanner my high day momentum scanner and now I pull up the stock and I begin going through my due diligence process
to decide whether or not this is something worth trading so I want to talk for a second about small caps versus large caps and then I'm going to share with you the five steps of my day trading strategy from the moment a stock hits my scanner to the process I go through so basically what we're going to take is those first few minutes when I'm taking my first trade and I'm going to break those down kind of decision by decision and walking through the process because it's a process that is repeatable that I follow every
single day and that you can learn and Implement in your own trading as always I want you to practice these strategies you're learning in a simulator to test them out to test to see whether or not you have the aptitude and the discipline to follow the rules of the strategy I'm going to share with you because I'm going to give you the road map I'm going to share with you the strategy but you have to have the discipline to follow the rules so back when I got started I started with large caps and large caps
were appealing to me at that time because well really it I didn't know better I didn't know any other way to find stocks to trade and I just sort of assumed if you're going to be trading in a stock market you should be buying these big companies that everyone knows about and everyone's heard of and while there's some uh value in trading these it's actually not where most retail Traders are focusing now small caps generally speaking are uh stocks with a market cap of under $2 billion and large caps are stocks with the market cap
greater than $2 billion so stocks priced under $20 are typically small cap stocks um and the market cap calculation is the number of shares outstanding multiplied by the current share price so usually you need either a lot of shares outstanding like is the case with Ford so Ford has four billion shares outstanding so even though the price is only $10 a share 4 billion shares time 10 4 * 10 right you've got a market cap way in excess of 2 billion okay but most stocks that are8 $10 a share let's say they only have 20
million shares available to trade 2 time 20 that's a $40 million market cap that's a really small market cap so that's considered a small cap stock I want to talk about the pros and cons of large caps for a moment because occasionally I'll see people in the comments who'll say Ross you know I don't know about small caps they're so volatile I I wonder if I'd be better off trading large caps and there are some pros to trading large caps the pros is that large caps are scalable to larger size you you can trade large
caps with 3040 million you could take massive positions moving in moving out maybe not necessarily day trading but there are people that day trade Nvidia Tesla and some of these huge stocks with massive positions and you could do quite well now large caps are usually slower trending markets you don't see a large cap go up 50% in 10 minutes the way you do with a small cap so comparatively they're slower trending they often have very good respect for the volume weighted average price and the reason is because there's a lot of institutional traders who are
told to accumulate a position on a large cap stock and they want to try to accumulate it at the best price and so if they're a buyer they're going to buy as the price comes down to volume weight at average price vwap that's the equilibrium price of the stock over the course of the day and so there's going to be a lot of buying support at VAP so it's well respected for some people uh large caps can be a higher beta proxy for trading the overall market and what that means is that instead of trading
the S&P 500 when the s&p500 goes up they might trade Nvidia because Nvidia will go up but with more volatility so for every point the S&P goes up Nvidia might go up let's just say Five Points so it amplifies the return of the S&P 500 so some people will watch the S&P 500 during uh periods where economic data is going to get released but instead of trading the S&P 500 they'll just trade this higher beta which means it's a higher it's going to have a higher reaction proxy for the overall Market this large cap stock
so whether that's Google it's Facebook it's Apple it's Amazon it's Netflix it's whatever you might want it's uh it's basically uh trading as if it's the overall Market it's kind of an interesting strategy another uh popular reason people will trade large caps is because you can usually get leverage on them which means you could trade on borrowed money the Brokers are comfortable offering leverage on large caps because generally their volatility is is more manageable and it's not expected that they're going to drop 50% in one day and result in a lot of margin calls and
likewise for the same reason you can usually usually find shares available to short it's rarely an issue to short a large cap so for these reasons large caps can be popular and appealing however there are some drawbacks one of the things that I find really frustrating about large caps is erratic order flow which is due to institutional trades and what I mean by that is as you're watching the chart and you're watching the level two you might be watching a technical setup for let's say the first candle to make a new high on a bull
flag or an ascending wedge breakout and all of a sudden there's a flash of a huge cell Lord that goes through and it totally ruins the pattern and it wasn't because someone was like this pattern's broken and I'm going to short it it's just because some institutional Trader got an order from their boss and their boss to go and sell a block of 50,000 shares and so they just sold it and they just dumped the shares and it breaks the pattern and so you're all focused on this technical pattern and then someone comes along and
breaks the pattern because they're just a random order but when you have a stock that is so popular among pens Pension funds mutual funds 401 K long-term investors big investors small investors you're going to have these random orders that come through and just break the pattern and if you're not expecting it it could cause you to stop out of the trade which then creates even more selling because now all these people are stopping out and then maybe it rips back up because people buy the dip but that creates erratic order flow and erratic price action
which becomes really frustrating you're going to get stopped out more frequently there are also few fewer opportunities to trade large caps that have really high relative volume because on any given day if we're looking at the scan of the stocks with the highest relative volume you're going to notice consistently I'm going to pull up the top relative volume scanner here so top relative volume scan let's look at these stocks these are the top relative volume stocks in the entire market right now none of them are large cap stocks not one of them and this is
just like the top 20 none of of them are large caps so if you're looking for big imbalances between supply and demand resulting in high relative volume where you're more likely to see big percentage gains you're not going to find them on large caps now it's not to say that you couldn't trade large caps and instead choose to trade options because you could but then you're dealing with a whole another issue the issue that now you've got options algorithms fighting over expiration dates expiration prices and then you've got quadruple witching which occurs so as a
result you've got traders that are battling to keep the stock above or below certain prices because of strike prices additionally these are higher price and you get lower percentage moves which means you generally need a bigger account in order to trade them now going back to options you could trade options but then you've got the risk of time Decay IV Crush implied volatility crush and the risk that they can expire worthless if we're going to be honest honest large caps are dominated by high frequency trading algorithms and it's a highly competitive market and the reason
it's highly competitive is because it's so liquid and so that incentivizes institutional Traders and their trading desks to create high frequency trading algorithms to be the market maker to be constantly buying and selling shares all day long it's a game of Arbitrage and they hire some of the most sophisticated phds from MIT to develop these algorithms to print money so you're trying to compete and literally in a lot of ways trade Against the Machine so what I've learned is that the best Traders here that are trading large caps the ones who are making the most
money they're not retail Traders they're not like you and I they're Warren Buffett they're Bill Amman they're hedge fund owners they're billionaires those the people who are making a lot of money trading large caps and then the other people that make money trading large caps are the people not trading them but who buy them and hold them so the people I suppose that really make the most money trading them are highfrequency trading algorithms and market makers it's not retail Traders so if we look around and we're saying where are the millionaire Traders and what are
they trading they're not getting chopped up by the high frequency trading algorithms of large caps most millionaire traders that I've met are not trading large caps that's not where they made their money now some millionaire Traders make their money trading small caps and then begin to venture into the large cap Market once they have the account size to afford it and they can tolerate the swings and that erratic Behavior but that's when they're getting into not really day trading but holding for longer periods of of time so let's go back to small caps what are
the pros and cons of small caps small caps are less correlated to market returns the S&P 500 can be dropping and a small cap stock still goes up 100% because it has news they are high volatility which some people would say is a drawback but I think it's a plus because it means that you can get a bigger percentage return with shorter hold times you get large percentage returns in small caps there's no question about it we look at the biggest percentage gainers today once again these are all small caps now you do have um
this is a this is a midcap stock you've got 31 million uh 3 $31 a share and you've got a 100 million share float 126 million share float so this one's getting a little bit on the bigger side I will I will certainly admit that that one's getting bigger but for the most part we're going to find that this Gap scan this Gainer scan is dominated by small cap stocks with a few exceptions here and there small cap stocks these are the ones that are making the big percentage moves each day so that means they're
going to be more popular with small accounts they're fast moving markets now fast moving means you've got to make decisions quickly and I'll say that that could also be a drawback for some people it's a it's a bonus but it can also be a drawback not everyone's able to have the aptitude to make quick decisions and to trade quickly but the traders who I've seen who have been the most successful are doing it trading small cap stocks so they're very popular among retail Traders as well and this is where I see a history of millionaire
retail Traders not millionaire stock market investors but millionaire retail Traders now if you want to look at millionaire Traders you may also find them uh in other areas of the market of course people that bought cryptocurrency and held it for years and years and years but those aren't day Traders those are people who bought and held an asset that went really an asset bubble that went up absolutely crazy so that's different and one of the things that's really nice about small caps is there are frequent opportunities nearly every day I mean if we look at
my uh my calendar you'll see that it's very rare that I don't find an opportunity to trade pretty much every single day I'll pull up my calendar here so you can look at it so this is just this year and you see it's like every single day I'm finding stocks to trade you go year-over-year 2023 there's a couple of days I'm out whether it's a sick day or maybe it's a no trade day because there was nothing to trade or it's a market holiday but I'm not someone who takes long breaks with large cap Traders
I see they'll take four or five days without taking a trade so they're just sitting showing up every day doing nothing they've got nothing to trade because the opportunities are fewer and further between so some of the Cons with large with small caps are that you don't always have leverage it's not always available so you might pull up uh the level two and you realize oh I need 100% cash balance to trade it so I can't use my leverage on it you'll also notice that a lot of these are hard to borrow or they're expensive
to borrow there's no options chain which is a plus and a minus because you don't have the high frequency trading algorithms fighting over expiration prices strike prices but you can't get those crazy returns that people got on GameStop faster uh lighter volume at times so at times you'll have a stock that goes up 100% 200% 500% on really light volume which is really a shame because it presents an opportunity but it's hard to trade it you can't take big size so that's always disappointing when that happens um and then as I said fast moving markets
this can be tough for some people because you get such a quick move it can be uh you might feel that you're chasing it and so learning how to buy high and sell higher how to capitalize on that volatility without falling victim to getting in too high knowing how to cut your losses is critical small caps have secondary offering risk these are often lower pric companies that decline in value over time and we see unsavory practices of some of the underwriters the institutions the the investment banks that are helping these companies raise Capital by selling
shares on the open market something that's kind of interesting is that large caps tend to have this kind of pattern you know gradual up and then Panic stops out a lot of people and then it kind of rallies back up this is over the course of days months weeks right so weeks months so years even we just sort of go up and then we get these panic drops where whereas small caps a lot of small caps are doing the opposite they're selling off over long periods and then we get a reverse split we get some
breaking news and they pop up 500% maybe over the course of two three four days and then it kind of resumes this downtrend goes out of popularity and then again reverse split news it squeezes up 500% and these are the areas where I get really interested because these are stocks in these positions that are often at all-time lows they're really beaten up and you're buying it with a news Catalyst right off the all-time low now granted you may be getting in when it's up 20% 30% on the day but it's 30% off the all-time low
it feels like relatively speaking I am getting in this at a pretty low price and some of these end up putting in some impressive moves so let's pull back um our chart here on C because you're going to notice this is one of these examples this is a stock that's been beating up for quite a while so they did uh their initial public offering we've got to go backways and the stock then sold off for a while so if they do their IPO it sells off down here it drops down but then look at this
bounce that bounces up big time sells off again comes back up again sells off again bounces back up again sells off bounces up again sells off a big bounce right here and then it sells off again and so we keep seeing this trend of sell off and then Big Bounce sell off and big bounce so these big bounces off the low this is the one that bounced that was a 600% bounce right there look at this one that's a huge bounce so these are the times where these can be very interesting catching these bounces off
the lows so yes these are stocks that are not good investment grade stocks that you want to buy and hold for a long time but these are stocks that when they bounce can bounce up 200 300 400% in a single day when they have good news and people who are shorting can very quickly get stopped out and that can be where things get exciting so now let's jump back here into our slide deck all right so so the pros and cons of small Cap Caps have kind of led me to feel that my Niche is
in the small cap Market retail Traders dominate the small cap Market when I look at the most successful retail Traders people who are day trading every single day they're trading small caps now some of most of them are trading long some of them are trading short some of them may be holding overnight but most of them are trading small caps some trade penny stocks as well so you find you've got to find your Niche and finding your Niche means practicing right so those of you who haven't already downloaded it pinned at the top of the
comments and Linked In the description is my small account strategy PDF that's that's the criteria in the process that I use every single day for finding the strongest stocks to trade I have um that PDF let's see I've got this right here it's a six-page PDF that you guys can download but once you go through that you're going to start to get a sense of the type of stocks I'm trading every single day when you watch more of my episodes here and we're going to jump into the technical analysis section of my strategy you're going
to start to get a sense of where I'm getting in and where I'm getting out you're going to want to practice this strategy and test yourself to see if you can find success with it because this is where we're seeing volatility this is where I'm seeing opportunity every single day and although you could and you know you may find that for you you do better on the stocks between $2 or between 20 cents and $2 you may find that those cheaper ones work better for you and that's totally fine for me um I I find
that two and and 20 is the best and between five and 10 is kind of The Sweet Spot so let's talk about my day trading strategy and I'm going to use CG as the case study and now we're going to get into the weeds of this actual trade that I took so C obviously it's the number one leading Gainer so step one is to find the stock that's moving CG up 161% but when I first found it I found it off my high of day momentum scanner so it hits my highay momentum scanner so I'll
pull up that scan real quick so it hits this scanner right here CG it was right at it was it was the second the news came out so it was at 7:45 a.m. it hits that scanner as the stock is popping up 5% 10% 15% 20% right it's hitting my scanner it's alerting me so then I'm like what's the news so I check my news window right here and it's already populated the headline that 7:45 they were issued a European patent for lead asset for the treatment of ADHD and I'm thinking all right ad HD
is very common you know millions and millions of people have it this isn't a super obscure illness that is not going to be popular if they've got a patent here for something that big that could be that could be significant now having said that I know from experience that uh patent trademarks are are not always huge headlines so initially I was a little skeptical but I said let's proceed with technical analysis and by the way when the stock hit my scanner I I checked the following price percentage change float relative volume and those were all
check check check check so very quickly I was able to do my due diligence on that and that led me to my next step of pulling up the chart when I pull up the chart I see right here it's a recent reverse split you see that s so what that tells me is that this stock recently did a reverse split I could pull up the filings I don't have to because it's I have all the data in my scanners but I'll see that as of August thir 13th the float was 950,000 shares so it's a
very lowf float stock which is great and what we know is that that's the result of them just doing this reverse split so if we check on our uh charts here we could see the ratio of the split so the ratio of the split we could also see it if we go into the last um the last earning statement so back here they had a float of six million shares so it would have been well approximately 10 to one that would put it at 600,000 shares let's just check to see what it is so it's
12:1 so it's a 12:1 uh reverse split so they do a 12:1 reverse split and that had the effect of reducing the float so now the float is really small what is float it's the number of shares available to tra to trade it's also Supply in the supply demand equation so the supply level is very low okay now the stock hits my scanner and it starts squeezing up I pull up the chart I do I check the daily chart and what I see on the daily is we've got a lot of room the 200 moving
average it's nowhere nearby so I'm like great we're not running into resistance I see it's a sold off pattern I love these patterns for the bounce off the low this is one of my favorite it's it's definitely in contrast to a stock that's more extended stocks that are more extended ums this one for instance large cap not a large cap it's a higher price stock they put in a nice move today no doubt but I usually find that when these stocks get more expensive they get a bit harder to trade especially as they grind higher
there The Sweet Spot usually is down in this area for me and we got some nice trades on this one when it was down actually no we didn't this was I'm thinking of a different one um anyway so so uh so then let's go back here so I pull up the one minute chart I pull up the 10-second chart the one minute chart and as I pull it up I'm looking for a possible entry and I actually went red on this stock on my first trade so let's go back to see C so cing all
right so we're going to jump zoom in here okay so I'm going to pull up my charts here look at my orders so CG it was at uh 740 I took my first trade at 7 about 749 so the stock pops up here initially but not a lot of volume but then I guess some Traders saw it it starts to move up a little higher and people see oh the stock is moving up it closed yesterday at a $180 so now it's at 220 it's at 240 it's at 260 it's at 280 so now all
of a sudden we're gapping up 40% on very light volume it hits a high of three it pulls back it comes back up here to a high of 340 it dips down and my first trade on it was buying let's see I got in right here for the break through this level we pop up we dip down just for a fraction of a second and I got in at 320 it pops up here to a high of 343 I take my profit on my first trade and I made about like $300 it was a small
winner now for those of you who don't know I have a strategy that is very defensive I don't want to be too aggressive when it's not the right time so I start each day with a cap generally of 5,000 shares until I'm up more than $1,000 now when the Market's hot and I'm doing really well my starter will be a little bit bigger so it can fluctuate a little bit but on um CG I took 5,000 shares average was about 321 so it ends up popping up here to 340 and I take some profit on
it so it goes up let's see to 3 uh 30 335 I take profit at 332 and so I guess I must have been up about about $400 on that trade and then it pulls back and I add back right about here it squeezes up to a high of 369 and I'm like fantastic this is called a micro pullback so you get this first move right here which is sort of jumping on the momentum it pulls back and then I'm getting in right here it pushes higher but I didn't take any profit I was looking
for a bigger move it comes down and I stopped out right here so I took a loss on this and I was now R about $300 on the stock the thing that was a shame was that uh I really thought it was going to push higher and so I had added 7,500 shares on that next trade and by the way at that point I was already green on the day because of my first trade on um vssm so i' had already taken a trade on vssm and aisp so I was already up $2,000 so I
was allowed to take bigger share size based on my cushion on the day I just was a little more cautious on the first trade sized up on the second and then went red it drops down and then right here as it curls back up I got back in I got back in at 340 and it rips up here to 380 that's 40 cents a share and I took that trade right there let's see I bought 7500 shares so now I'm backing with 7500 shares at 345 it squeezes up to 380 I'm up, 15500 bucks it
pulls back I buy the dip right down here it squeezes back up to 380 I take profit we hit a high of 391 now I'm ,500 $1,800 $2,500 on the stock I'm now Crossing $55,000 green on the day I continue trading it as it squeezes higher so it pushes higher and I end up adding at 388 and 390 for the break of four we tap four we pull back it then comes up for a second attempt squeezes through goes up to 420 boom fantastic pushes up to 440 dips down so now it's a little choppy
it dips down again comes down and this is where I Drew this line I connected these two dots right here and right here I bought this dip down here it squeezes up to 550 560 and right in this area I am just actively trading I'm buying the dips I'm selling into the breakouts buying dips selling it a breakouts buying the dip off support selling into the breakout it comes up to five just about five it then pulls back right here resistance at that line and now we're stair stepping down so at this point I thought
well maybe maybe that's it maybe this is all it's going to give us and then all of a sudden this thing rips back up here to 480 and I bought that dip right there for the break of five and it squeezed up to 540 we got a high of about 560 and then I sold and I was done so once it started to pull back here as soon as it broke this level I was like nope not going to trade it anymore now if I pull up the one minute chart what you're going to notice
about the technical analysis on the stock is that we traded really well when we were on the front side of the move and once we had our first macd crossover it got choppy the macd crossover was right here so that was where it got choppy clean clean pulled back and then we pushed a little higher so this for me was $10,000 uh got me to $10,000 green on the day $10,000 of profit and this only added an extra two grand even though it was a big move even on high volume macd crossed over it did
curl back up but I wasn't totally confident I didn't want to overstay my welcome and so I ended up saying I'm just going to trade a little more conservatively locked up a little more profit and then when we came back down and broke this level a second time I was like nope this is no good now what ended up happening later in the afternoon was it squeezed up again so false breakout false breakout false breakout and then rip squeezes out short sellers but then comes back down so kind of choppy price action and what you're
generally going to learn is that with these momentum stocks it's better in my opinion to early and it's better to trade aggressively at the beginning of the move and not overstay your welcome that's something that takes time to learn a lot of Traders overstay their welcome over trade and chronically give back profit there's a great book here thinking in bets by Annie Duke and another one right here this is uh the P quit the power of knowing when to walk away walk away before you experience a close call so one of the things that I
have all of um our members doing especially those of course who are going through my uh my the warrior Pro members that are going through day trading strategies and scaling I put them on a trading plan where after they've practiced in the simulator quite a bit they focus on taking just one really good trade a day and building a track record of consistency you do that 10 days first if you have if you're green after those 10 days net profitable you do another 10 days with bigger size another 10 days with bigger size and this
is the way you start to um acclimate yourself and condition yourself to the emotions that come with trading gains and losses and begin to dip your toe in the water of trading with real money you've got to go slowly because one of the biggest challenges with trading is the emotions up here trading psychology I can teach you all of the skill I can teach you the strategy but at the end of the day success comes down to an ability to have the discipline to follow the rules when I look at all the Traders I've known
who have failed failure usually comes down to one of two things the first is they lack a strategy and I've known a lot of traders who they'll trade small caps for a little while and then they're like it moves too fast I keep holding and and getting caught I'm not quick enough I'm going to go trade large caps and I'm asking them how many large cap Traders do you know who have earned a million-dollar badge you look at where you're trading at every single one of our million-dollar badge holders the million-dollar badge holders that we
have right now that are active in the community those are all small cap Traders you look around at other retail Traders like you and I who are making good money what are they trading most of them are trading small caps so this is the area to focus if you're not good at them yet keep practicing there are viable strategies for trading small caps so the first is they don't have a strategy or they abandon strategies quickly and jump from small caps to large caps then they give up on large caps then they go to Forex
and they give up on Forex then they go to Futures they give up on Futures you're trading large caps you think that's hard Futures and Forex are even harder you're trading against the algorithm you're trading against algorithms that are taking into account weather patterns I mean if you're retail Trader that is not where you're going to find your Edge again this is my humble opinion but I just I really believe it so think about where people are finding success number one adopt a strategy that other people are trading right now with success number two the
second leading cause of failures they have the strategy they don't have the discipline to follow the rules you could break a horse to water you can't force him to drink I can give you the road map I can share with you the strategy but I can't force you to have the discipline to follow the rules that's what you have to bring to the table now if you're ready to bring that to the table I would encourage you to do a twoe trial at Warrior trading trade with me side by side for the next two weeks
you'll get a sense of what it's like to be a member of the community you learn about step four how I execute my trades how I route my trades to the market you'll understand my analytics my metrics how I analyze my strs my weaknesses how I make tweaks based on my performance you get a real sense of what it's like to be part of the warrior uh trading Community the warrior Pro community so it's twoe trial we call it the warrior Pro preview because it's a preview of what it's like to be a warrior Pro
member during your trial you will get access to my platform right here so you'll get access to real-time Data stock scanners chat room broadcast My Stream you'll get access to the charts the news feed and it is real-time data so to a twoe trial for 20 bucks you're helping pay your Market data costs and if I'm going to be honest we're actually going to lose some money on it it costs us more in Market data especially if you straddle two months than than than you're paying us however we're happy to give you a trial because
we want to give you a chance to check out the software and I believe so strongly in it that I know that many of you are going to stick with it you're going to say you know what this is going to be my home and I hope that some of you become long-term members of warrior trading and who knows maybe maybe you'll become one of our next badge holders now I want to remind you guys as always if you didn't already know this trading is risky so please manage your risk take it slow and practice
in a simulator before you put real money on the line and I'll remind you that my results are not typical there's no guarantee you'll find success so please take it slow now if you enjoyed this episode I hope you hit that thumbs up I hope you subscribe the channel for more episodes about day trading strategy just like this and I'll see you for the next upload real soon
Related Videos

36:23
How to Predict A False Breakout
Ross Cameron - Warrior Trading
25,107 views

26:48
Trading was HARD Until I Learned These 3 S...
Ross Cameron - Warrior Trading
88,255 views

5:20
I Earn $150 in 10 Minutes - Make Money Onl...
RIMROAD - ROAD RAGE
1 view

39:03
How Millionaire Bankers Actually Work | Au...
Insider
4,067,319 views
17:34
Top 3 Options Trading Strategies for Small...
SMB Capital
429,179 views

57:22
High Accuracy 1 Minute Scalping Strategy (...
Ross Cameron - Warrior Trading
96,268 views
55:21
How to Pick the BEST Stocks for Trading (w...
Ross Cameron - Warrior Trading
234,073 views

26:58
Scalping Is Hard (Until You See This)
SMB Capital
202,578 views

38:58
NEW 💥 I Wish I Knew This BEFORE I Started...
Ross Cameron - Warrior Trading
43,341 views
44:00
How to use Level 2 (with ZERO experience)
Ross Cameron - Warrior Trading
140,209 views
43:13
8-Figure Trader's Easy Money Trades (That ...
SMB Capital
240,982 views
59:15
NEW 💥How Much Money Do You REALLY Need To...
Ross Cameron - Warrior Trading
41,830 views
43:31
How to Trade Penny Stocks for Beginners (w...
Ross Cameron - Warrior Trading
113,956 views
25:54
How Traders (Legally) Pay ZERO in Taxes
Ross Cameron - Warrior Trading
422,438 views
15:14
Are you using VWAP the RIGHT WAY?
Ross Cameron - Warrior Trading
234,655 views

28:22
My Hack for Learning to Day Trade (Pretend...
Ross Cameron - Warrior Trading
30,232 views

55:11
The ONLY Candlestick Pattern You'll EVER N...
Ross Cameron - Warrior Trading
728,017 views

48:15
Reading Candlestick Charts Was HARD Until ...
Ross Cameron - Warrior Trading
483,174 views

22:45
How Traders Use LLCs to (Legally) Save $69...
Ross Cameron - Warrior Trading
159,626 views

2:07:34
Giving Away Profits 😭 LIVE Day Trading Mo...
Ross Cameron - Warrior Trading
84,108 views