My Trading Strategy is Boring But Made Me $18,517/month [100x Strategy]
27.8k views5425 WordsCopy TextShare
Craig Percoco
This is the exact Trading Strategy that I used after spending 8 years, and thousands of hours testin...
Video Transcript:
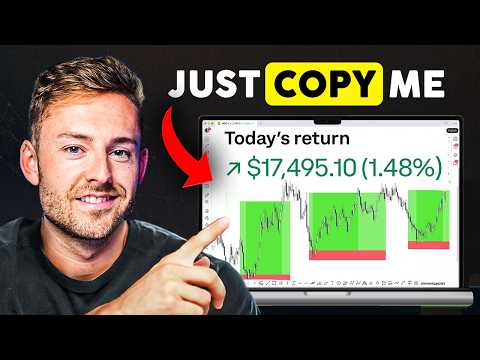
After 8 years of learning to trade, I've had massive wins, losses, and I've tested hundreds of different strategies over those years and spent thousands of hours trying to find the best and most simple strategy to consistently make money. And after years of perfecting, refining, and building, this month, I've had one of the best trading months of my entire career with just in the past 2 weeks making over $18,000 in profit using this simple framework. And what I've learned about trading over this time is that it's really not that complicated.
You don't need to know all these intricate strategies or processes or need to be a genius. And what it's really about is keeping it as simple as possible, following your strategy that works that you can execute on every single day. So, in this video, I'm going to be teaching you this simple all you need to know strategy to make consistent money.
Then, I'm going to show you live examples of me trading this exact strategy so that you can implement it into your own trading. And then, I'm going to show you a way you can start today to practice this for yourself and prove it works. So, like I said, I've been trading for 8 years.
And there's a few things that I've noticed after all of this data, all of this time spent behind the screens. And if I really were to boil it down for you, the two biggest things to focus on are figuring out how to enter in high probability conditions. And we're obviously going to go over what those are.
But just putting yourself in a position where you're generally entering the market where the probability of your move happening is generally a lot higher and you're not just trying to enter in randomly at different points. And the second thing is finding a process that works for you that is simple and repeatable so that you can execute this on a daily basis. What I've learned in business and with trading, if people can't explain their process, their business, any strategy within a couple sentences, they probably don't know what they're doing.
The same is true with trading. You have to keep it simple. Okay?
And it's so important to start with a solid core and be able to add things as long as they're proven to improve your process rather than starting with all this craziness and trying to make sense of it. That's how you can get lost in trading and that's what we want to avoid. So, high probability situations, simple and repeatable.
And using this simple strategy in refining it over the past couple months, in the past two weeks, I've been able to make over $18,000 in profit. And there's a few important things that I want you guys to take specific note of. Okay.
First of all, a lot of people think that you need to win all the time in trading, that you need to know exactly what's going to happen, and if you're wrong, it means you took a bad trade or you're not a good trader. Some of the best traders in the world, they're going to lose more trades than they win. Okay?
And you can see my average win rate for this strategy is actually a lot lower than this. But in the past 2 weeks, I only won about half of the trades, meaning I was wrong or didn't make money on half of the positions that I took. To most people, they take this as an ego hit or they're not able to focus because they think they're doing something wrong and they start changing things or adding things.
I had a 55% win rate and still was able to get this result. Okay, the next thing that is so important to take note of is that of the trades that I lost, the biggest loss was $614. Right?
I'm risking $500 per position. So, with fees and slippage, you'll tend to lose a little bit more. All of these losses were relatively small, and you didn't see massive losses in small wins.
What I was focusing on was picking A+ setups, letting my winners run, and keeping the risk contained. If you can do this inside of a simple framework and practice this over time, this is how you're going to move towards these goals. Okay, mind you, this is a little bit better than normal.
Usually, I'm a little under 40% win rate. So, this week was a bit of an exception. Okay, but nonetheless, you don't need to be right every trade.
You just have to follow your process. And one of the easiest mistakes to make as a beginner trader is having a strategy that is way too abstract or confusing. All right, maybe your strategy is simple, but it's always something different.
Oh, well, London session pushed here, or there was some negative news today, so I did this instead of this, and you're changing a bunch of things based on how you feel or what you're thinking for that specific day, making it way too abstract. You don't want to have abstraction in your trading. You literally want to have it be a systematized, repeatable, measured process.
Everyone is trading the same exact information and like I said, you can add things into a simple process once it's starting to work or maybe it's getting close to working, but you really want to avoid the headache and confusion and pull any sort of decision making in the moment that you have to make other than what's rooted in your practice and rooted in your strategy. So, if your chart has a million different indicators on it and you're taking different setups based on different patterns or different ideas that you're having, this is effectively just gambling because you don't have a process that is simple, making it easier to repeat. Okay?
If you look at something like professional poker playing, these people aren't coming into games without a strategy, just throwing cards around, throwing ideas around, right? That's what most people do when they go to casinos. Most people are losing money.
If you're going to get an edge, meaning that you can win over time more than other people, you have to have a strategy. You have to have methods. And what I'll say is when you're getting into trading, keep your charts really, really simple.
Only add when things are helping. Okay? There's no reason that it should look at all like this.
If you have a simple checklist to follow, a simple process that allows you to focus on your execution, your ideas, your poise, your decision-m, which is ultimately going to lead to those gains, okay? Rather than being on the edge of your seat trying to hope that a trade is going to work out. And this is probably one of the most important things in trading that is almost never talked about, which is that you cannot improve what you do not measure.
Okay? Okay, I started applying this into every area of my life, including business trading habits. Okay, this is why I got a Whoop.
I'm tracking all of my personal metrics. I'm tracking my trading. I'm tracking my business performance.
In order to refine and improve your process over time, you need to have a place to aim, a place to start. And how you're going to do that is by understanding behind all of the emotions and whatever you think you're doing, what is actually going on and what is a simple way that I can approach this to improve it. If you're just going taking trades willy-nilly, very rarely will this ever work for people and it's going to cause random confusion with no measurement and most likely unprofitabit.
Whereas, if you have a checklist and you have measured rules, you're able to make improvements, follow your strategy, and improve because you are measuring. And I'm going to show you how to do that in conjunction with the strategy. So, with those things considered, let's get into this specific strategy and go over my profitability model.
So, whenever I'm trying to find these trade setups, the first thing that I'm trying to do is figure out areas where I'm already in a high probability condition for the market to move in my direction. So, what I'm looking to do is basically be able to get in early on trends and be able to ride big reversals in price. So, if we're looking at a range where price is generally moving, it tends to move into areas where it's relatively overvalued and areas where it's relatively undervalued.
And there's different ways that we can look at this, but overall, you're going to have these big wide ranges. All right? So, if you're looking to buy into something hoping that it's going to move up, the ideal situation is to be able to find an area where it's previously been undervalued and had that similar move, okay?
And you're already looking to enter once you see a confirmed response under that level again and you start to get a move upwards, okay? And the reason this works is because in markets there is buyers and sellers. It's algorithms, it's individual traders, it's institutions, but still nonetheless there's buy and sell pressure.
Okay? And when price is coming up to a level and then moving down, it means that the demand is not outweighed by the supply and there's a surplus of supply here which is going to cause the price to move down until there's an area where the demand starts to outweigh the supply and prices start to regulate up. Okay, so now inside of this overvalued and undervalued framework, we can look at these big swings as individual trends.
Okay, what really is going to outline a trend is that we have for example a downtrend here. We have a low, a high, a lower low, and a lower high. Okay, as soon as we have these four things, that's signaling that we have a confirmed downtrend.
So, just like how we had a wall of sellers here and a wall of buyers here. If we get a confirmation that once again these buyers are starting to win and price is also unable to break out of these levels, okay, we have buyers starting to win again, we no longer have a new low being produced and now this level that previously couldn't be broken is now getting broken. This is where as a trader I'm looking at an undervalued state.
And once we have this condition, what I'm really looking for is a significant sign of strength that we've had sort of a knee-jerk reaction out of that previous level. Either showing price has moved up, has had failure, and is now coming to make a move down, or price was moving down, had a failure to break lower, and is starting to move up. Okay?
And once we have those big pushes, I'm looking for something to be left behind called a fair value gap. If we're starting to get some strength, what I'll look for is a high to be produced, big push to happen and another low to be produced before a push up, which leaves behind this box right here. Okay?
And the same thing is true for the downside. If we have a low, a big quick push down, and then a new low produced, leaving behind this area here, the midpoint of these two things are what I'm going to be looking for for my entry models, depending on the direction that I'm looking to go, whether I'm looking to make money from the market moving down or whether I'm trying to make money from the market moving up. Okay, so this is really going to be my entry model once I have confirmation that I'm in a high probability setup.
So we basically have layers of refining. Okay, so am I in an undervalued area? Was there new strength or weakness and is there a fair value gap that I'm looking at for an entry?
And the final step that I'm going to do when I have something like this is refining down with something called confluences. Okay, so confluences are basically extra added layers of conviction for your trades that's going to help you pick the best setups. So, you can have a process where you're following a less strict rule set, which is going to give you less confirmation.
It's going to give you more trades to be able to see how your edge is going to work, but you're going to have a lower win rate. Maybe you're able to make more money if you're able to take more trades. Or you can have more confirmation, so you're being more selective.
You're filtering a little bit deeper. You're going to take less trades, which could produce a higher win rate, but it's going to give you less opportunities to be able to take trades. All right.
And as I show you examples of these trades, I'm going to show you some of the confluences that I use that you can start applying to your own trades and you can sort of see what works best for you. Okay, so let's take a look at the first trade. This is a trade that I took just a few days ago.
So walking through that same progression here was what I was seeing on the chart. First thing is that we have price coming up and creating this sort of overvalued area. We have our undervalued area where we're getting reactions up.
And then I see price starting to trade back up once again into this potentially overvalued area. And also looking at a simple indicator like an RSI, we can see we're in a key area where we're getting these highlight strips and an immediate reaction down. This is telling me that I'm generally in an area where we could potentially expect for a reversal.
Next thing in this scope that I was looking at was this level, this level, and this level. So you'll notice price holds this level, holds right here, holds right here, comes here, and this is immediately where we have a big push to the downside, which actually breaks underneath this level and has a full push to this point underneath this previous trend. Once again, this is giving us our next defined level of weakness.
Okay, the third thing, if we look even closer, getting into the layers of our rule set, we have this candle creating our low push, a high that doesn't overlap, giving us this specific area, in which case midpoints being targeted, and we get our response. Then we have price pushing down into that area. And something that I also like to do is add something onto my chart called the Lux Algo Fair value gap.
You can set a different threshold depending on how big or small you want these colored boxes to show up on your chart. But basically, this is going to take some of the visual guesswork away and present opportunities for me. Now, there's a bunch of other things that we look at on the private side of our trading team for entry confluences.
But this as a starting point by itself 100% works. Then it's about sort of adding things to it and refining the process down. So, you'll see we're at an overvalued level here.
We have level being broken. Price comes up and pushes. And what I'm looking to do is place my stop loss into a safe area.
this giving my trade room to breathe. Then I'm setting my takerit to allow the trade to fully move and we'll take profit off the table as it goes. Once again, price comes up.
We get an immediate response. Okay. Next thing that I'm doing is once I get price to fully close underneath this level before our entry.
This is where I'm going to bring my stop loss down to the entry. So now it's either that I make a ton of money on this trade, but now I've eliminated a lot of that risk. And going back to the trade log, this is why I have $23 wins, $14 wins, $13 wins.
Okay? And this isn't just after the fact hindsight. This is a recording of me doing this exact strategy in real life.
You can see where I have my trend analysis, right? We finally get our price down. I set to enter my position here.
Price comes up, gets me into my position. We immediately get a nice reversal. Price starts to push up a little bit.
We get our reversal and then we get a continuation fast push down. Now, you'll see I was anticipating this other level here. I was considering taking profit, but I was really trying to play this and let my trades fully run.
Okay? Even though I knew this would be a temporary support level. And lo and behold, that was exactly right.
Okay. And you'll see I started to set my takerit down into this critical level. So price reattempts that lower level.
You'll see I'm up $3,200. This breaks underneath that level. You'll see comes perfectly down to my takerit.
In just risking $500, I was able to make over $4,200 in profit. Okay? And this happened roughly in about 10 minutes.
Some of the best trades I take are going to push into profit very quickly. So let's take a look at another trade example. So we see price pushing up into a potentially overvalued state.
You'll see we have highlights here also indicating that we could be nearing a potentially overvalued state. Once again putting us in that high probability area anyways. Okay.
Then we have lows being put in here, here with a decisive candle in a new low produced here. Okay. So once again placing your position comfortably outside take profit in a key area.
Okay. Start to get our initial push. We're reducing risk down to our break even level.
Almost came back up to stop us out. Okay. Continued to push down at this point.
Sort of walking my stop loss down onto this trend. So once again, even when you get a move back up, you've taken risk off of the table, and you can let these trends push down as far as they can go. So once again, you'll see in this trade example, I have my trend line drawn, indications of potential overvalued territory.
I got in a little bit lower on this trade just so that I didn't miss this massive trend break. Okay, but price starts to push, reattempts entry a few times, continues to make push. See, I brought my stop loss into profit.
I'm up 2400. We almost get a continuation push. And at $2,200, price comes up.
I think I lock in right around $2,000 on this trade. Once again, risking that sort of $500 and that trade only took one hour. All right, once again, sell signal here indicating potential overvalued.
Okay, we have our trend level right here. Take our entry. Really, really tight stop loss on this trade and price starts to push down nicely.
Doesn't quite reattempt. Continues to make a really, really nice push to the downside. So, once again, risking $500.
We're up over $5,000. This is one of the bigger trades that I've taken with this strategy. doesn't quite get to our takerofit and I end up taking the trade off the table right around $4,000 in profit.
Looking at another trade example, undervalued territory, buy signal with high impact directional candle. We have that trend level being broken right here. So, I take a position.
Price starts to move nicely in my direction. Okay, we get a really good push. I'm up about $1,800.
I walk my stop loss up to sort of lock in some gains and I end up locking in right around $1,000 on this trade. So, now that you understand the framework of the strategy, let's get into some of the confluences in order to pick the best setups and some of my favorite personal things that I look for in general, but also in conjunction with the strategy to make sure that I'm finding the best possible trade opportunities for myself. So, if we basically pull up any chart, you're going to see we have these areas where we are getting a lot of key levels of response.
We could take a trade off of this one. We could have taken a trade off of this one. Okay, if we're looking to play the market to the downside, you can see we had trade opportunity here, trade opportunity here.
So you can see there's an abundance of trade opportunities on the table. Okay. But in order to sort of refine these down even further, this is one thing that I look for with my analysis in general, but something that has tremendously helped my trading and has also helped the private side of our trading team tremendously be able to get into high probability areas, even more than just the framework of the strategy.
On the private side of our team, there's a lot more that we dive into. And there's certain things that I can't share on YouTube in order to just be fair. that takes it to the next level of being able to find these strategies and sort of entering the professional realm of trading.
Okay? But as you're seeing what I'm sharing with you here on YouTube also definitely still works. It's just how deep you want to get into it and how much you want to start refining down your process and how seriously you want to take trading.
But one thing that I can share with you that I use across the board with my trading is something called overside underside retests. This is probably one of the most fundamental key things that I use in my trading now. I'm going to show you exactly how we can use it to make sure that we're picking the right setups and we're not just getting into every single trade.
Okay, so let's take a look at a random chart of the session today. This is trading in real time. So, we're going to look at what's going on with the market.
In general, on this chart, we're noticing a bunch of trends. So, we have this trend. We have this trend.
We have this small trend. We have this trend. Okay?
And now we have a new downtrend. Okay? So, what I always do is try to find important levels on my chart by actually physically drawing out these trends.
And people say what they're going to say about trend lines, but I'm going to show you right here. It literally just works. Okay, some of the ICT people are going to use different terminology describing the same things.
Support and resistance and general analysis traders are going to poo poo on ICT concepts. The point is is that we're all getting the same information and we're all reading the same stuff. No matter what you're calling it, I don't care what anyone has to say.
I know this is working for me and I've been doing this for 8 years. Okay, so check this out. when I'm looking at this potentially undervalued relative area.
What I want to do is take high points of this trend and start running trend lines along the tops of them. And what you're going to see is that you'll have bounce points here that are going to come up. And this is often times going to give you once again those key areas where we could get price to start to bounce off of.
Okay. So now you'll notice in this example, the price was a little bit choppy going through this level. But ultimately once we did get our push and one of our fair value gaps was left behind.
Okay. price came back down to perfectly test the opposite side where price couldn't break through previously and then took a significant move upwards. All right, so if we go to the next trend as an example, this is our uptrend.
If I do the same thing where I'm clicking and moving along these lows, you're going to see price hit off of this level, hit off of this level, hit off of this level, this level finally took a big push down, and then price reversed back up perfectly to test the now underside of this area before having another significant rolloff. Okay, and this is a confluence that I like to use. So, you'll notice we had a few options.
We could have taken this one, but we also have this one. Anytime I'm seeing a break of a significant level, I'm almost certain that eventually we're going to have price come back up and reclaim that underside of that level to confirm that there's more supply than demand and that this move was decisive and that's going to cause a more significant move to the downside. So, if I can choose a critical level here to enter in on versus entering in on this one, I'm going to choose that level every single time.
place my stop loss comfortably outside that level and set my take-profit level at key areas on this trend. So, even just doing this one position by doing these things, that's five risk factors right there. $2,500 in profit, risking $500.
Or say you're risking $10 would give you $50 worth profit. All right, take this as another example. So, we have high level here, high level here, retest here, price continues to push up once we have a significant push down.
Now, we have reason to believe that if we have another setup over here at the same time that price is going to come down, make contact with this lower portion of this trend. All right, and if we're able to make this align with our entry criteria, this can put us in a higher conviction area to be able to take the right trade setups and get really, really significant pushes in our direction to put ourselves in these high probability setups. Now, as you'll see, having all of these things come together at once is significantly going to impact the amount of opportunities that you have.
Okay? But what I like to do is really refine down my process so that I'm waiting for relatively overvalued areas where I know there's been a definitive trend break where we have a new low being produced, stop-loss comfortably outside of that retest. So, we have all of our checklist requirements hit so that we have a perfect contact point off of the trend and a perfect move down into our direction for the trade to be able to make those juicy profits.
And I think really being selective has really helped me be able to keep those losses small and allow the account to grow. Okay? And this mindset is really what I'm trying to drill into your mind and largely what we focus on on the private side of our trading team.
Okay, we have members that are 5xing their accounts, really focused on disciplined trading and really see this framework that I've built and spent this amount of time putting together start to come to fruition and see the results. Okay, you can see a really, really snipe entry here from one of our private team members that's learned all of the more nuanced details of the strategy. $6.
2,000 in profit just off of one single trade. Okay, those are coming up to like my size numbers. Seems like each day we're having new and new funded traders on the private side of our trading team.
Funding certificate after funding certificate. So, it's really really nice to see that the details in the emphasis on structure are really starting to work nicely. Okay.
But what I really want to emphasize to you guys is, of course, I'm making this video. I'm showing you the proof of all of this and the others that are also using this. But what I encourage you when you're doing any sort of stuff on YouTube like this is to actually go in and prove it to yourself.
Okay? And don't just listen to people who are making YouTube videos, including me. Okay?
What you need to do with trading is really, really have an understanding this is going to work for yourself. So, I'm going to show you how you can go ahead and prove this strategy to yourself and how you can actually start practicing this today. And you can use this process to find out which strategy you want to use, whether it's ours or something else.
This is the best way to have proof of concept for yourself. So, this is what I'm referring to when I'm talking about measuring. Okay, what I've done is I've built a custom trade journal in Notion.
If you want access to this, you can go in the description, follow me on Instagram, DM me the word tools, and I'll have everything that I use for trading sent over to you via there. and you can start using this yourself. But basically down here is where we're going to input any sort of information that we want to know about our strategy.
We're going to be able to see our equity curve based on strategy. And we're also going to be able to make checklists for ourselves to follow when we're in trades. And we'll be able to see our result over time.
All right. And so here's what you can do inside your trading view. You can click on something called bar replay.
And then you can click on this button down here. And you can actually go back to any day that you want to go retrade. Okay?
So say I want to go back to the 29th. I can go to the 29th. Okay.
And you can literally pause and play the chart. So say I wanted to take a long position in here. I would set up my position.
If you also have our tool suite, you can click on your indicators and you can go into inevitrade position size calculator and click on that which will allow you to click on your entry, your takeprofit, and your stop- loss. Put in say $10 worth of risk to try it out. And then you can just play this forward.
You can manage your risk how you would. Okay. So say you take profit here.
It's going to show you, okay, $5,600 worth of profit. So you can literally click into here, input the day of the week, input whatever you're trading, and you can create custom ones. You can choose your strategy, put in your time frame.
You can customize all of this however you want. Then you can input your information. You can use this to create a checklist for yourself depending on the strategy that you're trading.
And you can just continue to create a log of this to see all of your performance trying out the specific strategy. Now you basically have a complete rulebook without putting any risk on the table to say if I deposit funds into an account and follow this procedure, I can start with small amounts of capital and you don't need to waste thousands of dollars, make ridiculous amounts of mistakes and you can really refine what works for yourself, practice it and prove it to yourself. If you want more guided framework and community, you can check out my private team in education right here.
If this video is helpful, make sure you hit the like button, subscribe if you want to know when I drop videos. If you're interested in trading, check out more videos right here. And until next time, I will see you all in the next video.
Related Videos

19:42
I Tested the Weirdest Phones on the Internet.
Mrwhosetheboss
4,905,569 views

26:37
LIVE TRADING CRYPTO - How To Profit $7,521...
Craig Percoco
341,919 views
![How to Grow Your SMALL Trading Account FAST in 2025 [Step by Step]](https://img.youtube.com/vi/HtZLrEBvQmc/mqdefault.jpg)
27:47
How to Grow Your SMALL Trading Account FAS...
Craig Percoco
167,153 views

2:55:54
Morning Vibes Playlist ☕ Feel Good Music t...
We Are Diamond
7,344,057 views

3:25:28
50 Classical Music Masterpieces for Relaxa...
Classical Stars
10,189,680 views

15:50
How To Trade TRENDLINES In UNDER 17 Minutes
Tori Trades
461,258 views

25:49
50 de români, o dilemă: încotro ne îndreptăm?
Recorder
418,810 views

1:04:44
Water Meditation (1111 Hz) | 1 hour handpa...
Malte Marten
87,948 views

2:05:19
ANUL ASTA VEDEM BITCOIN SUB $74.000 SI ETH...
Mercori!!!
17,746 views
11:45
The ONLY Candlestick Pattern Guide You'll ...
TradingLab
4,460,669 views

25:24
I Make 6 FIGURES A Trade Using ONLY This P...
Ezekiel Chew
207,408 views

3:22:50
Forest Cafe Jazz Music | Morning Tranquill...
Tranquill Jazz Melody
8,475,744 views

20:12
Watch: OpenAI CEO Sam Altman, other execut...
CBS News
140,362 views
18:20
How to START Day Trading For Beginners 202...
Craig Percoco
1,703,261 views

45:59
The 3 Scalping Setups That Make Me A Livin...
Etienne Crete - Desire To TRADE
763,744 views

29:17
If you are a PALANTIR shareholder….GET READY
Tom Nash
130,720 views

48:52
Gary Stevenson on taxing the rich and why ...
Channel 4 News
1,781,816 views

2:04:08
Sweet Jazz ☕ Elegant May Jazz & Happy Boss...
Bossa Nova BGM
2,143 views

23:06
⚠️ WATCH BEFORE MONDAY 9 30am! #PLTR #SOFI...
Invest With Corey
14,455 views

13:00
BREAKING NEWS: Stephen Miller Defends Hard...
Forbes Breaking News
373,858 views