5 TradingView Indicators I’d NEVER Share Publicly (But You Need Them)
42.29k views1933 WordsCopy TextShare
Magic Indicator Strategies
TradeIQ Master Kit - https://chartprime.com/mis
Best Crypto Exchange - https://www.pionex.com/en/si...
Video Transcript:
in this video I'm exposing five hidden indicators that professional Traders use to spot reversals predict breakouts and Dodge losing trades no lagging Lines no guesswork just razor sharp signals stick around because by the end of this video you'll walk away with profitable strategies worth thousands of dollars without further Ado open any chart on trading view head over to the indicators and type the name of the first tool percent Trend change indicator using John A's ultimate smoother filter this tool brings a new level of precision to detecting Trend changes giving you the edge to spot reversals
and ride momentum like a pro what makes this indicator truly special is how it visualizes percentage changes in real time you can actually see the strength and sustainability of a trend unfold before your eyes it Maps out each move showing you exactly how much the price has changed from the entry point allowing you to gauge the trend's health without second guessing I will teach you how to use this information in live market so that you profit almost every single time the beauty of the percent Trend change indicator lies in its Simplicity and flexibility it marks
Trend entry points with up and down triangles clearly showing where the trend started each triangle is labeled with the entry price making it effortless to track your positions as the trend progresses percentage change labels pop up at regular intervals giving you an ongoing update of how much the price has moved this isn't just about numbers on a screen it's about giving you a real sense of direction and momentum in an uptrend positive changes are marked in green in a downtrend negative moves appear in red and the occasional positive bounce is shown in Orange the indicator
doesn't just tell you where the Market's been it shows you where it's going the smooth Channel bands adapt dynamically making it easy to see Trend strength and potential reversal zones here's a strategy with this indicator that's proven to be highly profitable over time it can conss low quality signals leaving only the most powerful ones currently I am viewing the salana price on the 1H hour time frame the indicator settings are default the conditions for a long trade are as follows first the indicator marks a trend change from barish to bullish most Traders would open a
long position here which is a huge mistake you need to be smarter that's why following the second rule is crucial which is to wait for the price to start moving in the direction of the signal the percentage change of the first interval must be between 5 and 10% this is a sweet spot indicating that buyers have stepped in and the trend has room left to develop if the conditions are in place open a long trade and set the stop loss at the bottom of the channel Target at least 1.5 times the risk the opposite conditions
apply for short trades by the way you can only enter a trade at the first interval do not re-enter the market even if the percentage at the second or third interval is between 5 and 10% rather wait for the trend to reset and open the position only if all the rules are met if this indicator blew your mind even half as much as it did mine do me a solid smash that like button and if you haven't already subscribe to our Channel all right let's uncover the next tool you can't afford to miss in 2025
this indicator is called the trade i q Master kit imagine having an indicator where every tool clicks together perfectly painting a crystal clear picture of what the Market's really doing no more guesswork no more squinting at charts just clean actionable insights to help you make smart confident trades at its heart this indicator dishes out Dynamic Trend signals that shift with the Market's mood picture little arrows popping up on your chart nudging you when it's time to jump in or bail out and the coolest part you can tweak how sensitive these signals are it bends to
your style not the other way around but wait there's more ever wish you could see where the markets floor and ceiling are the trade IQ Master kit Maps out key support and resistance zones in bold colorcoded visuals think of them like traffic lights blue zones scream hey buyers are lurking here while red zones whisper sellers might crash the party soon and that's just the start this thing's packed with hidden gems let's roll up our sleeves and put it to work crack open the indicator settings and flip on the following power features trendy candle beacons they'll
light up key turning points tiq tracer on the 1hour chart this is your Trend Compass lastly turn on the volume profile to see where the big money is parked and the trend lines here's the Playbook the very first green flag is the price position above that glowing orange tiq Tracer Line This Means buyers are still in control next take a look at the volume profile if you spot a cluster of buy orders stacking up below price the trend's going strong when the indicator flashes a Buy Signal Dive In let the trend run its course until
the system hands you an exit sign want to play it safe skim profits along the way and nudge your stop loss to break even locking gains while cutting risk and when that TTP signal pops up cash out and celebrate rinse and repeat if you're itching to get your hands on the trade IQ Master kit I'll drop a link below so you can grab it yourself next up on my list is an indicator called high volume points big Beluga the moment you add this tool to your chart you'll notice something unique large dynamically sized concentric circles
marking pivot highs and lows but these aren't just random points they represent areas of exceptionally High trading volume the bigger the circle the more significant the market activity at that level each circle also displays the exact volume making it easy to see where the Heavy Hitters are entering the market but it doesn't stop there as the price moves the indicator draws horizontal support and resistance lines from these high volume pivots these lines become critical levels where price often reacts either bouncing off or breaking through one of the most powerful features is how it handles liquidity
grabs when price crosses one of these high volume levels and snatches liquidity the line automatically changes to a dashed format giving you a clear signal that institutional players might have just made their move this feature helps you stay ahead by identifying areas where the market might reverse or continue its Trend depending on who's in control not every volume spike is worth your attention and the indicator lets you filter volume points based on significance with a customizable threshold from 0 to six you can focus on only the most impactful liquidity zones removing noise and keeping your
chart clean here's a powerful strategy using the high volume points indicator when price approaches a high volume buying Point marked on the chart wait for a retracement back to that level if the price retests this high volume Zone and forms a bullish Candlestick pattern like a hammer or engulfing candle it's your Quee to buy the logic this level attracted heavy buying interest before and if it holds it means buyers are stepping in again to defend their territory place a buy order as the price retests and confirms the high volume level use the next high volume
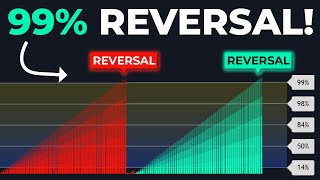
pivot above as your target locking in gains where sellers previously dominated simple yet highly effective the fourth indicator on my list can actually predict price reversals with 99% probability meet the trend reversal probability indicator by algo Alpha think of it as your Market six sents a tool that doesn't just guess when Trends might flip but calculates the odds with Precision no flashy gimmicks just smart analytics that help you spot reversals before the crowd catches on at its heart is a custombuilt oscillator that blends short and long moving averages of the midpoint price picture it as
a fitness tracker for the market monitoring its pulse stamina and when it's about to hit a wall instead of raw numbers it transforms this data into an intuitive gauge similar to RSI that shows Trend strength and potential turning points here's where it gets exciting the tool tracks how long Trends typically last and plots their expiration dates using statistical bands red and green bars grow taller as the trend ages with colors intensifying to Signal reversal likelihood deep red bars the market might be due for a bullish bounce vibrant green a downturn could be around the corner
it's like watching a progress bar the closer it gets to 100% the higher the chance of a U-turn now let me show you my secret strategy that wins almost every single time listen carefully and follow every single step otherwise it won't work first open the indicators and search for smart money Concepts probability and add this tool to the Chart keep the settings as default for a Buy trade there must be three conditions to be fulfilled first the trend reversal probability percentage needs to be higher than 90% second the price needs to be positioned between the
gray and the green zones finally the probability of the price reaching the Red Zone needs to be higher than 60% open a Buy trade as soon as all three conditions are present place the stop loss below the green zone and Target the red area repeat the process and enjoy your profits finally let's uncover the fifth indicator the reversal rehearsal V1 at its core this professional indicator excels at detecting zones where momentum is building up for potential reversals it uses RSI ranges to highlight moments of Market overextension such as shooting or fall ranges this ensures that
you are always aware of when the market is most likely to shift Direction giving you an edge in timing entries and exits the combination of RSI thresholds with candlestick patterns such as engulfing tweezers Hammers and piercing patterns adds a layer of confirmation to the analysis you can even customize the strength of these signals choosing whether you want to filter out weaker patterns or Focus solely on the strongest ones one of the standout features of this indicator is its Incorporation of fair value gaps these gaps represent price in efficiencies that the market is likely to revisit
before continuing its Trend the indicator empowers you to tailor its signals to your preferred trading style whether you're looking for long short or both types of setups the indicator adapts to your needs Additionally you can fine-tune the signal strength for Candlestick patterns ensuring your chart remains uncluttered while highlighting only the most relevant opportunities the indic Ator shines brightest in lower time frames such as 1 to 15 minute charts making it an excellent choice for scalpers and day Traders it continuously monitors market conditions and alerts you to Prime trading opportunities even during fast-paced sessions it even
provides back testing results so you can examine the strategy's profitability over time overall an excellent tool to test out give it a try and let us know your thoughts in the comments
Related Videos

9:28
This Oscillator Tells You Exactly Where To...
PineTrades
147,843 views

10:32
This Indicator PREDICTS Market Bottoms wit...
Data Trader
140,402 views

55:11
Master This ONE Candlestick Pattern TODAY ...
Ross Cameron - Warrior Trading
1,320,716 views
33:21
This NEW Indicator in Tradingview Will Cha...
Indrazith Shantharaj
39,061 views

16:40
Stop Losing Money with WRONG TradingView S...
Michael Automates
83,789 views

21:49
Convert TradingView Indicators into Strate...
Michael Automates
1,023,787 views
20:00
🔴 STRENGTH INDEX Trading (Say BYE-BYE to ...
Trader DNA
232,386 views

12:17
5 NEW Indicators That Predict the EXACT Fu...
Magic Indicator Strategies
197,301 views

8:39
20 EMA High & Low Trading Strategy – Live ...
GeekOnDaily
81,523 views

48:15
Reading Candlestick Charts Was HARD Until ...
Ross Cameron - Warrior Trading
1,290,525 views

10:04
Greatest Price Action Indicator on Trading...
LuxAlgo
41,122 views
12:42
1 Indicator, 3 Uses! Most Powerful Trading...
PineTrades
557,504 views
9:20
New Scalping Indicator With Accurate Buy A...
Bitmoni
30,498 views
55:18
How to Read Candlestick Charts (with ZERO ...
Ross Cameron - Warrior Trading
3,158,878 views

16:55
🔴 The MOTHER of All Indicators (Dangerous...
Trader DNA
323,206 views

7:30
The Most Accurate All-In-One Trading Toolk...
PineTrades
95,877 views
11:23
Simple Tradingview Stratgy - $7600 PROFIT
TradingBrain
32,322 views

5:34
The Secret TradingView Indicator You’ll Ev...
Trade Algorithm
35,889 views

19:26
My Scalping Strategy is Boring, But Makes ...
Scarface Trades
179,570 views
9:57
This Oscillator Shows Up To 99% Trend Reve...
PineTrades
106,048 views