What's up, ninja nerds? In this video today, we're going to be talking about the basics of EKGs. Let's go ahead and get started. All right, ninja nerds. So, when we talk about EKGs, we obviously have to start with the basics. understanding the physics, understanding the physiology before we actually start going through and reading 12 leadg cases and determining what's going on. So what I want to do is is I want us to take us a stroll really quick through some basic physics and physiology which will really prepare us when we start going through a systematic
approach of EKGs. In order for us to under to understand that and to start this process, what I want us to do is I want you to imagine imagine I have this ventricular mioardium here and I'm just going to take and cut like a chunk of tissue out and place those chunks of tissue here in this box layer. Okay. Then what I'm going to do is I'm going to get a little evil and I'm going to put some electrodes on each end of this tissue. Right? I'm going to put a positive electrode on that side,
a negative electrode on that side. Then what I'm going to do is I'm going to stimulate. I'm going to come at this end of this tissue and I'm going to stimulate. I'm going to provide some electrical stimulus. When this tissue becomes stimulated, it actually, you know, cells, they undergo depolarization, right? Positive ions like calcium and sodium ions will flood into these cells, cause them to flip, become positive, depolarize them, right? And you know there's little junctions, right? If I had like a little hole between this cell and this cell, there's little gap junctions. And so
those sodium ions and calcium ions can move through those gap junctions from cell to cell to cell to cell creating kind of this electrical signal that's being propagated from this end of the tissue to this end of the tissue. And what kind of charge is being propagated? Well, remember this cell was resting. So originally it's kind of slightly negative, right? Then it becomes positive, positive, positive, positive. So there's a flow of positive charges moving in which direction? If I go ahead and apply a stimulus at this end, there's going to be a flow of positive
charge moving towards this positive electrode. Now, why is that important? If I take the positive electrode and I hook it up to an EKG machine, it should cause a particular type of deflection. Right? When you look at EKGs, all they look like is you see upward deflections, downward deflections, you see flat lines. What does that mean? I'll tell you what it means. If a particular tissue is generating action potentials, depolarizing waves that are moving towards a positive electrode, it'll get read from that electrode, send it to the EKG machine, and produce a positive deflection that
shows up on the EKG. So, I want you to remember that a flow of positive charges moving towards the positive electrode of any kind of lead of the 12 lead system should produce a upward deflection. Okay, let's take the opposite scenario. Let's say I take and I put a negative electrode here on that same side, a positive electrode on this side. But now what I want to do is I want to stimulate this end of the tissue. Okay? So I'm going to go ahead and stimulate this end of the tissue. Stimulate it. It'll deolarize. Positive
charges will then flow from this cell to this cell to this cell to this cell via the gap junctions, right? And it'll move in which direction? towards the negative electrode or what we like to say is away from the positive electrode. Right? And again, what kind of charges is flowing here? Positive charges. Whenever this flow of positive charges is moving away, very very important, away from the positive electrode, it will then get picked up by the electrode, send it to the EKG machine and produce a downward deflection. So again, downward deflection. All right. So to
quickly recap, positive charges or flow of electrical activity moving towards positive electrode upward deflection. If there's a positive charge moving away from the positive electrode, downward deflection. Okay, let's uh let's switch it up a little bit. So we'll change it up a little bit because this is going to become very important when we go through this entire EKG waveform and explaining what all these deflections are indicating. What if I do one more thing? I put a negative electrode here on one side of the tissue. I put a positive electrode here on this side of the
tissue. Right? And now what I'm going to do is I'm going to actually have these cells. You know, whenever cells depolarize, right? For example, let's say that we took this one. It depolarized. After depolarizes, it then has to start to repolarize. So, let's pretend for a second that these cells will repolarize, right? And let's say that they're repolarizing just for the sake of this argument here. Let's say that they're repolarizing going in this direction, right? So for example, this cell will become negative. This cell will become negatively charged, negatively charged, negatively charged. So it's going
to be moving in this direction just for as an example. Right? So I have a flow of negative charges that is moving from the positive electrode towards the negative electrode. Right? When negative charges are flowing towards the negative electrode, guess what it does? The same thing that would happen if positive charges are moving towards the positive electrode produces an upward deflection. So in this case, negative charges to negative electrode will produce a upward deflection. So very important. You'll see why whenever we start going through this. The last thing I want you to remember is that
there's parts where there is no deflection. We via upward or downward. Sometimes it's just flat, right? an isoctric line. What could that be indicative of? Let's say here I take this tissue, negative electrode on this side, positive electrode on this side. But now the tissue is oriented kind of in a different direction. You know this is an axis, right? If you kind of imagined an imaginary line going from this electrode to this electrode, there's an axis of that lead. Okay? If I were to stimulate this end of the tissue, which way is it going to
go? Upwards, right? So if I stimulate this end of the tissue and I cause this to deolarize, this to deolarize, this to deolarize, and so on and so forth. What is the direction of positive charge is going to look like? It's going to start moving towards the axis of this lead. And then after it passes through the axis, it'll move away from the axis of that lead. You know what actually happens? But your EKG is so smart. Your EKG machines are so smart. Generally whenever this kind of charge uh this positive charge that we have
flowing here down this tissue perpendicular to the axis of the lead originally as it's going towards the axis it actually produces a positive deflection and then it moves away from the axis of that lead. But since it's the same amplitude on both sides of the axis of that lead the deflections will be equal to one another equasic. And then guess what happens? The EKG machine actually will cancel them out and make a kind of an isoctric line. So you can remember two things. Whenever there's like no net movement of electrical activity, there'll be kind of
a flat line or whenever the electrical activity of the heart is moving perpendicular to the axis of whatever lead we may be looking at. Okay, I think we have a pretty strong idea now about what causes a positive, negative deflection or a straight line. Now, what I want us to do is let's take one lead that's the most commonly used lead in the rhythm strips of 12 lead EKGs, lead two, and map out the entire EKG waveform. All right, engineers. So, now let's go ahead and take and I want you to trust me right now.
We'll go through all the 12 different leads and understand them a little bit more, but for right now, just trust me that the lead that we are looking at in this kind of example that we're going to follow throughout the entire EKG cycle is lead two. Lead two, usually the negative electrode is kind of on the right arm, our right side. And then the positive electrode will be on the left leg. Okay? And so it creates this axis. If you imagine an imaginary dotted line, the axis is going in this direction from negative to positive.
Okay? So remember for the most part where is the flow of positive charges going with respect to the positive electrode. Think about the positive electrode as an eye looking towards the negative electrode. It's looking for those positive charges. If it's coming to it, it's going to be a positive. If it's going away from it, it's going to be a negative. Okay. So let's start off. Let's start off with the first part of the EKG. Whenever a uh the the atrial cells you know all this entire EKG activity starts within the atria the atria they have
this structure called the SA node you know the SA node it's located within the upper kind of top right portion of the atria near the entry of the superior vennea. So that would be our SA node. Correct. That tissue has special types of pacemaker cells that have the ability to generate action potentials and spread those action potentials throughout the atria going towards a particular direction. And the ultimate direction that these electrical potentials want to go towards is this big fat structure here sitting at the top of the interventricular septum and that is called our AV
node. Okay. So let's say here that we have our SA node. it decides, "Hey baby, I'm going fire. I'm going to send some action potentials." So, it starts sending action potentials originating in the right atrium. Okay? So, it'll send action potentials kind of all throughout this direction, right? Kind of spreading from the right atrium all the way towards the left atrium. Here's what's interesting though. If you were to take the mean of all or the average of all of these vectors that are spread throughout the atria, the mean vector that is generated by the depolarization
of the atria from the essay node to the AV node, one big vector would really kind of look like it's going straight to the AV node. So really if I took the mean of all of these little vectors that was generated by the essay node spreading out to the atria the mean vector that's generated from the essay node to depolarize the atria is going downward and leftward towards the AV node. Now that's the positive voltage right there. Right? So here let's get rid of all these like little guys so that we can completely understand here
that this right here just this arrow here this is a flow of positive charge moving from the SA node to the AV node but remember it's the main vector of all atrial deolarization which direction is that positive charge flowing with respect to the positive electrode of lead 2. It's moving in the direction of the positive electrode of lead 2. What does that mean? Positive charges flowing towards the positive electrode. Upward deflection. Boom. We got oursel a Pwave, baby. So there is our Pwave. So we have our Pwave. And what does that indicate? This indicates atrial
depolarization. Now, more particularly, if we really, really want to be particular though, that Pwave, if it looks just the way it's supposed to, which I know it may sound a little odd, what is else could it look like? It can look very different sometimes, and we'll explain that through our later videos. But if the Pwave looks the way it's supposed to, in other words, it's a sinus Pwave. That means that that Pwave was generated by the SA node. So if you have an upright Pwave looking like the same morphology throughout that atrial depolarization, it actually
occurred because the SA node was the one that generated the electrical activity to depolarize the entire atria. Very very important. Okay, so we already started with the first part of our EKG. Let's move on to the next part. If you look here, we have our Pwave, right? So this is our Pwave. But then we have this portion of the EKG where there's this flat line. Okay. Well, I want you guys to remember what does the flat line indicate? The flat line indicates that there's either no net movement of electrical activity or that the electrical activity
is being directed perpendicular to the axis of that lead. That's what it means, right? So let's understand why there is this flat isoctric line here. Let's go back to where we were before. Here we have our essay node at the top of the atria. It generated a bunch of depolarization vectors. And where was that directed toward? Do you remember the end point that we want all of this electrical activity to kind of come to? We wanted to go to the AV node at the top of the interventricular septum. We said that there's a bunch of
different depolarization vectors, but the primary main depolarization the mean vector from all of those is directed downward and leftwards towards the AV node. So that's our atrial depolarization vector. We said that gave us a positive type of deflection, right? The Pwave. Now let's say that the electrical activity finally gets to the AV node. The AV node becomes deolarized. So it's starting to become positive, positive, positive. But guess what? The AV node is a very nice little waiter. It takes its time with the electrical activity. It slows down the conduction a little bit. Sometimes like about
a 0.1 second delay that the AV node just hogs all the electrical activity and says, "Hey, stay here with me baby and then I'll send you down to the ventricles." So what happens is the electrical activity hits the AV node. The AV node starts kind of taking all of this electrical activity. it becomes depolarized but it holds that electrical activity within it before it decides to send the action potentials down to the ventricles. So it is positive charge but that positive flow of charge is not actually moving in a particular direction to produce any upward
or downward deflection. So that's how we have this isoctric line. Now, very important to understand here that if we take from here, that point of where the Pwave ends to where this line kind of ends, because there's going to be another little jaggedy point that we'll talk about here with the EKG. This right here is a very specific type of name here. This is called our PR segment. Okay, that's the PR segment. The next part that we really need to differentiate here, if I were to draw like another, let's say I drew another one. Here's
my Pwave and my PR segment there. If I drew the distance from the beginning of the Pwave all the way until where that PR segment ends, that is referred to as the PR interval. So, make sure you understand that. Okay? So, it's very important to remember the difference between these two. But what do we know? We know why we have this isoctric line. It's because the depolarization that moved from the SA node, got to the AV node. AV node is a very slow conductor holds the electrical charges for a certain amount of time about a
0.1 second delay. Then it says, "Okay, I'll send the electrical activity down to the ventricles. Now we understand the Pwave and the PR segment. Now the next thing that we're going to do is move on to the next part. All right. So now we understand the Pwave, the PR segment and we kind of formed at this point our PR interval. Now we start going to this next part of the EKG. Do you guys remember what that part is? So if you guys remember, we have our Pwave. We already understand what that is indicating. Then we
have our PR segment. Together the Pwave and the PR segment make our PR interval. Then we go into this next part which is kind of a downward deflection. Let's kind of quickly very very quickly recap. Pwave is what again? SA node firing generating a mean vector towards what structure? The AV node right AV node holds on to that electrical activity because it's kind of a slow conductor has and receives all that positive charge but does not conduct it down the bundle uh bundle of hiss and bundle branch system yet. So that causes that PR segment.
Now here's where it gets cool. We have from the AV node the bundle of H, right? or the AV bundle which then splits into what's called the right bundle branch and then through your left bundle branch. Now your left bundle branch actually has two other small branches left anterior and left posterior faciciculars. Uh but we're not going to we'll talk about that a little bit later. Okay, when it comes to axis and deviation but for right now I want you to remember simply there's a right bundle branch and a left bundle branch. Okay, here's what's
really really interesting. Whenever that depolarization finally moves from the AV node down to the bundle of H and then through your bundle branches, do you know what's really interesting? Your left bundle, this is the left bundle branch. It is actually responsible for depolarizing the interventricular septum, not really the right bundle branch. It's primarily the left bundle branch that depolarizes your interventricular septum. So if you think about that, if it's causing these small little deolarization vectors that are moving towards the right and maybe even a little bit kind of upward superiorly, then what would the mean
vector of all of those little guys look like on this diagram? It would look like this, right? So like I said, you should have all of these vectors that are pointing towards the right because it's going to be the left bundle branch depolarizing the interventricular septum from the left towards the right and it even is oriented a little bit upwards because of the shift of the heart two/irds of the left of the midternal line. So this should be the net depolarization vector of the interventricular septum or septal depolarization. Okay. If that's the case, then what
direction is that flow of positive charge moving with respect to the positive electrode of lead 2? It's moving in the opposite direction. So if it's moving in the opposite direction or away from the positive electro lead 2, what does that do? Causes a negative deflection. So that's where we get our negative deflection. That negative deflection has a very specific type of name. So we know we have Pwave, right? That's our Pwave. Then here, what do we have? We have our Qwave. That's our Qwave. And what is the Qwave indicate? That's very, very important. It is
indicative of septal depolarization. So what is the Qwave indicative of? It's best represented in this diagram. But the Qwave is indicative of septal depolarization. Okay, one more thing that I really want to kind of get across here because sometimes when we when we go further throughout these EKG lectures, you guys will see that there's something called pathological Q waves. Q waves are are are normal. They're a physiological part of our EKGs. Okay? Whenever they become larger, so in other words, they become very wide, and we'll talk about what that what that actual distance is. or
whenever they become very deep, they go have a very long kind of depth that they really have a negative downward deflection and a couple other things and particularly like what kinds of locations you really don't want to see them in. Then they can be called pathological Q waves. So again, remember Q waves are a normal physiological part of the EKG. It's just the size of it really determines whether it is physiological or pathological. And sometimes what's very interesting is you may not even see the Q waves within a 12 lead EKG. All right. So we
have the basic understanding here. We know that the Pwave is indicative of atrial deolarization. Vector pointing down to the left. PR segment indicative of atrial depolarization but no net movement. Qwave indicative of septal deolarization moving upward and to the right away from the positive electrode. Let's go to the next part of the EKG. All right. So now let's go on to the next part here. So we have our Pwave, right? We know what that indicates. We have our PR segment. We know what that indicates, right? So here we'll put down here PR segment. We have
our Q wave. We know what that now indicates. But now we go from this negative deflection into an upward deflection. What the heck does that indicate? Don't worry guys, I got you. So again, essay node. This is going to be build like just buried into your brains. You guys will never forget this. The essay node sends an atrial kind of depolarization vector that's directed downward in what direction? Towards kind of the left. Okay, let me just draw your bundle branch system here. So again, which direction would that be moving? It'll be moving atrial depolarization downward
and to the left as you're going towards the AV node. So that's going to produce that positive deflection. Atria stay depolarized, don't have any net movement because they're slow conductors. PR segment goes down through the bundle branch system. But remember that the left bundle branch is what really depolarizes the septum and that creates this net vector that moves in which direction? Moves to the right and then upward which creates again that negative deflection. All right. Now let's go to the next part here. The electrical activity will then continue to move down the bundle branches. So
it'll eventually got to you know from here down the left bundle branch it'll start to spread outwards like this from the bundle branches through the perkeni system you kind of get this kind of direction here. So then we'll go through the right bundle branch and then through the right bkeni system and you guys get the point. We're generating these vectors as we're going down through the interventricular septum towards the apex and then up towards kind of the bases. Here's what I want you guys to think. They're like holy crap there's so many arrows. Where the
heck is the net vector? All right, remember which ventricle is supposed to be thicker? It has more myioardium, meaning that it's going to conduct more action potentials, meaning that it'll generate higher voltages, meaning it'll generate a larger positive deflection. Which side? The left ventricle, that left ventricle be thick, right? So, the left ventricle is going to generate more uh intense of a net vector, right? Right? So if we were to kind of say let's say a imaginary line here cut in half right ventricle on this side left ventricle on this side all of these net
vectors here will create I mean so all of these little vectors here will create one net vector all right from here to here what what will that look like it'll be pointing like this okay so that's going to be the vector from the left ventricle so this is again flow of positive charge then let's say over here you have the right ventricle the right ventricle is generating all these electrical activity that's moving in this direction, right? So, it's going to have a smaller, okay, it's not as thick. So, its electrical vector may be a little
bit tinier, okay? And it may kind of look like this because again, the left ventricle is way thicker than the right ventricle. And again, this is going to be a flow of positive charge. So, here's what our different vectors would look like if we only imagined it generated in the left ventricle or the right ventricle, but we want the mean QRS vector. In other words, we want the equivalent of what the vectors would be additive of the left ventricular vector and the right ventricular vector. So, it should be if I take this one and this
one, which one's bigger? Usually want to kind of go in the middle if they're equal, but they're not equal, right? That left side is way bigger. So, because of that, it's going to start the mean of these two will lean a little bit more towards the left. So, your net vector here between these two is going to look like this. So this is our net QRS vector and again it's a flow of positive charge and I erased it before but let's say here's our positive electrode of lead 2. If this is our mean QRS vector
which is the net sum of the left ventricular vector and the right ventricular vector, which direction is that flow of positive charge moving towards with respect to the positive electrode? It's moving towards it. Right? If it's moving towards the positive electrode, what does that cause? a nice positive deflection. What do we get? A positive deflection. What does this mean vector indicate? Well, we know it's going to cause a positive deflection. Why? Because there's a flow of positive charges from this mean vector moving towards the positive electrode of lead 2. And we know that based upon
our discussion, that causes a positive deflection. What is that positive deflection here called? That is called our Rwave. Okay? So, that's your Rwave. So, if you want to think about it, this would be the Rwave. This would be the vector particularly for the Rwave in the left ventricle and this would be the vector for the Rwave in the right ventricle. So this is the mean of them. So we could kind of say if we want to this is the mean Rwave vector. Okay. All right. So that discusses that part of the EKG. Now let's move
on to the next part. So we have our Pwave that we generated which was again what that was when the SA node was firing generating a atrial depolarization vector aimed towards what structure the AV node right and the AV node once it's actually depolarized it holds on to that electrical activity for a bit it doesn't let it move down through the ventricular bundle system and that is going to be the PR segment right collectively the Pwave and the PR segment is called But that is called your PR interval. Then what happens is these AV bundle
will then finally say okay time to send this stuff down to the bundle system. So it'll send it through the AV bundle, the right bundle branch and the left bundle branch. If you guys remember the left bundle branch will generate depolarization vectors that are aimed towards the the right and upwards moving away from the positive electrode and that causes this downward deflection here called the Qwave. So now we have our Q wave. Then what happens is the depolarization vectors will then move down into the left and down and to the right. They'll create a vector
moving towards the right, a vector moving towards the left. We want the mean of those two, but because the left ventricle is thicker, it's going to cause the mean Rwave vector to be pointed downwards and to the left more. So you should get a downward vector like this. And that's what caused our Rwave. Well, now we go to the next part. The next part here is we had the deolarization spreading from the inner part of the myioardium all the way to the out outer part of the myioardium. After it depolarizes the inner to outer part
of the myioardium, it's not only going down in this way. So it goes down and it goes from inwards to outwards. But it also moves superiorly towards the base of the heart. As it does that, look at the direction here. Let's use our purple marker here. This kind of depolarization, as we're saying here, it moves down like this. It also moves like this. And it starts moving towards the actual base of the heart. And the same thing for this side. It moves downwards like this, but it also move upwards like this. As it does that,
there's going to be this kind of like basal uh uh ventricular kind of depolarization. And if you look at it, which direction is it actually kind of pointing it's pointing upwards and then towards the left for both of them. So if I were to draw kind of a little depolarization vector on this side, it should go this way. And a little depolarization vector on this side should go this way. Okay? So these are going to be the depolarization of the ventricles towards the bases. And again, it's because they're moving down and upwards. So if it's
moving upwards and generally towards the left and it's a flow of positive charge, what direction is that moving with respect to the positive electrode of lead 2? It's moving away from it. What does that cause? A downward deflection. What do we get? A downward deflection. What in the world is that downward deflection called? This is called the S-wave. We'll actually put that in here. S-wave for this part. Okay. So, what is the S-wave indicating? It is still ventricular depolarization, but at this point, it's more towards the base part of the ventricles rather than the entire
kind of like thickness of the ventricular myioardium right and left ventricle thickness part from inner to outer. That was more the Rwave. Okay. And then the Q wave is more septal depolarization. All right, we've covered that. Let's pop right over into the next part here. All right, quick recap. We're not going to go through all of this intensely again. We're not going to draw the vectors. I think by now that you guys should know it all, but we'll draw here our kind of our bundle system here to just be consistent. Okay, here's our right bundle
branch. Here's our left bundle branch. Okay, so we know now we definitely we're professionals, I think, right? engineers at this point. We know the Pwave. We know what it means. We know the PR segment. We know what that means. We know the Q-wave. We know what that means. We know the Rwave. We know what that means. And we know the S-wave. And we know what that means. Okay, here we go. You get to this next part, which is very interesting, which is going to be kind of like this flat segment here. kind of there's kind
of a little upstroke here, but really it's this isoctric line that we really need to focus on. This is electric point here where it's staying kind of in a flat line just like the PR segment was. This is called the ST segment. Now ST segment is basically when the entire ventricular moardium is completely depolarized. Remember how in the AV node, the AV node was deolarized and it stayed deolarized, but it didn't actually kind of like cause a movement of charge down into the AV bundle. It kind of just stayed in that AV node. In the
same way, the entire ventricular myioardium has already been completely depolarized. It's super positive. It hasn't begun to repolarize yet. And there's no more movement of any kind of charge. It's just been depolarized and it's just about getting ready to repolarize, but it's stuck in this depolarization state, but there is no net movement of any of that electrical charge. If there's no net movement of electrical charge, what will that do to the EKG? Is there a positive? Is it negative? It's an isoctric line. So, that's where we get this part here, which is called our ST
segment. And this is a very very important segment when it comes to pathology. So we'll talk about this in future videos. Okay. All right. So we understand that. Let's go into the last part of the EKG analysis here. All right. So the last part of the EKG. Okay. So we we we know this by now engineers. We should be professionals at this whole waveform stuff. We know the Pwave. Okay. We know our PR segment. We know what all of this stuff indicates by now. We know our Q-wave. We know our Rwave. We know our S-wave.
Let's lengthen this ST segment here a little bit more though, so we can make sure it's a super profound ST segment there. And then we have one more wave that we have to talk about here. And again, what is this port here that we just finished discussing? This is our ST segment. Okay. All right. Here we go. So, the first thing that we need to do is understand how the heck we get this upward deflection, which is the T-wave. Okay. Let's make sense of everything that we've done so far. So far, without going through all
of those vectors, here's our AV node. We'll just draw SA node here. SA node. AV node. We got our bundle of H. We got our right bundle branch. We got our left bundle branch. Right? What did we leave off with? At the last point here, this entire ventricular myioardium, the entire thickness of the ventricular myioardium was depolarized. Now, here's where it gets good, baby. Whenever a tissue depolarizes, in order for it to relax, in order for it to be stimulated again, it has to repolarize. In other words, has to go back to its resting membrane
potential, which is what kind of voltage inside of the cell? Negative voltage. So, at one point it was all positive charge throughout this entire ventricular myioardium. But what happens is imagine the charges flipping from the outside of the myioardium to the inside of the mioardium. So it's positive here then it goes negative and then it was positive here negative. So imagine it like this. Let's say that we kind of use it as an example here. Positive positive positive positive. That entire ventricular myioardium was positive. Right? And during the ST segment I'm going to flip each
one but I'm going to move in this direction. I'm going to repolarize that one. repolarize that part of the mioardium. Repolarize that one and repolarize that one. The negative charge is flipping in which direction? It's going backwards in the direction that the mean Rwave vector was, right? Because if you think about it, it's going to be the same thing. It's going to be negative charge flowing this way from the right ventricles, negative charge flowing this way from the left ventricles. So, this is going to create a nice vector, a thick vector, right? That would be
pointing upwards and towards the right. And this would be kind of creating like a little baby negative charge vector that's going to be pointing upwards and towards the left. But again, we want kind of the net vector between those two. So, what's the net vector? Well, again, this one's the bigger net ve. This one has the bigger vector, the bigger amplitude. So we want between, we want in the middle. We want the net of those two, but it's going to be leaning more towards this side. So what happens is in this case, this vector will
kind of look like this. This is going to be the net vector between these two. And what kind of charge does it actually have? What what flow of charge is moving in this direction from the outer part of the myioardium to the inner part of the mocardium? Negative charge. Now here's where we got to go back to remember what we talked about. If positive floats towards positive, it's an upward deflection. If positive moves away from positive, it's a downward deflection. What do we say happens when negative charge moves towards negative charge or negative electrode? It's
going to produce an upward deflection. negative charge oriented upwards towards that negative electrode. That is where we get our upward deflection. And that upward deflection is indicative of this is our T wave. And what does the T-wave indicate? It indicates the ventricles repolarizing. So what does it indicate? It is indicative of ventricular repolarization. Beautiful. So at the end of this to really quickly recap this, what does the Pwave indicate? Atrial deolarization. What does the QRS indicate? Ventricular depolarization. What does the Pwave indicate? Ventricular repolarization. Now that we've understood where these waveforms come, how they're actually
why it's up, why it's down, why it's isoctric, let's do the same thing with all the other 12 leads that are a part of our EKG. All right, engineers. So, at this point in time, we've covered what the EKG kind of waves and segments and all the different components of that should look like in one lead, right? Lead two, I told you. Usually lead 2 is the common most common lead used in a rhythm strip of a 12 lead EKG, but we only looked at one out of a total of 12 total leads that you
can have in an EKG. Um, and so that's important to remember that what are these different 12 leads? We'll talk about them individually, but there's what's called three limb leads. Lead one, two, three. Not too bad. Then there's three augmented uniolar limb leads, and that's AVR, AVL, and AVF. And then there's six precordial or chest leads. V1 to V6. So if you add all of that up, that's 3 + 3 6 6 + 6 12. 12 total leads. So we should, we don't have to, but we should see what all of these waves would look
like if we utilize the vector format that we talked about above and each of those 12 leads. Now, these are tiny little arrows and there's a lot of them, so it's going to be kind of like confusing. So, we're going to go through it each one by one, but we're going to kind of I'll use my hands to kind of gesture in what direction it's moving in as well. Before we start going through this, you should know what the heck lead am I looking at where the negative electrode is on this side, the positive electrode
is here. Same thing with these. So, let's quickly take there was this guy who made up this lead system, Antoven. He came up with what's called Antoven's triangle, right? So into triangle is this simple kind of method where the heart is kind of situated here in the center and we create these axis of particular leads with lead one two and three. So what happens is we take an electrode and we put that on the right arm. We put one on the left arm. We put one on the left leg and then we put a neutral
one usually on the right. So let's say here I recommend this is right arm, left arm, left leg. There's three total leads. This is going to be lead one. This is going to be lead two. And this is going to be lead three. And you can kind of already see that if I were to take kind of a look with the respect to the heart. This one's kind of going horizontal here. That's going to be lead one. This one's kind of going diagonal in this way. That's lead two. And this one's kind of going diagonal
in this way. That's lead three. But let's make sense of where the negative and the positive is. For the axis of lead one, there's a negative electrode that's placed on the right arm and a positive electrode that we have on the left arm. Then that creates an axis and that's that axis that we see right here. Okay, that's the axis of lead one that we kind of situated on the heart there. Lead two, the axis of lead two, you have a negative electrode on the right arm and a positive electrode on the left leg. And
that creates this axis that's coming down diagonally. And again, if you imagine I took this kind of dotted line and put it over the heart, you can see there negative electrode here at the top, positive electrode here at the bottom towards the left. Same thing, lead three, put the negative electrode here on the left arm, positive electrode here on the left leg. What does that create? It kind of creates this axis here that's going down this way. If I were to take this, put that over the heart, negative electrode should be over here. Positive electro
should be down here. So, that's where I'm getting all of these electrodes. cuz I don't want you to just think I just made them up and put them there willy-nilly. Right? So, this is lead one. This is lead two. This is lead three. The beauty of all of this is that we already know what lead 2 should look like. Right? We should already know. So if I were to draw out that utilizing all those vectors that we talked about, we should already know that there should be an upward up right Pwave a PR segment QR
ST segment and then our T-wave right here. For right now, I want you to trust me, but guess what? Lead one, lead two, lead three, all of them are pointing in the same direction. So for right now, I want you to trust me, but we'll go through it. There may be slight variations because of the the axis of those leads with the with respect to the vectors, but for the most part, you're going to get the same kind of waveform here that you would get in lead two that you would get in lead one and
lead three. So, let's go ahead and look at this. Here's my positive electrode. Let's start with the Pwave. Which way is it going? I have this arrow up here, but which way is it going? Downwards and to the left. Is it going towards the positive electrode? Yeah, upward deflection. Then I go septal deolarization, right? That's my Q-wave. It's going upwards and kind of towards the right. Is it which way is it going with respect to the positive electrode? It's going away from it. So that's going to be a downward deflection. Then I go to my
se uh to my actual entire kind of like mean Rwave vector. It's going down and to the left. It might not look like it's going straight towards the positive electrode, but in general, the direction of where it's going is moving towards the positive electrode. So that's going to produce a positive deflection. Then you have the depolarization at the bases of the ventricles. That's moving upwards and towards the right. That's moving away from the positive electrode. That's going to be the S-wave. And then again, your T-wave is this negative depolarization that's moving in which direction? It's
going this way. What is it moving towards? The negative electrode. So, it should be a positive deflection. The same exact thing happens with lead three. So, if you look at it, the positive charge is down there. So, if you were to do this, we don't have to do this because it's going to make the exact same sense. If you were to follow all of these vectors, you would get the same kind of situation there for lead three. Okay? So, what I want you to remember is lead one, two, and three, their waveforms should be pretty
much the same on a 12 lead. Here's the next thing I really, really need you guys to know. Imagine the positive charge as an eyeball. Okay? Imagine it as an eye and you are looking at the heart from that view. Wherever that positive charge, imagine that is where you're looking at the heart. If that's the case, then lead one is looking at what part of the heart directly. What's the first thing that that eyeball sees? This portion here. It sees that left ventricle, but particularly like the lateral wall more towards the top. So, we call
that a high lateral wall of the left ventricle. So, if I were to highlight over here, let's highlight it in a very nice color here. Let's use this beautiful like turquoise color here. This portion right here would be what? one lead one sees. So lead one would give us an idea of what kind of electrical activity is taking place in which part of the heart. The high lateral wall of the left ventricle. Okay, that's very very important especially when we get to STEMI. Okay, the next one, lead two and lead three. You know what? We're
so lucky cuz if you look here, lead two and lead three are both looking at the heart from the bottom. So the first part that they see is this part here and this part there. That's the inferior portion of the actual what? That's the inferior portion of the ventricles. So it looks at the inferior portion of the heart. So this would be what portion would be looking at this? This would be leads two and lead three would be looking at the inferior wall of the heart. Okay? And that includes the right ventricle and even a
little bit of the left ventricle. All right? So that's important to remember that. So now we have a pretty good idea of what lead one, lead two, lead three, EKG waveform should look like and what part of the heart they tell us where the electrical activity is kind of altered in some way. All right, now let's talk about the augmented uniolar limb leads. Do the same kind of thing with these vectors and then talk about what views or what portions of the heart they tell us about. All right, so we finished our limb leads. Now
let's talk about the augmented uniolar limb leads. Now the thing is is that these can be kind of annoying and complicated if you really get into the physics of them. We're not going to do that. We don't need to. It's not necessary because you know what? Your EKG machines are so smart that they have the ability to kind of switch the electrodes kind of simultaneously. And so it's really kind of cool what they can do. we'll go into a brief discussion of what I'm talking about. So remember I told you that there is three types
of augmented uniolar limb leads. So what are those? The first one that we'll talk about is AVR. So this is going to be AVR. Augmented uniolar limb leads. That's going to be for the right side and AVL and AVF. Okay. So what happens is you're still kind of using that same lead system, the same triangle. There was another guy named Wilson who came up with this idea, but it's the same kind of concept from the limb leads. Okay. The only thing that's different is is that what happens is that the EKG machine will switch the
negative electrodes on two corners like on the like for in this case there'll be a negative electrode on that left arm and a negative electrode on the left leg and it'll put a positive electrode on that right arm. And what happens is that means that if you were to kind of again follow the axis, where does that mean the axis of AVR is whenever you have two negative charges, the actual kind of mean point is actually situated here in the center. So actually when you look at this, the vector is actually going to be kind
of pointing this way towards that right side. So that's where that kind of AVR comes from. So if you were to imagine here for a second, imagine that's where that vector starts. This is where I would imagine I had this negative electrode situated. This is the axis of that AVR. Okay. So I want you to again imagine here this is the eyeball. You're looking at the heart from this direction. Let's follow all the waveforms. Pwave, where is it going? I know it's right there, but there's a lot of these waves very close. But again, this
top one right there, that's your Pwave. It's going downwards and to the left with respect to the positive electrode of AVR. Where is it moving? Away from the positive electrode. What does that mean? That is a downward deflection. So that means you're going to get something like this. Oh, shoot. Then we go here. We got this next part. What is this? That's septal depolarization. That moves towards the right and upwards. That means it's going to the positive charge. That's going to be a upward deflection. Maybe a little guy like that. Then the ventricles, right? You
have your mean Rwave vector that's pointing downwards to the left. That's moving away from the positive electrode. That's a downward deflection. And then you have this depolarization that's occurring at the bases of the ventricles. That's moving towards the positive electrode. That's a upward deflection. Okay. And then from there you go into your ST segment, right? Which is where the entire ventricles are depolarized. They aren't having a net movement. And then what happens? Ventricular repolarization. I know you can't really see it, but this was the positive charge. That was for the Rwave. What do you think
that negative charge is? That's for the T-wave, right? So then after the ventricles depolarized, what happened? You guys remember what happened from above? Then what happens is you start to have this ventricular repolarization which is a negative charge a negative charge moving towards the positive electrode. Okay. In other words, if you were to imagine remember we imagine that this is our neg our imaginary negative electrode between these two points here. This is moving in which direction? With respect to that negative electrode? Away from it. And so because it's moving away from it, that is going
to produce a negative deflection. And this is what you would get here for your actual EKG waveform with respect to this uh AVR. All right. So now if you think about this, we now kind of see what our waveform would look like or EKG and AVR. Do you know what's really interesting about this? It's literally the exact opposite of lead two and technically lead one and lead three, but lead two is kind of like our poster child of what the EKG would really look like. So, if you imagine, remember what lead two did? It had
an upward Pwave. Remember what the uh the Qwave was? It was a downward deflection. Remember what the Rwave was? Upward deflection. Remember what the S-wave was? A downward deflection. Do you remember what the T-wave was? An upward deflection. This is the exact opposite. That is going to become so so important later when we start talking about how to determine rate and rhythm if something is in sinus rhythm or not. If there's ectopic fos fosi that are developed we'll go into all of that later. So it's very important out of all of this stuff that we're
just talking about leads remember that AVR and lead 2 should be opposite of one another in their for their waveforms. Now we can go through this all again. And I think it's going to be kind of repetitive, but if you follow the same thing, AVL again, the EKG machine is smart. Creates negative electrodes on the right arm and left leg. And then what happens is the imaginary negative charge then would form between those two going towards the positive electrode that way. So you would have an axis like this, right? So that means that the AVL
the I that positive charge will be looking at the heart like this. Okay? And if you followed every single waveform from that point on, utilizing everything we talked about, guess what? It's the exact same as lead one, lead two, lead three. Hey, let's take it another step. Guess what? The next one below this, it's the exact same. The only one that really should be opposite is AVR. Every single other one of them, lead 1, 2, 3, AVL, AVF, should all pretty much look the exact same. The only one that should really look different is AVR.
There may be variations from EKG to EKG, but for the most part in a perfect world, lead one, two, three, AVL, AVF should look the same. Okay, so we should have an upright Pwave, QRS, T, upright Pwave, QRS, T. If you wanted to go through these, definitely stop the video and follow each of these depolarization vectors and try to map all of them out. And again, you'll get pretty much this. Again, there may be a small variance from either one uh from all of these, but for the most part, same for AVL, AVF as one,
two, and three. AVR should be the one that's completely different. All right, we now understand that before we go into the heart, showing the portions of the heart, we should actually finish explaining this AVF, though. So, again, same thing as we talked about before with AVR and AVL. The machine's very smart, right? So what it does is it turns a negative electrode on the right arm, negative electrode on the left arm and creates a positive electrode here on the left leg. And again if you imagine kind of the no electrode would form where? Somewhere in
the center between those two directed towards that positive electrode in this direction here. And so it would be like this positive electrode is the eye looking at the heart from below. That already kind of tells you what we need to know. The next part, what portion of the heart do these leads tell us about? Are they really good at? So, take a look here. If you imagine AVR, it's kind of like a positive charge kind of situated like right here. And it's looking at the heart kind of down this way. It really is good at
telling us about two parts of the heart. The one part is it tells us about the very beginning part of the interventricular septum and it tells us about parts of the right ventricle as well. So again what does AVR tell us about? It tells us about the activity of the right ventricle and what's called the basil septum. Okie dokie. So that would be for let's write that up here. This is for AVR. The next one here is for AVL. AVL, where's the eye kind of situated? The eye is situated right over here, right? So, the
positive charge would be here, kind of looking down at the heart this way. So, that's going to tell us about what part here. Well, if you can kind of follow this down here, it's going to tell us kind of about the same thing that one did. Do you remember what one told us about that high lateral wall of the left ventricle? It's the same thing for AVL. So, AVL will tell us about what? AVL will tell us about the high lateral wall of the left ventricle. Okay. And last but not least is AVF. AVF is
going to be again, imagine the eyeball is on the bottom. So, you're going to have the positive charge and it's looking upwards at the heart. What part does that hit? If you can kind of draw an imaginary line, you're going to get kind of this portion here. What's this portion? We already kind of seen this before. It's going to kind of hit like from here to here. Do you remember what that looked like before with the limb leads? Leads two and three. So leads two and three and AVF tell us about the inferior wall, okay,
of the heart. So this is going to be about inferior wall of heart. So if we were to combine some of these to kind of tell us about what we know already, we can add on to help us to remember all of this in one thing, not in separate pieces, right? So we know that AVF sees the inferior wall of the heart. But what else sees the inferior wall of the heart or kind of gives us an idea of what's going on with the inferior wall of the heart? You can add on to three and
AVF that it's going to tell us about the infra wall of the heart. We already know that though. And then again, what tells us about that high lateral wall of the left ventricle? AVL. But remember what else told us about it? One. So one and AVL tell us about the high lateral wall of the left ventricle. 23 AVF tells about the inferior wall of the heart. And AVR is just kind of like a lone rider that tells us about the right ventricle in the basil septum. All right, let's go to the next part. Now that
we got limb leads down, we got augmented unipolar limb leads down. We know now that all of the limb leads are having upright kind of direction. We know that all the augmented except for AVR have all of an upright direction and we now appreciate the portions of the heart that those leads tell us about. Now let's do the same thing for the precordial leads. All right, engineers. So now at this point in time, we've covered our limb leads. We've covered our augmented unipolar limb leads and we've talked about a lot of these deflections and what
their EKG should look like, what portions of the heart these leads tell us about. We're going to do the same thing for the precordial leads. Now the precordial leads are probably one of the more important leads um out of all of the 12 limb leads because they can tell us a lot about pathology. Okay, these are interesting ones. So these are uniolar limb leads. So they only have one kind of positive electrode that we put on the chest at different portions. So these are uniolar leads and we put them on the chest at different regions.
So let's actually kind of annotate where those ones would go. All right. First thing here, you put one of these V1 we call it the first one which again is a positive electrode. All of them will have a positive electrode that we place on the chest wall. V1 we actually go to the sternal angle. Okay, that's usually around the second intercostal space. And you feel down you go to about the right fourth intercostal space and that's where you'll put V1. Okay, then you go to the next one. So go back over to the left side
and you go to the left fourth intercostal space paristernal line. That's going to be V2. You skip V3 for a second because you come back to him a little bit later. Then you go to V4. V4 you go down to the fifth intercostal space on the left and you go to about midclavicular line. You place V4 there. V5 you stay in the left fifth intercostal space but you move to the anterior axillary line which is about right here. Okay. So that's going to be V5. And the last one is you again stay in that left
fifth intercostal space but keep moving moving moving until you get into the middle of the armpit and that's called mid axillary line. So that's V6. Now we got to come back though and place V3. Where do we place V3? We just make sure it fits between somewhere between V2 which is that left fourth intercostal space paristernal angle or parernal region between V4 which was left uh fifth intercostal space mid-clavicular line. So as long as you just place it between them doesn't really matter. So that's V3. Okay. So these are precordial or chest leads. We know
kind of now where they go right fourth left fourth both paristernal. This one goes between V2 to V4. V4 is left fifth mid-clavicular. V5 left fifth anterior axillary line. V6 left fifth mid axillary line. We know that these are uniolar. They only have a positive electrode that we place on the chest. So they only can pick up kind of the vectors that are moving either towards them or away from them and what plane. That's what's really important. This is what's really cool about them. So they tell us about the electrical activity in what's called a
horizontal or kind of a transverse plane which is very very cool. So what we did here is we took a cross-section okay of the thorax to where you're going to see the heart. You can't obviously this is where your lungs would be here on the sides but we're taking a kind of a cross-section or transverse section of the thorax and looking at it. Now these leads we kind of try to have them all converge on a point here at like that AV node basil septal portion but each one of these tells us about a particular
portion of the heart. Before we start getting into that though we should have an understanding very very importantly about the what's called the progression of the Rwave and the S-wave as we go from V1 all the way to V6. I'm not too concerned about the P and T's. I'm very it's very important we understand the Rwave progression as well as the S-wave as we go from V1 to V6. When you talk about the EKG, right? So, if we were to kind of just draw out the EKG waveform, we kind of know all the parts by
now. Uh definitely it's it's it's we we're good at it now. Pwave, QRS, T-wave. There's two waves that I primarily want us to focus on throughout the process here. That's the Rwave and the S-wave. That's the ones I want us to really really discuss about. The reason why is that Q waves, sometimes you see them, sometimes you don't, and really you shouldn't really see them um at least big ones in V1 to V3. So again, we're going to focus primarily on the Rwave and the S-wave and the ratio as you go from V1 to V6.
Very very important. We have to understand this as a basic concept of EKGs. So remember the first positive deflection in the QRS is the Rwave. The second deflection if it comes after whatever any positive deflection that is going to be the S-wave. So let's say that we take here and we kind of look at the ventricles. I like to look at them a little bit separately with respect to the Rwave. If you think about it, remember whenever the ventricles are depolarizing, right? We're at this phase. You create a small right ventricular vector for the Rwave
and you create a large ventricular vector, a bigger one for the left ventricle, right? And you know that you would create a mean one that would be a little bit more directed between the two of them, but it would definitely be leaning more towards that larger left ventricular Rway vector. For right now, before we even look at the mean one, I like to look at just the individual ones. I think it helps me to make sense of this. So, let's look at that. V1, if you kind of follow the lines here, you obviously can tell
that V1 tells us about the right ventricle. V2 tells us about the right ventricle. V3, it does a little bit of the right ventricle as well, but V1, V2, V3, they should tell us a little bit about that right ventricle, but primarily V1 and V2. So if that's the case, then if I have a Rwave vector that's coming from that right ventricle, and it's little because it's not going to be as big as the left ventricular one because of the thickness, what kind of Rwave would I get for V1, V2, and maybe even V3? Would
I get a big Rwave or would I get like a smaller Rwave? I get a smaller Rwave, right? Because that's a smaller Rwave vector. So if that's the case then my first upward deflection has to be little right like this and then like this and then like maybe a little bit maybe a little bit bigger as you go to V3 because look where V3 is starting to kind of look at it's starting to get more towards that left ventricle. So if you kind of look at it V1 V2 maybe the same size but V3 that
that Rwave should be getting a little bit bigger at that point in time. Okay, let's keep following that over here to V4. V4 is actually what's called our transition point because now we have that leftward kind of vector here, that left ventricular airway vector that's pointing towards the left side here. And V4 is getting a good shot of it. V5 is getting a really good shot and so is V6. So what do you think? Should the Rwave be big for four, five, and six or should it be small? That's a big Rwave vector coming from
the left ventricle. So, it should be a big Rwave, right? So, guess what we do? We get a nice Rwave, even bigger here in V5, and then a decent size one here in V6. Right. Actually, don't need that yet. We're going to get to the S-wave in a second. But you get the point here. Look at what's happening with the Rwaves as we go from V1 to V6. For the most part, they should be getting smaller, a little bit bigger, a little bit bigger, bigger, bigger. Dang. That's kind of the whole process of the Rwave
as you start to transition throughout these. Let's do the same thing, but with the S-wave. So, the S-wave is usually indicating what? So, you're going to have this kind of depolarization of the bases and then this kind of depolarization of the bases as well. Same thing if you're kind of looking at these, it's the same kind of concept here, right? That these are moving away from the positive electrodes. Okay? So, this is what happens is it's moving away from the positive electrodes. So, this will produce a downward deflection. Okay? Because again, if you're looking at
this one here, it's going to be moving again away from the positive electrode. That should produce a downward deflection. If you look in V2, same thing. It should produce a downward deflection in V3. It should produce a downward deflection. But guess what? That downward deflection starts to decrease as you move from V3 all the way till V6. So now watch what happens. Now this should kind of become like a little bit smaller like a little bit there. And then here this one will kind almost become like iso electric. This one will be really tiny. and
this will become be almost non-existent. So do you see what's happening now with the R to S ratio here is that as you progress the Rwave should be getting bigger as you go from V1 to V6 and the S-wave should be getting smaller as you go from V1 to V6. That's very very important especially when we start talking about axis deviation and other types of pathologies like ventricular hypertrophy so on and so forth. Okay. So again what do I want you to get out of this Rwave progression as you go from V1 to V6. What
happens to the Rwave? It should get bigger. As you follow the S-wave from V1 to V6, what should happen? It should get smaller. Okay, that's very important to remember. All right, so I think we now have a pretty good idea of what the RS ratio should look like through V1 to V6 and what these kind of precordial leads are telling us about. All right, so now at this point in time, we should have a pretty strong idea about where do we place the precordial chest leads, right? We should understand what kind of a way they're
looking at the heart from a horizontal or transverse plane. We should very very importantly understand the progression of the Rwave as we go from V1 to V6 uh is increasing and that the S-wave as we go from V1 to V6 is decreasing. So the R toss ratios usually less than one for V1 to V3 greater than one for V5 to V6. And the next thing that we need to understand here is what portions of the heart do V1 all the way to V6 tell us about because that's very important again when it comes to STEMI.
So to make it easy there's the different parts that we're going to color in here for us. Right? So this first one here right ventricle right ventricle is definitely going to be told to us by V1 V2 and even a little bit of V3. So I want you to remember here V1 to V3 will tell us about the activity of what? It'll tell us about the activity of the right ventricle. Now do you guys remember what other um lead that we talked about like the uh limb leads or augmented uniolar limb leads tell us about
the right ventricle. Which one? AVR. So AVR you can also add into this if you want to also gives us an idea about that right ventricle. Pretty cool, right? So if you wanted to add in from what we remember, you can also add in there AVR like we did before. All right. So we know that V1 to V3 and we can add on that little AVR there as well to help us remember stuff recognition there. That that kind of tells us a little bit about the right ventricle. Now the basil septum though the top part
of the intervententricular septum if you will that is going to be pretty much picked up by the act by the electrodes V2 and V3. So V2 to V3 tell us about that basil septum. But what else told us about the basil septum? Remember AVR told us about the right ventricle and the basil septum. So if we want to we can also add in AVR. Okay, let's come over to the next part. So now we have the anterior portion of the heart. So the anterior wall of the heart. So the anterior wall of the heart is
a very good big chunk of the heart and that's going to be from V2 all the way to V4. So V2 to V4 tell us about the anterior wall of the heart. Very very important one. Okay. The last one here which is going to be telling us about the kind of the lateral wall of the left ventricle. So again which part of the left ventricle here? the lateral wall of the LV which is your left ventricle that's going to be what? V5 and V6 which will be giving us a good representation of that part of
the heart. So V5 to V6. Now if you wanted to add on here and think a little bit about this remember the lateral wall of the left ventricle is V5 to V6. But do you remember what kind of the higher part of the left lateral wall of the the lateral wall of the left ventricle was covered by one in AVL. So sometimes if some people develop STEMI in V5 V6 they may also they have elevations in V5 and V6 they may also have some elevations in one in AVL if it hits those higher parts. So
sometimes you can also combine one AVL V5 and V6 together because they really give you a good idea about that entire lateral wall of the left ventricle. Okay. All right. I think we have a pretty good idea now about these precordial leads and I think we have a pretty good idea about all of these different waveforms and vectors and physics which I know is mind-numbing sometimes. What I want us to do is now start taking everything all this basics kind of uh topics that we've gone over and start applying that to EKGs. Now, what I
really want to do is give you the very basics about what an EKG kind of strip or paper looks like. What are some of the bare minimum things that you really need to know whenever we start reading them? and then also talk about a quick little recap of the uh different deflections and maybe what the actual parameters or distance of those intervals or waves, what how wide they should be, how long they should be, so on and so forth. So let's now come over here finish off our lecture with that. All right, so we've really
built up our foundation. Now we have a very strong foundation that we've built. Let's go ahead and really quickly before we really start getting into looking at lectures and reading real EKGs have a basic idea of some of the components of the EKG strip itself. So if I were to take here I want you guys to know first thing you see this big large red box. This big large kind of red box right here. There's a couple things I want you to know about it. So large box. First thing I want you to know is
I want you to know a couple things about its width. less significant with respect to these. I want you to know the height. So the width and the height thankfully are the same. It's 5 mm in width, 5 mm in height. You're probably like, "Okay, what the heck is that supposed to mean?" I'll tell you. Don't worry. Width is a little bit more of the important one. Okay, so I like to turn width particularly and because this is measured over time. So width is really helpful when it comes to time. Height is determining kind of
the amplitude or the voltage that the wave is actually kind of generating. So the more dependent upon the voltage or the amplitude. So when it comes to width, I look at that with respect to time. So I want I need to have some kind of conversion factor if you will between 5 mm and some type of seconds or milliseconds. I like seconds. So what actually happens here is 5 millimeters is actually equal to 0.20 seconds. So one large box means that.20 seconds has gone by with some electrical activity that's occur occurred right there on the
EKG strip. Heightwise that's 5 mm. Right? So 5 mm tells us a little bit about the voltage like I told you. So voltage for this is generally going to be about 0.5 m volts. So 0.5 m volts is how much 5 mm is equal to. So one large box in height tells us that there is a voltage of about.5 molts. Is that important? Not necessarily. We'll see later that sometimes you can have low QRS voltages in certain conditions. But the real important one that I really want you to remember, I think it's very important to
remember is the width. Because that's going to become very significant when we start talking about is the PR interval too long, is it too short, is the QT interval too long, is the um is another thing is the QRS waves uh wide, are they narrow, so on and so forth. The next thing is if you look in these large boxes, there is so many small boxes and you know how many there is. So within one large box, there's actually equivalent to 25 small boxes. Okay? So there's kind of like five rows, five in each one.
So it's kind of like if you want to think about it's five millimeters squared uh for these actual the small boxes. Okay? So when we talk about the small boxes, what I really want you to know is the same thing. I want you to know width important and I want you to know height. So for the small boxes, the width is actually very interesting here. You think about it. 1 2 3 4 five. Five little boxes make up one large box. It's five millimeters in in width. What do you think the the width of a
small box will be? 1 millimeter. So it's 1 millimeter. Then if you take five and divide it from so you take 0.20 20 and you divide it by five, that'll give you your time that it takes for that one small box. And that's equal to about 0.04 seconds. Also very important. Okay. Now, height, same thing. It's equal to 1 millimeter, which is equal to 0. 1 millolt, right? Because it's the same thing. It's just off by a factor of, in this case, it's off by a factor of uh 10. Okay. So, what do I really
want you to know about the height stuff? I'm not really concerned about you knowing the millie voltages. I'm more concerned about you knowing that one small box is 1 millimeter, one large box is 5 mm. The reason why is when we have to measure ST segments. Is the ST segment elevated? Well, sometimes it needs to be 1 millm elevation. So you have to go in and see is the ST segment elevated more than one box? or maybe it's super elevated and you see an ST segment that has elevation beyond one large box 5 mm. So
the whole point is why do I really want you to know the height? Not super important for the voltages more important for measuring those ST segments. Okay, that's the basic concept if you really wanted to know a little bit more. So again, width is the big one. Height is going to be a little bit more. It's, you know, particular for the small boxes, the 1 millimeter. Hopefully you don't see ST segments that are beyond 5 millimeters in elevation but again you can but again I think we have a basic concept to that. The other thing
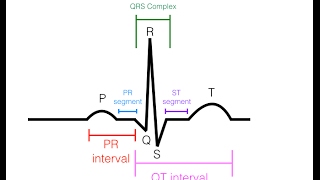
I want you guys to know about this is whenever we look at this EKG, we see the various waves, right? We already kind of have a pretty strong idea about these. But if we were to quickly recap, this is our Pwave Q R ST segment and our T-wave, right? Same thing, but now let's talk about maybe some extra stuff. This is our PR interval. This from this point here to this point here is our QT interval. And then this part here is our ST segment. Right? And we already kind of talked a little bit about
that ST segment there. But what I really want you to know is that these are going to become very important in certain types of pathologies. Okay? So, I want you to have a basic idea of some of these. So, the first one that I want you to remember is your PR interval. So, your PR interval, we already kind of talked a little bit about that. It's from the beginning of the Pwave all the way until we get to the beginning of the QRS complex, right? A PR interval should normally be from it should be less
than 0.20 seconds. So, it should be less than one large box. That's kind of the goal. If it's less than 0.20 seconds, it's considered to be a normal PR interval. If it's greater than that, it's prolonged. It's going to become important in different types of blocks. Okay? So, this is considered to be normal. The next one that I want you to remember is your QRS complex. So your QRS the width of that usually you want that to be less than 0.12 seconds. Okay, which if you count that up one little box is 0.04 seconds. So
if I do 0.04 * 3 that's 0.12 seconds. So I want it to be less than three little boxes. If it's greater than that, it's considered to be a wide QRS, a pathologically wide QRS. Now, some textbooks will even go and be a little bit like stingy and they'll even say technically like greater than 0.10 seconds is considered to be a little bit wide of a QRS, but it's easier to remember. And for the sake of it, if you're starting to like question it, is it wide? Is it narrow? You're taking too much time. If
it's greater than 0.12 seconds, three little boxes, it's wide. If it's less than that, it's narrow. Don't make it too complicated. Right? So, this is going to be normal or sometimes what we call, you'll see us refer to it a lot kind of they're synonymous in a way. They're kind of referred to as narrow, which is normal. All right. The last one here is the QT interval that I want you to know. So, the QT interval is important because whenever that sucker is prolonged, it increases the risk of a particular type of rhythmia called torsads
to points, which is a type of polymorphic VTAC. And so this number it can literally it can vary from textbook to textbook. It can vary from gender to gender. So male females there can be a lot of different ones. The reg consensus that's kind of been I've seen here within the textbooks that I utilized was that if you're a a male or a female and if it's a male less than 430 milliseconds. Now this is utilizing rates particularly at like 60. It depends if you're going a little bit faster you have to adjust. And we'll
talk about those things later. you have to use like corrected QTC formulas and we'll get into all that stuff but for the most part less than 430 milliseconds is considered to be normal in males and then less than 460 milliseconds in females is considered to be normal. Now again I don't want you to get too bogged down into that detail. I usually don't consider something to be super dangerously like prolonged QT until I start approaching 500. But again to really kind of be thorough, these are the numbers that are generally thrown around. But we'll talk
about this a lot more when we get into the arhythmias. Okay. [Music]