STOP Using the Heiken Ashi! This Indicator will DOUBLE your profits
706.01k views1983 WordsCopy TextShare

Data Trader
SimplexFX (Where I Trade): https://simplefx.unilink.io/n/DIMMP7Y
✅ Earn $40 bonus for a deposit abov...
Video Transcript:
hey Traders I'm sure you've heard of the hiking Ashi indicator it is one of the most powerful trading tools used by Traders to get a clear view of the overall Market Direction however did you know that there's actually a better version of this indicator that is proven to be almost two times more profitable than the older version and so without further Ado let's Dive Right In I'm going to show you what the indicator is and how you can use it so first let's look at the classic kaikinashi as you can see the way it works
is that it helps smooth out the price by replacing your traditional Candlestick chart to a hiking RC chart making it easier for Traders to analyze the overall trend like in this example here in this traditional Candlestick chart notice that there's a lot of Market noise in this upwards price movement which could lead to fall signals now if you change this to a high kanashi chart you can see that it actually eliminates those Market Noise by displaying same colored candles when the market is trending therefore helping Traders analyze the trend more easily however as with any
technical indicators the high kanashi has a couple of drawbacks and one of the main drawbacks is that it doesn't provide the same information as a traditional Candlestick chart the reason is because the indicator only displays the smooth out version of the price not the real price and this may restrict a Trader's ability to perform certain types of analysis such as identifying chart patterns or finding key support and resistance levels because we would need to see the real price in order to do that so to solve this underlying issue a new indicator is created and it's
called Smooth hikanashi unlike the classic hikanashi which fully transforms the candles on a price chart the smooth hikanashi instead works as an overlay in a real chart meaning Traders are able to use the indicators capabilities while still maintaining a clear view of the actual price movement furthermore the smooth hikanashi is much better at filtering out noise when the market is volatile as you can see here the smooth hikanashi isn't really affected by the short-term Market volatility as it still gave consistent signals compared to the classic hikanashi which produces multiple fall signals as it reacts more
sensitively to short-term volatility now I'm going to show you how to apply the smooth hikanashi indicator onto your chart so you can use any charting platform with the one that I'm using is tradingview.com next go to the indicator section type in smooth hikanashi and there you can choose any one of these different options now once you've applied the indicator the next step is choosing the settings if you're trying out this indicator for the first time you can just use the default settings at 10 and 10. however if you want to optimize it for your trading
needs here are a couple of recommended values that you could use first if you're focusing on scalping or capturing short-term movement you can use the 5 and 5 settings as it's better at analyzing short-term price movements now if you're a swing Trader who wants a longer term view of the market the 20 and 20 settings is a lot more suitable as it lets you analyze the long-term price movements without being affected by the short-term volatility but for the examples in this video I will be using the 10 and 10 default settings how to use the
smooth hikanashi so the way Traders could analyze the market using the indicator is by looking at the high kanashi candles a green candle indicates that the price is on an uptrend while a red candle indicates that the price is on a downtrend and knowing this we can also utilize these colored candles to identify signs of reversals for example if the indicator showed a color change from green to Red it indicates that the trend is switching from an uptrend to a possible downtrend and vice versa the size of the candles could also help Traders identify the
strength of an existing Trend if the candles are growing larger in size it indicates that the trend is getting stronger which means more momentum similarly if the candles gradually become smaller it indicates that the strength of the trend is getting weaker no these candles could also help Traders anticipate trend reversals for example here we spotted a trend reversal from a downtrend to an uptrend which is also displayed by the hikanashi switching from a red candle to a green candle however notice that before the indicator changed colors the red candles were already decreasing in size before
turning green which shows us that the downtrend here was actually getting weaker before the reversal to the uptrend happened strategies that you can use with the smooth hikanashi so as we know the indicator displays red and green candles depending on the trend Direction however you need to remember that this isn't a buy or sell signal you cannot take a buy position just because the indicator turned green and you can't just take a cell position just because the indicator turned red that isn't how you're supposed to use the indicator because using it that way will actually
result in a very late entry signal let's observe an example in this chart we notice that the market is on a strong downtrend as indicated by these large red high kanashi candles next we can see that the hikanashi candles gradually become smaller before finally turning green which indicates a trend reversal to an uptrend however notice that the color change happens after the price had already made a significant upwards movement so if you would have entered a buy position here that would be considered a late signal because you already missed a huge portion of the price
movement now I'm going to reveal a better way of using the smooth High kanashi indicator the first step is you want to find a strong existing Trend like in this example here you can see that the price is going down while the indicator is displaying large red candles indicating that the price is on a strong downtrend once you've identified the trend the next step is to look for a trend change and we can do that by waiting for the ikanashi candles to show signs of a trend reversal and as you can see here the candles
gradually become smaller and smaller before finally switching to a green color so now we have our Trend change however you don't want to take a buy position here yet because like I said before that would result in a late entry because the price had already moved upwards instead what you do is wait for the price to make a pullback towards the indicator so we're actually using the indicator as a dynamic support and resistance now the next step is waiting for a confirmation signal because we want to make sure that the trend would continue upwards instead
of reversing downwards and so we're looking for an upwards price action at this area and right here we actually spotted a red candle with a long Wick towards the downside indicating that at one point price went all the way down here hitting this low before reversing back up and closes at this level which signals rejection from the downside next after this rejection candle we also have a green engulfing candle that formed which signals upwards momentum further confirming that the price may continue upwards so because we already have our confirmation signal we can now take a
buy position right here now for your stop loss you can place it at the nearest swing low which is at this bottom candle wick and your profit Target could be set at two to three times the stop loss notice that using the indicator this way actually results in a better entry signal now let's see this example in this chart we can see that the price is on an uptrend as shown by the smooth hikanashi forming green candles and after that the haikanashi made a color change from green to Red which indicates a trend change so
again we don't want to take positions immediately because that would have been a late entry as price already went down significantly instead we want to let the momentum settle down and wait for the price to make a pullback towards the indicator and as you can see price indeed made a pullback next we have to further analyze the price action to further confirm that the price will actually reverse from this level and not continue upwards and right here we spotted a bearish engulfing pattern which is a Candlestick pattern where we have a candle's body completely engulfing
the previous candle signaling downwards pressure so because we already have a confirmation signal we can now take a short position here for stop loss place it above the previous candles quick and set a profit Target at two or three times the risk and as you can see this trade ended up being profitable now aside from using it as an entry indicator you can actually use the smooth hikanashi as an exit indicator as well specifically a trailing stop loss indicator by using its ability to analyze the strength of an existing Trend it could be an effective
tool if you want to keep your winners running and maximize your profits in a trade so here's a strategy example in this chart we can see that the market is moving sideways or within range and below this area here we spotted multiple rejections meaning we can draw a key support level down here because price has a tendency to reverse after hitting that area next add this level above here we notice a downwards trend line as the price is consistently rejecting this upper area now if we take a closer look at this price formation it's actually
a descending triangle pattern and in this type of chart pattern price tends to form a breakout after it breaks either one of these key levels and right here it actually broke the upper level which means that breakout is likely going to happen to the upside and to take advantage of this you can open a buy position here now usually in a breakout setup like this it's very common for the price to Surge towards One Direction giving us the opportunity to earn massive profits and so if your take profit Target is set too low you could
potentially miss out on a huge profit opportunity so to maximize your profits instead of using a fixed profit Target you can use a trailing stop loss indicator instead and that's where the hikanashi comes into play so what you want to do is let your open positions run until the ikanashi changes color once it changes it signals that the trend has come to an end and you can now close your position and finally take profit and as you can see because we let the trade continue with the upwards momentum we were able to capture most of
this upwards movement so those are a couple of ways that you can implement the smooth hikanashi indicator onto your trading strategy now if you want more simple easy to understand trading videos like this kindly show support by liking this video And subscribe to the channel it only takes two clicks but it means so much to me and you can check out my other videos as well so thank you guys for watching and I'll see you in the next video
Related Videos

13:32
MAKE $100/day Trading This ONE Pattern!
Data Trader
193,396 views

21:58
The ONLY Technical Indicator You'll EVER N...
Ross Cameron - Warrior Trading
318,246 views

14:39
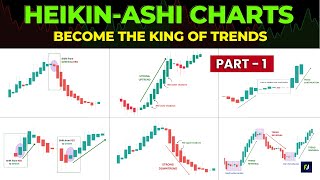
How to use these 3 Heikin Ashi Charts to C...
Prateek Singh - LearnApp
1,087,858 views
18:24
Heikin Ashi Charts 🔥| "Learn to Ride mass...
Fortune Talks
318,967 views

9:05
Smoothed Heiken Ashi: Always Know The ACTU...
Switch Stats
236,723 views

39:19
Support And Resistance Didn't Work Till I ...
Rayner Teo
1,636,836 views

55:11
The ONE Simple Candlestick Pattern You NEE...
Ross Cameron - Warrior Trading
672,428 views

11:50
7 Most Profitable TradingView Indicators F...
TradeIQ
305,486 views
16:05
This is the best way to use Heikin Ashi Ca...
Dhan ⚡
23,090 views

13:39
My Incredibly Easy Scalping Strategy To Ma...
Riley Coleman
119,122 views

16:24
🔴 EMA-Heiken Ashi | This is The Trading S...
Trader DNA
2,544,282 views

8:48
The Only Indicator You’ll Ever Need
TradingLab
210,951 views

11:21
STOP Using The MACD! Try THIS Indicator In...
Data Trader
1,461,662 views

48:15
Reading Candlestick Charts Was HARD Until ...
Ross Cameron - Warrior Trading
449,775 views

34:14
17 लाख का Profit Bollinger Bands Strategy ...
Mahatmaji Technical
283,915 views
16:29
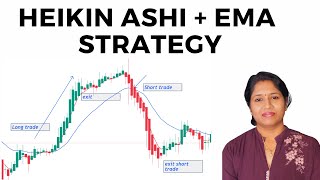
HEIKIN ASHI + EMA TRADING STRATEGY || NIFT...
Trader Chitra
70,818 views
![6 NEW Indicators on TradingView Made 4571% Profit [ FULL TUTORIAL ]](https://img.youtube.com/vi/JatlTycvGvA/mqdefault.jpg)
10:06
6 NEW Indicators on TradingView Made 4571%...
Magic Indicator Strategies
80,243 views

15:40
🔴 HA-MACD System - The BEST Heiken Ashi M...
Trader DNA
253,574 views

32:14
The Trader Who SHOOK MARKETS With a Single...
MegaloMedia
276,475 views
7:23
STOP using old Heikin Ashi! This indicator...
Trades By Mo
59,857 views