27 Years of Trading Knowledge in 3hrs and 5mins
374.21k views36497 WordsCopy TextShare

Ross Cameron - Warrior Trading
Download my Micro Pullback and Stock Selection PDF Guides 💻🎯✅👉 https://warrior.app/knowledge-libr...
Video Transcript:
[Music] in today's episode I'm going to share with you everything that you need to know to begin day trading today my name is Ross Cameron I'm a full-time Trader and in this episode I'm going to share with you 27 years of trading knowledge I'm going to walk you through the basic concepts of how trading works I'm going to share with you how to find the strongest stocks to trade on any given day I'm going to teach you how to analyze those stocks both from the perspective of fundamental analysis and technical analysis that means I'm going
to teach you how to read Candlestick charts how to analyze the correct places to buy and sell how to manage your risk and I'm going to present to you a trading plan with a written step-by-step strategy that you can Implement in your own trading starting today and even better I'm going to show you how to get started without taking any risk I'm going to teach you to trade in a simulated environment that way you can practice the strategy that I'm trading every single day and that you're learning without risking real money once you meet the
certain metrics for success in the simulator I'm going to teach you how to transition from simulated trading to real money I first got interested in the market during theom bubble of the late 1990s all of my experience in the market culminated with me funding an account with $583 15 and growing it to more than $10 million of verified and independently audited Trading profits now I'll be the first to tell you that my results are not typical but it is my unique experience that puts me in the position to be able to share with you what
is actually working in today's market because guess what I show up to trade every single day and so everything I'm sharing with you the strategies the techniques are being put to the test with real money by me every single day now before we jump into this episode I want to caution you of one thing if you don't have the attention to watch Just 5 minutes of this episode before you click away and get to acted and do something else I've got some bad news for you you probably don't have what it takes to be a
successful Trader the reason I say that is because success in trading requires a tremendous amount of dedication discipline and drive but if you really want to learn if you're ready to learn I'll tell you what I'm going to share my strategy with you so all you have to do is bring the 3DS you bring the dedication the discipline and the drive and we can make some fun stuff happen so let's go ahead and jump into this class now I'm going to go ahead and make this slide Deck full screen we have a lot of topics
to cover today I'm going to be condensing 27 years of trading knowledge into this ultimate guide of how to start day trading and I want to begin by helping you identify your purpose let's jump onto the Whiteboard this is the reason why you want to day trade now I think for a lot of people they come with this very simple answer that it's about the money and while I think that that's fine to be motivated by money I want to take it a step further and help you identify what is it that this money is
going to help you achieve the reason I think it's really important to clearly identify your purpose is because learning to trade can be very difficult I sometimes say that this is the hardest easy job in the world and the reason I say that is because on the one hand sitting here and punching a couple of keys and then looking at your p&l and being up $3,744 as you can see I am this morning in less than 9 minutes is pretty impressive that's certainly nothing like swinging a hammer up on a roof in July right I
mean this is a this is a very cushy job but it's also very hard and the area that it's hard is that and this is the blessing and the curse of the market is you can actually spend years struggling to just make $10 a day and you might think this is crazy I'm not trying to drive a Lamborghini I'm not trying to do anything fancy I'm just trying to make $10 a day why is this so hard and the reason that it is so hard is because you won't make $10 a day consistently until you
have a consistent system and a process or a strategy that you follow every single day but here's the the blessing of the market once you have that strategy why would you stop at $10 a day let's say you're making $10 a day trading with 10 shares you go up to 100 shares you're making 100 a day you go up to a th000 you're making a th000 you go up to 10,000 you're making 10,000 right you start to scale your Strat stry up and so through this episode I'm going to share with you how to lay
the foundation of a strategy and I'll share with you the strategy that I think is the most consistent and this has been in my own experience and then how you scale that strategy up once you begin to find some early signs of success but we have to talk about the real purpose here because for me what I found when I got started was that what motivated me actually was not the money and I've known a lot of people who came into the market focused just on how much money they can make and they end up
spiraling and they blow up their account and they're gone because they're focused just on the money what I want to encourage you to focus on is not the money but the process what I consider um the money to be is a byproduct of a successful process and this has Step One stock selection criteria step two risk management you've got rules for um technical analysis and when you follow this process to the every single day then profits are the byproduct so what's going to motivate you to go through this learning curve to get to the point
where hopefully you're able to produce consistency so for me it wasn't the money that was the motivator for me it was freedom and the reason I say that is because when I got started I I had graduated college just after um the well it was a Great Recession so 2008 2009 we had this Great Recession then we had this sort of Market recovery and I gradu situated into an economy where the job market was dismal there was nothing you couldn't find a job even if you had a master's degree it was very hard to find
work and I realized very early on that I couldn't depend on anyone else in fact my mom worked at a hospital for over 40 years before being unceremoniously laid off they let her go and to me that was really sad that someone could have that much tenure and that much loyalty to one place and they don't have loyalty to you so you have to put yourself first and having seen that and that happened right when I was finishing College seeing that firsthand just gave me this it just gave me such a terrible feeling about entering
the job market what's the point there's a quote by Jim Carrey he says that one of the things his father taught him is that you can you can you can work very very hard doing something you don't like and still fail so you might as well try to do something you really love that's not word for word but it's something like that and that really resonated with me so for me when I came into the job market I was at a point in my life where my father had just passed away I was a I
was a young adult I was kind of on my own trying to figure out what I was going to do I had a college degree that felt more or less useless and I wanted to find a way that I could cover my cost of living so I could spend time figuring out what I really wanted to do with my life that was my goal and I wanted to find a job where I could make that kind of money without having to work 8 10 hours a day because then that would take up all of my
time and I wouldn't be able to spend time exploring the things I might really like to be doing with my life and so I had a friend that had made money trading penny stocks in high school he made $116,000 on a penny stock and as a young man would who's in high school he bought a used Nissan Pathfinder he bought a big screen TV in his basement and he even had a um one of those arcade machines like an old arcade machine that they used to have at um Pizza Hut and it was amazing but
that inspired me when I got out of college I thought you know if Ben could do it maybe just maybe I could do it too and so I came into the market with this goal of just trying to find maybe one or two opportunities a year thinking that would be enough to maybe make3 $50,000 just to keep my head above water while I figure out what I really want to do so for me my motivator for learning how to trade was Freedom uh the potential to be uh To Be My Own Boss essentially to be
self-employed but the problem with a lot of um times where you're self-employed is that you your clients become your boss if you're self-employed as a contractor a general contractor subcontractor or something like that you still sort of have a boss I mean you're Your Own Boss but but only sort of so Freedom the ability to be my own boss and something that I really admired um in trading was time that I could have more time in my life because what I knew was that most active Traders were really only trading for a few hours each
day and then the rest of the day they had all this time to do other things that they might like to do or even have second or third sources of income that they're generating from that time so for me trading wasn't something that I was planning on doing for eight hours a day or 40 hours a week it was something that I thought could also supplement other things that I might start doing just wasn't sure what those things were just yet now as we go through the class one of the things I'm going to encourage
you to do is to actually print out some of the perfect examples of charts to put them around your desk so it's inspiration when you see an a quality setup you'll reference that chart you'll be like oh wait a second I know that right I printed this out from you know Ross's PDF or whatever so I've got it right here that's what I'm looking for now I'm seeing it in real time boom but what I also encourage you to do is to sort of put that image of the light that you want around your desk
this is the life of self-sufficiency this is the life of Freedom this is the life of spending more time with my family because that is what's going to help you stay disciplined in those moments where you need to dig deep where you need need to dig deep because learning to trade is difficult because you're getting frustrated because perhaps you've taken a loss and while it may only be in a simulator you may feel that moment of disappointment and I want you to understand that you're not alone in feeling that way I feel those same feelings
feelings I get really frustrated at times when I have a big loss I get disappointed the difference between me and perhaps a beginner Trader is that I don't act on those emotions I've gotten better at having the discipline to recognize that I'm feeling frustrated I'm feeling emotionally activated and if I continue to trade in this state of mind I will not be trading at 100% and that's why the next topic that we have to cover is on mindset the mindset of winning something that I've noticed in the market which I think is really unfortunate is
that sometimes it feels that the people who need the money the least are the ones who make the most and it's the traders who really desperately need money like I like I did when I was getting started who who really struggle and why is that I think that that all ties together to mindset so success is about in a lot of ways a state of mind traders who have a lot of money who come into the market and they already have a lot of money whether it's because they had another job or they have savings
or whatever it doesn't matter they come into the market with money they come in with a certain degree of confidence they don't need to make money from trading this week or this month to pay their bills the way someone like you or I might so they're able to approach trading from this place of genuine curiosity like hey if this works out and I can make some extra money trading that's awesome and if it doesn't work out n that's okay too and that Detachment is an emotional Detachment and it detaches you from that big emotion of
anger and disappointment that comes with losing money or from the feeling of being so elated when you make money with beginner traders who are really tight on money the emotional highs and lows can be really big and here's the problem with that we jump onto the Whiteboard you have these big highs and lows in your emotions and what you'll notice is that this will correlate with a very erratic Equity curve so traders who experience this will have profit loss um curves where they'll go up and then they'll have a big loss and then they'll go
back up and then they'll go back down they'll go back up they'll go back down they'll go back up they'll go back down they'll be maybe a break even Trader they're not making money and it's the traders who have more of this sort of narrow band of emotional range who end up being the traders who just have this sort of I'll do it a different color so it's easier to read have this kind of just nice graph ual slow and steady ascending Equity curve and I'll actually show you if we look at my Equity curve
right now we can just look at the last 90 days just as uh as for example the last 30 days the last 90 days you can see how this is the equity curve of a Trader who clearly has solid metrics great profit loss ratio great accuracy a strategy that's working but at the end of the day these types of uh metrics here this creates a tremendous amount of self confidence so this creates a Trader who is no doubt going to be in the mindset of being a winner so the winning mindset it's more than just
actually making money and this is sort of a tricky thing because if you have to have a winning mindset in order to make money how can you come to having a winning mindset if you're not yet a winner how can you in other words fake it until you make it and so I think the question here is what is it that makes people who have more money just seem like they're able to approach it from this perspective of nonchalant I'm just going to learn and whatever I learn is just genuinely great they've taken the risk
off the table of if they have a big loss that means dot dot dot right if I have a big loss that means I won't be able to pay my mortgage this month or I won't be able to pay my car payment this month when you start stacking up all of these pressures related directly to your performance Trading you get essentially performance anxiety and this is one of the things that people don't always anticipate with trading this is a performance career it's a it's not sport but performance sport just like a performance sport it's a
performance career where if you have if you perform really well you can have a great year if you perform really badly you could have a bad year and the truth is I've had years where I've done twice or three times as much profit as I did in the previous year and then I've had years where I made half as much so I found that trading can be a bit more volatile with the ups and the downs and a lot of beginners are not prepared for that this is a performance-based sport so as the the better
you are at identifying those strong setups at doing your technical analysis at choosing the right places to buy at adhering to your exit indicators naturally the better you'll perform but what happens to a lot of Traders is that they become emotionally compromised the pressure to perform starts to get them to the point where and I speak from my own experience it gets me to the point where all of a sudden I'm like I need to hit this number this month and so in order to take the number of Trades required to make that amount of
money if I'm not seeing high quality trades you know what I end up doing I reduce my quality threshold so let's jump back onto the Whiteboard here let's just say that we have a month where the Market's a little bit slower and so a quality setups let's say at the rate of um typically 10 a quality setups per day so in a um in a hot Market maybe we have 15 to 25 in a u medium Market we have you know let's just say um 10 to to 15 and in a cold Market let's say
we have you know Zer zero to to 10 so we might have some days where we have almost no setups and so if I'm at a point where I'm thinking okay this is where I'm at on the month and this is where I want to get to right here based on me averaging what $1,000 of profit per trade and with accuracy of about 70% so I'll have out of every 10 trades I'll have three losers but seven winners then in order for me to get here I'm just statistically going to need at least let's say
you know 100 trades this month all right so 100 trades will get me there I'm not going to get there if I don't take at least 100 trades but if the Market's cold then a quality setups if I'm only getting 0 to 10 a day let's say I'm getting two a day two setups a day well we only have 20 trading days in the whole month so that means I'm only going to get 40 trades in the whole month and I need 100 to get to my goal so then what do I do I start
saying well I get a little desperate I say you know what maybe I'll take some B quality setups and in a hot Market be quality sets you might have you know 40 40 to 75 right and in the cold Market it's going to be less but by reducing my quality threshold I can now introduce more trades but let me present to you with this uh reality a quality setups for me produce generally about 70% accuracy I take these setups I'm right about 70% of the time I start reducing my quality threshold and trading B quality
setups 60% I go down to cquality setups 50% I go down to lower than that and I could go down to anywhere from 30 to 50% accuracy right so now you get to a point where you're taking more trades but your accuracy is declining you're taking more losers and so instead of seeing this Equity curve like this you've reduced your quality threshold so now instead you're seeing something like this big losses right because you're taking these lower quality setups that in invariably result in big losses and this is such a myth that beginner Traders fall
into that they think in order to achieve this goal I just need to take more trades and because there aren't a quality setups in this current market I'm going to reduce my quality threshold whereas a more seasoned Trader would say I'm not going to get here this month that's not going to happen that's gone but this is what's going to happen if I reduce my quality threshold to trading B and C quality setups I don't want to do that either instead I would rather be content with getting only to here but continuing to maintain these
metrics right here of a quality setups because if I continue to trade right in here you know what I'm going to be able to maintain I'm going to maintain confidence I'm going to maintain that mindset of a winning Trader in trading psychology plays a really big role and we're going to talk about it a little bit more as we continue on with this uh class today but one of the things I want to touch on and I'll put up my whiteboard here again is that there's this phenomenon that I've noticed among Traders which we call
spiraling so if you spiral what does that mean typically what this means is the trader find finds themselves in a negative feedback loop where they start taking losses and the losses get bigger and bigger and bigger and it usually begins with one surprise loss so number one is you know big unexpected loss and this is part of trading I'm not going to lie to you and tell you you won't have losses because we will we all do and you will as well if you start trading so you just have a big unexpected loss and it's
unfortunate but these things happen but rather than having the emotional state of mind to say all right I'm just going to take a break I'm going to wait instead you start Revenge trading you desperately try to make back the loss you've just incurred and the reason that so many of us do this is because of the fear of loss it doesn't really make sense because we've just taken a loss so the last thing we should do is like double down on the next trade but in fact because we've just taken a big loss we often
feel that we need to make back that loss as quickly as possible right that kind of erases it and so then you want to take a trade as quick as possible and since your emotion is so strong to help you no longer feel like a loser but to feel like a winner you're probably willing to reduce your quality threshold and take a b quality or C quality setup but what that typically results in is number two secondary losses so now you have secondary losses and You Begin a sort of stair stepping down where your Equity
curve which at one time may have been looking uh you know quite nice has now taken one big step down and now another big step down so at this point this is where the emotion of desperation sets in so you have one loss and then you reduce your quality standard here and so what happens the result is your accuracy goes down so you go from being a 70% accurate Trader to being a 60% accurate Trader and now your number three losers average losers get bigger they get bigger because you've introduced more losers in total and
you're trading from a point of emotional compromise or emotional hijack so then number four total losses get bigger right so total dollar amount negative gets bigger number five loss of confidence loss of confidence loss of account size and if you have a small account let's say you started at number one with a $5,000 account and by Point number five here you're down to a $2,500 account you've now lost 50% of your account in order to get back to 5,000 now you've got to grow your account by 100% And so what you've essentially done is now
even if you were calm cool collected you've made it that much more difficult to grow your account this is all self-inflicted this type of spiral what I want to present to you is an alternative I want to put you instead of on the path to spiral on the path to a positive feedback loop so a positive feedback loop looks like this high accuracy trading leads to strong profit to loss ratio which means your average winners are bigger than your average losers which leads to confidence which leads to bigger size bigger Pro bigger uh bigger share
size which leads to even higher profits which leads to even more confidence and this is where you have accounts that grow like this they start growing fast because now you're on a positive feedback loop it's the exact opposite of what occurs during a spiral this is the mindset of being a winner so I'm going to be honest in order to be a really good winner you might think it just means taking bigger size and being more aggressive and there's no question that those are parts of it but being a really good winner requires you to
be an amazing loser to be really good at losing there's a saying that by being a good loser at trading that is perhaps the only path to success you have to got to be a great loser and what that means is that you're cutting your losses very quickly and when you take losses you don't allow yourself to fall victim to emotional hijack the challenge here is that that emotional hijack happens so quickly it creeps up on you and once you become truly compromised truly hijacked it's very hard to have the self-awareness the presence of Mind
in that moment that you're starting to spiral usually the way you think of it is oh I just had one loss I'm going to take another trade real quick and then you're like three losses in you're like I'm just going to take one more trade and next thing you know you look back and you're like I just took 11 losses in a row what happened I I wasn't even thinking and the truth in that statement is that you were not thinking you not thinking with your analytical mind you are thinking from a pure state of
fight or flight emotion because loss can trigger this big emotion the way I train people to be really good at losing is to practice trading in a simulated environment you practice in a simulator because when you lose in a simulator while it hurts your metrics of profitability it hurts your accuracy your profit loss ratio it hurts the timeline of when you'll be able to go live with real money it doesn't cost you actual dollars in that moment and so you start to get really good at exiting trades in the simulator based on the exit indicators
that I'm going to share with you during this class you get so good at it it becomes second nature it becomes an instinct to sell when you see that exit indicator once you achieve the metrics of success in the simulator and you transition to real money the way we transition is by having you trade with such small size with real money that you desensitize yourself to the emotion that comes with loss so you start with 50 shares sometimes it's even smaller 10 shares then it's 50 then it's 100 then it's 200 500 1,000 2,000 4,000
6,000 20,000 right you eventually scale all the way up but there's no way you could start on day one with 10,000 shares of real money 20,000 shares it'd be impossible because the gains and losses the numbers would be so big so quickly it would be impossible that it doesn't trigger an emotional reaction I'm at a point now where I can trade with 10,000 20,000 40 50,000 shares and for the most part I'm cool as a cucumber I'm not feeling my heart pounding you know my Palms aren't sweating I have such a degree of uh confidence
in my strategy and I've been able to desensitize myself to to losing $5,000 in you know a few minutes that I can take that risk but it takes time to scale up up to it I'll say right now I'm in a kind of unique position because having been making YouTube content here for o over a decade really over a decade I created this YouTube channel in 2013 so for over 10 years I've been uploading videos to YouTube I've got to really see the whole spectrum of different Traders commenting on my videos and of course at
Warrior trading I see the whole spectrum of traders who are in our program who are learning how to trade now usually the traders who join a program who are going through a curriculum they're usually taking it more seriously than some of the people that are just watching on YouTube and are kind of like you know watch a couple episodes but they don't really sink in but one of the things that I can tell you is that I've been able to identify that there are two leading causes of failure when it comes to trading the first
is that Traders don't have a strategy and I saw this a lot during uh I guess the covid pandemic where we had these Inc this incredible bull market I mean the market was unbelievable the pandemic was really an amazing time for a lot of traders in the stock market and it was a difficult time in other aspects of the world but for the market it was very strong of course we had Tesla we had all these large cap companies that were going higher and then we had the GameStop short squeeze and it was like these
back-to- back incredible opportunities and so traders who came into that market with a strategy like myself did exceptionally well and I've got a number of members at Warrior trading that earned their million doll badges during that period of time because the market was just so high now I'll say as always my results aren't typical and neither are the results of some of those exceptional Traders but one of the things that I noticed is that a lot of people came in during the pandemic and they were kind of throwing darts you know at a at a
dart board and they were getting lucky they were just buying a stock and it would go higher and they would make money and and it felt like a lot of people benefited from beginner's luck they were just at the right place at the right time and while beginners luck is wonderful it's certainly better than not having it at all I suppose there's also a curse to having beginners luck because you get a false sense of confidence you start to think that wow I'm I'm untouchable right everything I trade turns to goal I'm just I'm winning
at everything but that luck runs out and that did run out for a lot of people in 2022 when the bare Market set in with interest rate hikes and then 2023 and 2024 was the realization for a lot of these traders that they really didn't have a viable strategy they didn't know what they were doing so the the first group of traders that fail fail because they don't have a strategy they don't really have a repeatable process of stock selection of where to buy of exit indicators it's not systemized so the results they produce are
inconsistent you have to follow a very consistent process if you want to achieve consistent results and then the second group of Traders the second group of Traders lose not because they don't have a strategy they have a strategy but they lack the discipline to follow the rules of the strategy and this is one of the most frustrating things and this is actually something that I struggled with for a long time when I was getting started I I eventually got to a place where I had a strategy that was more or less working but I was
My Own Worst Enemy because when I would have a red day I wasn't able to be a good loser I would turn a small loss into a snowball I would spiral and so this was what my Equity curve looked like when I was getting started I'd have a little bit of progress here and then one day boom I'd give back a month of progress and then I'd spend another month rebuilding I'd make a new high and then sure enough there it would come again and then I would get some progress get some progress get some
progress and then boom there again I have a member at Warrior trading who's earned his $1.5 million badge and I did an interview with him and I asked him I said Jess what was your Turning Point can you identify a specific moment where you kind of went from being a struggling Trader to being consistent Trader and he said I didn't have a turning point I just slowly started to suck a little bit less and so what his Equity curve looked like was kind of like this but we'll sort of Zoom it out even bigger so
we'd have a little bit of progress and then give it all back a little bit of progress give it all back and then what started to happen is he would make a little more progress before those days where he would give it all back or give a lot back so what happened where these red days would start to get a little bit more spread out and he got a little bit better at recognizing those red days and what was happening before he let them get hug like this so he's able to recognize okay this is
a red day I've been here before I know what's going on and eventually his red days just got spaced out more and more and more they still happen it's not about not having red days but it's about how can I have this happen basically how can I reduce the frequency as much as possible and what I want to show you here from my own metrics is Discovery that I made in my trading and this is going to help you better understand position management so I went into my trading and I decided to compare winning days
and losing days this is a nice report that you can look at and so what I noticed was that on my winning days if you added up all the winning days I've ever had I've got $16 million of profit with an average daily gain of $10,000 on my winning days that's all great and look at my accuracy 71% on winning days that means no doubt I'm trading a quality setups right for sure right this is great that everything about this looks good my average winning trade is 1,300 bucks my average losing trade is 1,000 everything
about this looks great now let's look at this right here on my average losing days I lose $8,000 fortunately the loss there is smaller than on my average winner but this is something really critical on my losing days my accuracy is only 50% and what this tells you is that there is no doubt that on my losing days I deviate from my strategy historically I've tended to deviate from my strategy and stop trading AE equality sets I start trading lower quality setups this is a discovery that even after all of my years of trading 27
26 and a half years of trading experience trading knowledge comes to the point where I look at this report in a way I had never looked at it before and I looked at this right here my accuracy and then I asked myself how could I identify that today is going to be a losing day as early as possible so I stopped trading on that day and I realized that if on every single day I sit down on any given day I sit down and I start the day at zero right I'm not holding any positions
from the previous day so I start each day at $0 so in way my highest risk is on trade number one because on trade number number one if it goes wrong I'm going to go into the negative but if on trade number one I immediately have $2,000 of profit then right away I've got a profit cushion and now I'm in the driver's seat and so I said what if I set a new rule for myself and this is a rule that I now follow that's not designed about making a lot of money it's about controlling
downside risk I said what if I trade with a Max position of one4 of full size so whatever a full sizee position would be for you maybe it's a th shares then I'm going to trade with a Max of 250 shares until I have made 20 cents per share of profit which in the case uh here would be $50 and then once I'm up $50 then and only then will I start trading with my full size position and what this did for me was it helped me on days when the market was genuinely cold and
there were not a lot of a quality setups it helped me avoid going deep into the red because it's true that on losing Days part of the reason I have lower accuracy is because even the a quality setups aren't working as well on a hot day a good Green Day they're working at the rate of 70% but perhaps on a colder day even in a quality setup accuracy might reduce to 65% or something like that it's not as bad as 50% the reason my accuracy dro down that low was because I started grasping for straws
in a state of emotional compromise trying to find anything that was moving to avoid having to lock up a red day and so I realized if I trade with small size on those first few trades and I go red the amount that I'm red will be at the rate of only quarter size position so I won't be that deep in the red in fact I won't be R enough that I become emotionally compromised and I'll be able to recognize very quickly wait a second I just had three losses in a row for my first three
trades today is not the day to push it let's keep myself at small size until I'm up 20 cents a share and if that just doesn't happen then I'm going to stop right here and I'm not going to allow myself to go further into the red since making this discovery and this was in um this was in June of uh this past year that I made this discovery we then we can look um let's look at year-to date so we'll look year-to date here So currently sitting at just under $800,000 of profit year to date
with a million doll goal we look at my calendar here and since making that Discovery in the end of June it was right in here that I made the discovery I then went on to have it was about 45 consecutive green days in a row through all of July through all of August and through the first part of September and then here in September I've had two red uh days so far out of the whole month we look at the month of August total profit $171,000 we look at the month of July total profit $232,000
and each day I started with this approach right here this is designed to help me be a great loser that's all it is it it it does come at a sacrifice because I won't be able to make quite as much by starting each day with a quarter position but what I learned is it helps me reduce the red days and the draw down and that is worth more than the gains I might have made with a full-size position on that first or second trade so now we've talked about finding your purpose we've talked about the
mindset of winning we've talked about how to be a great loser let's talk about how to start trading with no money I think this is something that um a lot of Traders face a lot of Traders have an interest in the market and they have no money for me when I was learning about the market during the com bubble of the late 1990s I was still in school so I didn't have a real money account in fact I did we had a school semester that was dedicated to learning about the stock market we partnered up
in in groups so my partner was named Cooper he lived in in my town in Vermont and so he and I had basically a simulated trading account a pretend account and we were buying and selling different stocks and we were updating our Ledger it was all written every single day and I would this for me was such a pivotal moment because I got so inspired and so excited by the potential in the stock market so during that period of time I had $100 the first job that I ever had was as a newspaper boy in
a small town in Vermont I was delivering a newspaper and I made $5 a week and no it was in N not in 1950 it was I was working below the minimum wage earning $5 a week to deliver these newspapers that's a dollar a day um Monday through Friday anyways delivering the newspaper and I I had $100 saved and so I went to my local stock broker office and you know it's Vermont you don't really have a stock broker but you have you have office of a financial advisor and I knocked on their door and
I think actually called them but anyways I called them and I said I'd like to buy $100 of this penny stock that I've heard about and they told me well I'm sorry son we charge a commission $50 to buy $50 to sell come back when you've got more money and so that was it there was nothing I could do I didn't have enough money to actually go into the market but that didn't stop me from studying so I kept learning about the market I learned as much as I could I was asking people I was
my mom had uh I guess like a 401k you know investment account so I was looking at what are the positions that you're holding I was looking at all of them I started tracking them I got really interested in the market and then in when I was in high school a couple years later I funded my first account with um a merit trade and I funded it with $1,000 now that was at that point my life savings it had grown a little bit I'd been mowing some Lawns and keeping myself busy so I now $1,000
I funded that account and you know what I did I bought shares of companies that I was familiar with I bought American ski comp no um sorry um American Electric Power I bought Exon Mobile fizer caterpillar you know some of these big companies that household names but the problem was over the course of three months which was summer break I was hoping that this account would grow that I would make more money in the stock market than I would have made mowing lawns that was not the case because I only had 1,000 bucks so 1,000
bucks invested in the market over the course of three 3 months the market grew like 3% I mean it didn't grow very much at all so my account was more or less unchanged and in those days you had to pay $10 to buy and $10 to sell so with the fees and the commissions I had nothing to show for it so that was my kind of attempt but once again I came up with this struggle of I don't have enough money but my problem there really wasn't money the problem was that I didn't know the
right type of stocks I should be trading based on the amount of money I had now during that time I've been learning about Investors like Peter Lynch who ran the mellin fund at Fidelity I learned about Warren Buffett benjam Graham some of these big well-known investors some of them have books that you can read and I read some of them the problem was a lot of those books and a lot of the strategies that these big investors use are totally not applicable to someone with a th000 bucks someone that has basically no money investing in
a company that might grow 10% or 12% a year it's going to take way too long to grow your account so what I ended up discovering was that there's a different place in the market depending on the amount of money you're coming into the market with and your appetite for risk and your aptitude to actively trade the market and so for those of you that are coming to the table with nothing you have no money and maybe you're saying Ross I've got $15 in a Robin Hood account what should I do to grow it what
I would tell you right now is that you're not going to be able to likely grow a $15 account in any meaningful way but what that account is good for is something much more it's good for proof of concept because what you could do is you could trade with one share of maybe some stocks or you could even just use the simulated trading mode which is the better thing to do so you flip to the trading simulator pretend money you set your account let's say $11,000 or $3,000 you give yourself a little bit of a
cushion and you start practicing the strategies that I'm going to be sharing with you as we continue on this episode and what you're going to find is that even with a relatively small account when you're trading the right stocks you can grow a small account and so the right way to get started is to prove through proof of concept in a simulated trading account that you're capable of growing it now during this time you continue doing other things that can earn you money whether it's driving Uber or door Dash or whatever the case is you
do your side hustles you continue to make money and you save as much of that as you can so once you've proven that you have the skill and the strategy that is producing consistent results then at that point you're ready to deploy cash behind that strategy so I really believe that there is a path to learning even for people that have basically no money money it's not the path that's exactly the same as someone who comes in with a $50,000 or a $500,000 account but you know what let's let's play devil's advocate for a second
let's talk about some of the inherent advantages that come with starting with basically nothing if you start with basically nothing or you have a very small account or you just a couple thousand dollars whatever it is there's an advantage in that that you might be overlooking and the advantage is that if you make a mistake you're going to hit rock bottom very quickly but when you hit rock bottom for a lot of people that will force them to take a look in the mirror and ask what am I doing right now that's really working and
what am I doing that's continuing this downward spiral and so that's the opportunity to stop to go back to the drawing board and say wait a second what do I have to do differently now honestly even for me the discovery of this position management strategy was what came just after having a big loss in June I had a big loss and that forced me to take a look in the mirror and ask myself what am I doing right now what's working and what's not working and I'm getting frustrated and so that process by itself became
the Catalyst for a discovery I'm in a position where even though the the forcing of that moment is not based on the sort of monetary like I lost that amount of money and I'm now desperate for me it's more about performance because I have so many people here on YouTube that are watching over my shoulder every single day and they're expecting me to per form that are expecting me to trade my strategy consistently and to follow the rules of my strategy so when I deviate for me it's very embarrassing from this sort of public perspective
of there's so many people watching so that creates a little bit of a different pressure but it's still enough for me to take a look in the mirror and be like you're an idiot what are you doing you got to make a change you got to go back to performing really well because there's a lot of people counting on you there's a lot of people watching you every single day that expect you being at your top of your game top performance what's pressuring you to have that realization with a small account can be wow I
just took a loss and I blew up my account the account's gone and so something as a word of caution for Traders who are coming into the market with a big account maybe high five figures or six figures or even seven figures be careful with that because sometimes having an account that big can encourage you to continue to take risks and risks and risks and start to spiral that account and Rock bottom is a long ways away so I would actually say that I think for every Trader no matter how much money you have the
best way to start is to practice in a simulator and the best way to transition from the simulator to real money is by transitioning with small size and slowly increasing risk so in fact it puts us all on Level Playing Field no matter how much money you might have we all start exactly the same way and it's because I really think that that is the right way to learn now while it's possible to start trading with no money and I think it's actually advisable to start with a very small account the next thing I want
to talk about is finding a mentor whose strategy you like now obviously you're tuning into this episode and you may find that you like the way I teach and you like the way I trade and if that's the case that's wonderful and I'm happy to continue to teach and for you to continue to learn from me whether it's on YouTube videos like this or by becoming a member of warrior trading either way is fine but you have to find a mentor whose strategy and level of risk relates to what where you're at for me if
I made Warren Buffett my mentor and of course you don't have to know someone personally for them to be your Mentor for them to be someone you idolize and for that strategy to be what you aspire to but if I tried to be like Warren Buffett or I tried to be like some of these other big investors it would be really silly because their risk tolerance is completely different from mine and their account sizes are completely different from mine that's most notable so for them making 10% on a multi-billion dollar account is fantastic making 10%
on a $5,000 account that's $500 for the whole year that's not going to pay for your time to spend every single day in front of the computer so if you're starting with a small account you need to learn from someone who's also trading in small accounts so one of the things that I prided myself in is that I essentially am perpetually keeping myself in small account status relatively speaking so when my account grows I take the money out I drop it back down my account grows again I take the money out I drop back down
I start again and for me I'm always in this state of just trying to hit these base hits percentage Gainer 15 20% winner lock it up lock it up lock it up I want to just continually grow my account now right now I'm in the middle of a small account challenge I'm using thinker swim as my broker it's a cash only account I can only trade one trade per day and my goal is to grow this account to $225,000 as quickly as I can and I'm making really great progress I think I'm I'm probably a
week or maybe two away from hitting 25 Grand and and the strategy that I trade in that account it's the exact same strategy that I trade when I'm just trading in my regular account which has six figures in it usually 100 $150,000 the only difference is that in the small account challenge I can only trade once per day usually that's the Restriction I can take one trade per day using the full balance and then I have to wait till the next day whereas in my big account I can trade 10 or 15 times or as
I mean I could trade as much as I want each day as long long as there's still a quality setups at the end of the day you want to find a mentor whose strategy you like and who you feel that you can learn from for those of you guys that want to learn more about my strategy I'm actually going to put a link it's going to be pinned to the top of this uh top of the comments in this video right here down below and I'll also pin it to the top of the description that
link is where you can download a set of PDFs that accompany this class right here there will be a trading plan that you can download which I'm going to be sharing with you as we continue on it'll also include my small account strategy my stock selection PDF and the micro pullback strategy PDF all of these downloads these are it's a free bundle of downloads they're PDFs you can download them you can print them out and what I want you to do is I want you to put them around your desk so some of these are
going to have uh charts that you can pin up to your monitors or right next to your monitors others are stepbystep guides of this is the process of stock selection where I get in where I get out everything else so the more that you can Embrace fully immersing yourself in the strategy that other people are trading right now I think the better off you'll be that's my belief so if that strategy is mine then I want to encourage you to just get fully immersed and learn as much as you can about the way that I
trade so now that you've um now that you understand finding a mentor is very important we're going to talk about stock selection so when we talk about stock selection um I'm going to break down for you the five pillars of stock selection so this is going to be five pillars right here and this is in the PDF that you guys can download so when you download it it could be a supplement to what I'm going to share with you right now now when we're talking about stock selection one of the things that um we're going
to talk about is price percentage change today relative volume RV which I'll explain in a second news and Float these are the most number these are the five most important criteria that if a stock doesn't meet the criteria for each of these I'm about to share with you I will not trade it now there are some additional criteria that we'll talk about um over on this side which are I would say bonus uh criteria but if a stock doesn't meet it but it does meet these five I'll still probably trade it the bonus criteria just
make that setup that that stock that much better now one of the things that I should mention um before we talk about stock selection is that when I was learning to trade I didn't have the benefit of having a mentor I was completely self-taught and that was because I was learning to trade during a time when day trading wasn't really that popular it was popular during the dot bubble of the 1990s and then after the Great Recession you know I mean after the bubble burst in the turn of the the century we didn't have a
whole lot of interest in day trading there was a sort of big decrease and then it picked back up and then we had the Great recession right the financial crisis so all of a sudden people were not interested in trading but that was when I came into the market so I came in during a period where there weren't a lot of people that you could learn from in fact one of the best ways to learn in those days was to move to New York City and get a job working at a fund now funny enough
I actually was living in New York City at this time and I applied to get a job working at a hedge fund because I wanted to get my foot in the door and you know what they said get out of here there's other people more qualified than you who have a degree in finance who are applying for this unpaid internship we're going to choose them first you're your qualifications don't line up for an unpaid internship well look working at a hedge fund you mean that you know there were people lining up and and I was
not first in line so it's funny because you know I've ended up becoming a very successful Trader but I wasn't able to do it during that through that path My Hope was that I could learn by working with these people and that just wasn't an option today it's still probably as difficult to get a job at some of these big hedge funds and to be honest if you got a job at Citadel or one of these huge funds you'd probably be sort of pigeonholed into just you know crunching numbers as some analyst and you wouldn't
really gain a lot of experience about what it's like to be a Trader you might make good money but you wouldn't be actively trading so finding a mentor for me wasn't really an option which is why I spent years of trial and error just sort of trying to figure out what worked and one of the things that I discovered through that period of time was that um one of the biggest gifts that I had from U my Early Education in the stock market was the importance of tracking all of your trades so I was and
this was from the very beginning I tracked all of my trades in a written Ledger in the late 1990s that was the same in 2001 2002 when I was trading uh while I was in high school with a AER trade and so when I started trading again uh just after the Great Recession I was tracking every single trade and by tracking my trades and analyzing this data I've been able to develop some U to understand essentially where in the market I make the most money so if I gave you this data and I'm going to
kind of walk you through it this right here pretty much describes exactly how the type of stocks that I make the most money on what you can see here is that my profit comes from lower price stocks this is all from stocks under uh $20 a share right there's the $20 cut off so between two and five between 5 and 10 and between 10 and 20 and this is millions of dollars of profit now the reason I like trading these lower price stocks is because they make big percentage moves I've seen $2 stocks go from
$2 to $8 in one day so when you have a 400% move a 500% move a 6 7 800% move the I think the biggest percentage move I've ever seen was about 3,000 maybe 4,000% in one day so when you see a really big move like that that's a dream for a small account Trader because if you bought even a small position but the underlying asset goes up 3x or 4X you're going to have a huge winner now if you trade $50 $60 stocks they don't double in one day they they never they almost never
go up 100% in one day but $3 stocks $4 stocks they'll go up 100% in one day and we see that all the time in fact if we look today um let's see well this is a um this is an interesting day we can look at our biggest percentage gainers today we've got um 75% 73% 62% 38% and the stock that I traded this morning which was onco here this one went up about 100% it peaked at about 100% um between yesterday and today so you could see here we started down here a little under
350 and we squeezed up to uh just over 650 so that was a really solid move and you don't see moves like that on higher price stocks it's just it's very uncommon I think the reality is most retail Traders like you and I Traders with relatively small accounts we end up gravitating towards low price stocks because we can a afford to buy more shares when you could buy more shares that 10% 15% 20% move in the underlying asset is a bigger uh a bigger profit so then number one for stock selection criteria we have to
say price ideally is under 20 now when I'm doing my small account challenges I will sometimes drop that to under 10 I'll just say look it's a small account I've got a th000 bucks I can't trade anything that's $20 a share so I'll drop it down but for generally speaking regular trading account under $20 now one of the things that um is also worth noting is that I don't typically trade penny stocks and even stocks under $2 have only made up about 4% of the well less than 4% of the 13 milon of profit it's
only $400,000 here so one of the things that I learned is that lower price stocks while you might think that that's even better because you could buy a 10-cent stock and sell it at 20 or 30 cents like my friend Ben did when I was in high school what I've actually learned is that penny stocks can be very difficult because when stocks are below $1 a share they actually trade down to the 1/1 100th of a penny and so what that means is if if you looked at a stock that's um 10 cents it's not
trading 10 cents by 11 cents and if it goes up 10 cents a share it'll be at 20 cents it actually trades typically 10 cents well it looks more like this so 10 one for instance by 102 it could actually look like that trading down to the 1/100th of a penny so to go from 10 cents to 20 cents is 10 cents each one has 100 hundredths of a pen so that's actually 1,000 price increments to go from 10 cents to 20 cents whereas as soon as a stock trades over $1 they trade with a
spread of one cent so to go from a dollar to A110 really is only 10 cents and it's only 10 price increments so typically we find stocks below a dollar are slower moving and then once they break a dollar that's when it gets more exciting the only problem is that there's a lot of Traders when a stock is below a dollar who will buy two three 400,000 share positions you buy 400,000 shares of a stock uh down here at you know 10 point 10 cents 01 and you're you're putting such a small amount of money
in and you you know that you're risking well I got in here um the spread is is like this you're only risking a couple hundred bucks so all of a sudden that stock starts to move really fast it comes up here to a dollar A110 and you're going to put that sell order on the ask and so usually we'll end up seeing these massive sell orders on these low price stocks we'll talk about that a little bit more when we get into reading the tape but uh for that reason I found that the lower price
stocks and the stocks that start below a dollar tend to be a little bit tricky so in general I would say definitely under 20 and sweet spot for me is going to be between two and 20 so over $2 less than 20 That's The Sweet Spot all right now let's talk about price change this is criteria number two again all these criteria are also documented in my uh small account strategy PDF and the stock selection PDF which you guys can download with the links that are pinned at the top of the comments and in the
description so now let's look at instrument So based on percentage change what we're going to do we're going to scroll this down here and I'm going to show you that 99% of my profit right here comes from stocks that are up at least 10% if a stock is not does not have the potential to go up 10% from my entry I should not even trade it and so that means when I'm looking at a chart I'm pulling up the chart and I'm saying hm all right let's just pull up an example right here of um
of onco so I pull this up right here as it's starting to move higher and in this area we got some really nice trades and I was asking myself does this have the potential to go up 50 cents or a dollar a share right from 5 to 550 550 to 6 this definitely has a potential to go up 50 cents a share it's it's and it clearly did this is the type of stock that can move quickly uh but if we pulled up something like um I don't know Bank of America we'll just pull up
Bank of America for a second so Bank of America currently priced at $39 a share could this go up 10% there's not a chance this isn't this wouldn't move 10% I mean it would have to have incredible news it would have to go from here all the way up to here what's going to drive it to do that I mean like I said amazing absolutely incredible news but it's unlikely it doesn't happen and you know what that's okay because there's stocks in the market like this that are great for investors like Warren Buffett who don't
want billion dooll positions going up or down 10% or more in a single day but then there's Traders like you and I who need to grow small accounts and we're not going to do it trading Bank of America we need to trade the stuff that's moving the stuff that's volatile so this stock here CN that goes from 65 up to 90 up to a125 $130 that's that's more interesting now it's a little on the cheaper side of my price range um cut off but it's still worth trading uh perhaps uh I didn't trade it today
I I actually still thought it was a little too cheap but nonetheless that's the type of um rate of change and the type of potential that you want to see so number two we want stocks that are up 10% minimum not not only they're up 10% but have the potential to go another 10% number three is RV this stands for relative volume so the amount of volume a stock has is relative you might say oh there's a stock today that has a lot of volume and I might say oh okay a lot of volume what
what does that mean it's got a million shares of volume and I'd say well it's not really a lot of volume there's a lot of stocks today that probably well once again let's just pull up the scans and and take a peek how many shares of volume does CNE have 208 million shares of volume right onco has 32 million shares of volume so that's pretty good volume a million shares that doesn't sound like a lot of volume but it's all relative relative to what's normal for that individual stock so the term relative volume is comparing
today's volume relative to what's normal for that stock and so it's calculated as a ra IO so if the stock normally trades with 100,000 shares of volume and today it has 500,000 shares of volume it's got a ratio of five it's a relative volume of five it's five times higher than average if it's got a million shares of volume it's 10 times higher than average if it's got 10 million shares of volume it's a 100 times higher than average or whatever the case is it it just continues to go higher and so if we looked
at these stocks we'll actually see right here on the scanners we have a measurement a column called relative volume rate and this uh top stock has a relative volume rate of 16 the second one CNY has a relative volume rate of seven the one that I traded has a relative volume rate of 273 this one has 21 this one here has relative volume rate of 1,510 that means the volume today is so so so much higher than is average and normal for the stock in fact today you could see it's got over 5 million shares
of volume when yesterday it had only six th000 shares how does a stock go from having 6,000 shares of volume to 5 million shares of volume well number four news we like to see that these stocks have a catalyst so a news catalyst is what's driving the momentum the reason these stocks are going higher isn't for no reason at all I mean of course there are times where stocks go up because of Reddit and social media or because Warren Buffett takes a stake or something like that but generally the big movers they go up because
they have a news Catalyst they have a reason to move higher and so what we're looking for is that Catalyst now some Traders say if I could just be the first one to find breaking news I could make so much money and I'm going to say that's not true because I tried the same thing I thought the same thing I thought if I could just be the first one to get the breaking news I'd be rich and what I learned is that if you're the first person to get breaking news you don't know what to
do with it you don't know if the news is good or bad and some news sounds good but the market reacts poorly which is really confusing you might have a headline where the company says they've just signed a contract with the Department of Defense for $30 million a year and the stock plummets and you're like how is this possible this seems like a great headline but then you find out that a month ago they said they were in negotiation to sign a contract for $300 million O So signed at 30 is a lot less than
potential negotiation at 300 million right so it's context so unless you're able to put every news headline in context you won't be able to really know what to do and there's no way that you you would be able it's not a reasonable expectation that you could put every headline in context so this is what I learned what I realized was that being the first one to get breaking news is not helpful because I don't know what to do with it being the first one to see a stock squeezing up right now now that's something I
can work with and so that's how I came to develop these scanners right here this software that you're at I actually have a development team that's been working for me since 2017 building out this software and we it's called day trade Dash and we designed it to be the ultimate dashboard for active Traders so we've got thousands of traders who are using this software every single day and they're scanning the market using these stock scanners so what happens is the second a stock starts popping up it sends an audio alert and this Visual Alert right
here and it tells you all about the stock so this is the stock this is the time this is the ticker this is the price this is the amount of volume it has this is the float which we'll talk about in a second that's the relative volume so it's only 2.5 which is good but not not phenomenal it's up 30% on the day so all of a sudden I say all right let me take a look at this stock now in full disclosure it's 2 pm on a Friday so this is a great time to
be teaching a class it's not a great time to be trading because most companies don't put out great news on Friday afternoon only for it to get forgotten and you know be buried by Monday morning most companies put out great news early in the week Monday Tuesday Wednesday and then it slows down towards the end of the week so this as I check the news headline right here does not have a clear catalyst so why did it Spike up right here well it's got light volume it could have just been that some Trader out there
decided to buy a position or some short seller decided to sell a position and that was enough to to pop it up a little bit but probably not enough to sustain the move because there's no real uh Catalyst or reason for it to be pushing significantly higher so in this case it's fairly easy to do quick due diligence and say N I looked at it nah I don't think it's going to work so when we're talking about stock selection once we understand our five criteria the next step is performing this fundamental analysis right here which
we're going to get into in just a moment but first let's look at number five number five is the float the float is the number of shares available to trade and I prefer trading stocks with the float of under 20 million shares but lower is better 1 million share float no problem 2 million share flow that's fine 10 million good 15 18 19 million getting a little high above 20 nah probably not going to be as interesting now GameStop in 2021 had a 36 million share flip so it was a little higher but that was
fine and there are exceptions but generally under 20 million on a day-to-day basis is going to work better and if we look at the stock that I traded today onco the float on onco um it's actually 23 million shares so it's it's just a little bit higher but it's right at the cusp and so in this case it had some good momentum and it really was um it was pretty clean this morning didn't end up holding up for the rest of the day but it was clean yesterday and it was clean this morning as well
okay so the floats the number of shares available to trade I prefer to see a float of under 20 million shares and when it comes to relative volume by the way I like to see a minimum ratio of five so now I can do is I can take these five criteria right here I can program them into this stock scanner and let this scanner search the market for all of the stocks that meet these five criteria and then tell me the second of stock that meets these criteria starts popping up the second of stock that
meets that setup is up 5% or 10% now one of the things that I'll do is I will set the filters a little looser to cast a wider net the the reason I want to cast a wider net is because I want to see what's moving I'd like to catch kind of all the fish and throw some back and say nah I don't like that I don't like that then to just be sitting there with nothing in my filter at all wondering is the filter broken or is the market just really slow is there something
else happening somewhere I can't really tell so it's helpful to cast a slightly wider net and then manually filter from there there are some traders that have said well geez Ross why don't you just take this and you know add a few more criteria and try to just create a an algorithm that just trades this for you and what I have found is that while it's true that there is there are quantitative um trading firms that just trade based on highfrequency trading algorithms they are employing some of the smartest people in the world to try
to crack the code to basically print money from the stock market without having to do any work you just turn on press the button print money and end of the day you're done and it's a lot easier said than done to achieve that type of consistency in fact um a lot of them end up hiring successful traders who are able to help sort of Coach them on how to make it work correctly uh to the point that you you kind of might as well be trading I don't have the ability as one person to I
I can't compete against those hedge funds with trying to create that type of algorithm and generally those types of firms because they're blindly buying and selling based on the algorithm they're not going to trade the type of stocks that can go up or down 50% in one day it's just too much risk but when you're trading in a small account this is exactly what I think you want to be trading so I trade a strategy that has to be executed manually but I think is perfect for small accounts and for small account traders who like
me wouldn't be able to employ some you know MIT graduate to create some algorithm for trading the market uh now one thing that I said we're going to get into fundamental analysis but I wanted to touch on a couple of bonus criteria here so these are some of the bonus criteria for um for stock selection so number one a recent IPO recent IPOs recent reverse split a reverse split has the effect of reducing the number of shares available to trade what happens is these company's IPO so first we'll start with the IPO so recent IPOs
can be strong because a company begins trading on day one sometimes moves up a little bit and then usually moves down and then what often happens is you get this squeeze through new highs and you go to alltime highs and this has been true of almost every big IPO you'll at Big IPOs like Facebook um Alibaba Airbnb they have their initial pop they pull back and then they have this rip back up so I like trading if I see a stock that meets all of these criteria and I check and I see it's a recent
IPO I'm going to be like bonus that's even better if I see it's a recent reverse split a reverse split occurs when a company IPOs they go down they go up and then they start just selling off they go lower and lower and lower they get down to like 10 cents a share it's really bad and in order to maintain compliance with the exchange they actually can't be below a dollar a share you can't be a NASDAQ listed company and stay below a dollar a share they'll delist you to the OTC market which is where
most of the penny stocks are so what they'll do is they'll do a reverse stock split right here of 10 to one or let's say they do 20 to1 so they do 20 to1 the next day the stocks would be at $2 a share oops $2 a share and the number of shares available to trade when they ipoed let's say they sold 10 million shares they told sold 10 million shares on the IPO so if you owned all 10 million and it drops down to 10 cents a share you're sad the next day it goes
to $2 and you're like amazing and then you realize wait a second where did my 10 million shares go it says I only owe own 500,000 shares right the number of shares divided by the ratio so the price goes up the shares go down and so what this means is now this company has a float of 500,000 shares which means every time a company does a reverse split the float drops down which means it could go from 20 million to a million and all of a sudden now the stock fits within our stock selection criteria
specifically because of the recent reverse split so it's a stock we wouldn't have typically traded had they not done the split but it's just now coming into our range of having potential number two all time or number three alltime highs when a stock is at alltime highs we call it Blue Sky there's nothing above it no resistance above it that can be a particularly strong setup for continuation and strong upward momentum so recent IPOs recent reverse split um all-time highs these are three important ones yesterday volume less than 100,000 shares the interesting thing here is
if yesterday's volume was less than 100,000 shares then when today has big volume like a million shares you're immediately going to have super high relative volume and higher relative volume usually leads to bigger percentage moves so these are four bonus criteria there are some others but this is a good a good starting point all right so let's go back into the screen share here I'm going to pull up my slide deck and we're going to talk now about fundamental analysis so my workflow each day step one for my strategy is to find a stock that's
moving I do that easily by pulling up my scanners and looking at each one of the stocks that's on the scanners and asking myself how closely it meets my five criteria of stock selection Andor some of the bonus criteria generally each day my biggest winners come from the top three to four percentage gainers in the market so I already know just because these are the top five that I'm most likely to find success trading one of these so now I just have to figure out which one I like the most this one has a 71
million share float it's a little too high these ones are a little cheaper um so onco was sort of The Logical Choice here earlier especially when it was up more like 90% because at that point it was in the number one leading percentage Gainer spot so we have a stock let's say like onco that pops up on our scanners and then trying to figure out okay why is it that this stock is moving higher right what's the catalyst so I know it's important that we have a fundamental Catalyst and this gets into doing some due
diligence so I pull up the stock onco and this is where we have our news window right here so this news window is telling us basically what that news headline is so I can see right here this was um yesterday at 4:06 p.m. they had this headline that came out so this headline comes out we'll scroll down and it looks like this is an acquisition so this this filing a schedule 13d is an acquisition which means this company has reported a acquisition of 2.69 million shares which is that's that's a I mean it's a significant
number of shares to purchase on a stock that has a relatively small number of shares available to trade so so when we see something like that that tells us all right there's something that this company likes about this stock right it it's a vote of confidence a big vote of confidence now if this comp if this um was a well-known activist in investor like like Warren Buffett or something like that um then people would probably treat it with even more weight because it's sort of a little known investor um from Switzerland you know maybe take
it with a little bit of a grain of salt but nonetheless that was enough for that that news headline right there at 4 p.m. resulted in this immediately spiking up so we immediately went from $3 up to $445 and you just have to recognize that this company is just this firm has just taken a huge position in the company and so clearly we we sort of have to think what do they know that regular Traders don't know what what do they know that makes them think this is such a good value at this price and
we can only speculate but we have to assume they know something and so for that reason alone other Traders say well if they seem to know something they must know a lot more than I do so I'm going to go ahead and jump right into it and next thing you know the stock start squeezing up so there's a couple of different filings that I will pay attention to if we go over to this website called bam SEC we can actually pull up a stock like onco and we can look at all of the different filings
so when we're doing fundamental analysis typically I keep my my fundamental analysis fairly limited so fundamental analysis the reason I keep my fundamental analysis limited is because as an active day trader fundamentals matter in the long run but in the short run what drives the momentum typically is emotion the sentiment people get super excited they think this stock has a potential to make this massive move and they buy and they just think it's going to go higher and higher and higher so people just get so excited so during those periods of time when people are
really exuberant the price can become very disconnected from what some analysts might argue is the true value of the company this was true with GameStop there was a time in 200 uh 20 when Gamestop was generating $5 billion of Revenue but the entire company was only valued at $250 million you could have bought the entire company for $250 million and a company is doing $5 billion a year in Revenue now the problem is while it was doing $5 billion a year in Revenue uh it was actually losing money so the fact that it was losing
money was of course what gave it its uh relatively poor valuation but nonetheless some were arguing that it was worth based on Book value alone based on the value of the assets they held more than 250 million and in fact they were right so the way we can learn a little bit more about the financial condition of a company is through the art of fundamental analysis and that means actually reading through some of these uh corporate filings that these companies make as part of the regulatory requirements to be listed on the NASDAQ or the New
York Stock Exchange these companies have to report uh quarterly Financial results so they're being very transparent about displaying their balance sheet their profit loss and you can choose to read all of these in the statements so the statements that we look at are 10 uh 10 Q 10 Q 10K a uh the Q is for the quarterly the K is for the annual we do look at 13 G filings um 13 um D filings we look at um form form four filings and let's see um I guess those are probably oh and then we also
look at um shelf registrations S1 and um S3 filings so those are the ones that we look at most commonly so in the case of uh in the case of onco right here we had the filing that came out let's see it was um what was it uh the 13d form this was for the um the large stake that someone had taken the 13d filing and then here we can see our 10q so this is our latest quarterly earnings statement and what I typically do when I'm first pulling up a stock I don't go into
the filings at all I first pull up a stock onco and when I was first trading it this morning I'm trading it in this area I'm not looking up the filings I'm not pulling them up I'm going to show you how to do it because I think it's useful to know that information but I actually don't do it for most trades when I'm first trading a stock when I get to the point of pulling up the 10 um the 10 Q looking at the the quarterly filings I'm doing that because I'm starting to wonder is
this stock going to continue to move higher today it's already up 50% it's going to go 100 200 300% or is this a stock that has a risk of crashing and that's a question I have to ask once the stock gets really inflated and starts moving higher and higher in value if it gets to a certain point it's just like how much higher can this go before it rolls over and so when I look at the quarterly filings um you can read a lot about the companies in these filings but one of the things that
I look at is U their Consolidated balance sheet so the Consolidated balance sheet oops right here is going to tell us um how much cash they have on file uh basically what what is the amount of cash they have on off on hand so I look at Cash which in this case is $930,000 and then you can look at their total um current assets including prepaid expenses accounts receivable which is $ 100,000 and then prepaid expenses is $773,000 and inventory 160 so you've got about $2 million of assets right here and they do have some
other assets um in this area some prepaid expenses long term property and Equipment they're not going to be able to sell these um in order to You Know cover cash flow Goodwill and intangible assets these are big numbers that are often on a balance sheet but that can't really be easily converted into Cash uh that's sort of the Goodwill that the the brand name I'm not familiar with this brand so I'm not sure that is really fair to say has $36 million of Goodwill but anyways we can then look at the liabilities which is um
any loans that they have uh debts obligations that they have and of course the um assets and then the liabilities match out and then we look down at their revenue and the reason I look at their revenue is I ask myself how much money is this company making is it making a lot of money do they have a good net profit and in fact they have a net loss of 14.3 million for the three months that ended wait a second June 30th 2024 for the three months that ended June 30th 2023 they lost 6.8 million
and then th this is for the six-month period that ended they lost 25 million this is a lot of money to be losing what in the world is going on here so what I can tell you is that when I see that usually what I end up concluding is that all right this is um so we and we can read the statements here we're going to talk about um some risk factors so these forward-looking statements include are not limited to St uh um let's see where do we have so one of the things um here
with this um formally known as Bluewater biotech it's a commercial stage biotech company focused on Research development and commercialization of innovative solutions for men's health and oncology all right um historically the company's Focus was research and development the problem with companies that are primarily doing reset research and development is that they do not produce profit unless they have a drug that ends up um becoming very successful and so during the research and development phase investors are essentially financing the company continue to research by purchasing their stock and hoping that this company eventually comes out with
something that's fantastic and is able to use that to sell to a big pharmaceutical company and then all of a sudden the company has a real um chance at long-term profitability but unless they can license out some treatment or some drug or sell it they really don't stand a lot of a CH lot really any chance long term so this is very common so the result here is that we have a company that is spending a lot of money and only has $2 million on the balance sheet in cash uh and current assets so what
that means is that this is a company that is probably going to need to raise money how would a small company like this raise money they would raise money by selling more shares and this is a form of delusion if you've followed GameStop at all something that you might know is that GameStop as a company has been selling a lot of shares they've actually sold nearly $5 billion worth of shares it's kind of like an ability to just print money you say hey you want to buy a million shares for $5 that's five million bucks
you want to buy a million it's another 5 million bucks boom boom boom boom boom they raise $50 million and that's what a lot of these small companies do now Gam stop has done it on really a almost unprecedented scale they've sold $5 billion worth of stock and that's given them a huge um cash Supply that they can now use that cash Supply to do a lot of different things they could start becoming sort of the birkshire hathway where they start investing in different companies and there could be a point where GameStop makes more money
on that 5 billion well it's actually already happening because they're operating at a loss for their regular operations but the billion is generating interest so they're already making more money just in fact they would be more profitable company right now if they shut down everything they're currently doing and just earn the interest on their cash which is kind of crazy but with a smaller company like this they're not going to be able to sell5 billion worth of stock there's not enough people that would buy it but they could sell a couple million dollars worth of
stock now in order for a company to sell stock on the open market they have to have filed what's called a shelf registration uh through either the um initial prospectus or through the secondary offering to which puts all shareholders on notice that this is a company that intends to raise Capital so we have a shelf registration here for this company um and they're good for three years when they file a shelf and this will allow them to raise up to $100 million of stock right here so they could sell up to $100 million of stock
now since this stock is currently trading at $5 a share gosh to raise $100 million it to sell like 20 million shares given that the current float is 23 million to sell 20 million shares would dilute all of the existing shareholders you know by by double it would it doubles the float and so the problem with printing more shares is it decreases the value of every current share that's out there and this is this is a problem now this is sort of a business of confidence where if people continue to be confident in the future
of the company as Gamestop shareholders are they'll continue to buy the stock even though the company is actively selling to you uh with a lot of these smaller companies you know the market is not quite as favorable to continue to just sell sell sell shares at certain point people stop buying and if the stock goes below a dollar a share remember they'll no longer be in compliance with NASDAQ or NY New York Stock Exchange which would force the company to do a reverse stock split now companies and and this is one of them that did
a recent reverse stock split you could see right on the chart that s means they did recent reverse stock split and let's see if they've done any others um it doesn't look like they have but there are other companies um oh it's hard to think of one right off the top of my head but um there's other companies out there that have done uh look at oh my gosh look at the number of stock splits this one's done stock split stock split stock split stock split they keep having to do these stock splits to remain
in compliance and it's allowed the stock to almost just perpet drop it can just go lower and lower and lower in fact if you pull back the chart and look at the all-time highs every time the stock goes below a dollar they do a stock split which pushes the stock above a dollar and then it drops back down to a dollar and then they do a stock split and then it goes back to a dollar and then they do it again and again and again it almost seems like a cheat code to be able to
just perpetually allow your stock to keep dropping and in a sense it is uh it's a little bit of an unfair mechanism in the market um this is a particularly notorious stock it's it's almost Unthinkable when you look at um as we scroll up here it's showing that the price was1 billion dollar and that's because every time they do a split it sort of moves the chart backwards right so the way this works is if the stock start at 10 and then it goes down to 10 cents and they do a 20 to one stock
split it goes up to $2 but then they've got to multiply this by 20 so then they're like 10 * 20 is 200 so to keep the chart consistent it still looks like that it just the starting point goes Higher by that multiple so it's 200 then they do another you know let's say they'd have to do 100 to one split so then it goes up to 20,000 right now it's up at 20,000 and then they do another one and now it's 400,000 it's so so on and so forth and it just makes so the
price just keeps going looks like it goes Higher and Higher and what it essentially does is makes it so the stocks can just continue to go lower and lower now Regulators don't love this and they might change that at some point but uh in the interim we have the stock um here onco and so as I sat down this morning and took my first trades on it I wasn't worried about whether not it had a shelf what I knew in the first moments was that this stock met all five C criteria of stock selection it
had a catalyst which was the 13 uh defiling and it was moving higher so I was like this is a stock that I'm interested in there's some opportunity in this and over the course of the next five 10 minutes there's I I have a high degree of conviction that this is going to go higher but once we got a little further into the open or or into the trading day I started asking myself is this going to go to 78910 a share and that's when I said well I got to take a look at the
filings and then once I see their cash position and their profit loss statement that's where I start to get a little bit concerned and then I see this right here which came out just a couple days ago notice of delisting a notice of delisting and a failure to maintain um compliance with the stock exchange which was their why they had to do the reverse split so you know unfortunately this is going to be true with a lot of these small cap companies but what's also true is that um we can have these companies that have
been beaten up for a long time as this one was this was a stock that's been beaten up for a long time it's done a couple of reverse splits as you can see here here and here and then goes in one day from $3 to nearly $24 a share small account Trader loves a move like that this was absolutely phenomenal so we look at this on a f minute chart and we're going to get into technical analysis in a moment but we see something like this and it doesn't get much better than that basically this
stock started moving higher and it just kept going higher and higher and higher and higher from 5 to 6 7 to 8 to 9 to 10 to 15 to 20 to 23 I mean it's just unbelievable there was another one uh I think it was the next day prtg they made a equally impressive move uh we'll back this one up and usually I find that in trading uh when it rains it pours in both the good sense and the bad sense when one stock is hot we'll see dozens of others that are hot as well
but when things get cold it get sort of cold across the board so this one went from 4 to 20 and then pulls back to 10 and goes all the way back up to $24 a share just unbelievable momentum I mean we just love to see stuff like that but now long term prtg it's another biotech company right so the price is now after that big move it's been pulling back and I was wondering are we going to see news that the company has been selling shares and we we may see that we may not
in that particular case but it's certainly possible that we will so as an active day trader you could get away with doing zero fundament analysis if I'm going to be honest you really could uh if even if you just said oh there's news today there's a fresh Catalyst and that's and you didn't even read the Catalyst you would probably be fine but I think you'll definitely be better off if you can understand some of the basics of fundamental analysis and understand how this relationship of Supply demand works and why some of these companies are so
inclined to sell shares onto the open market because as they sell these shares through these offerings it can just create a tremendous amount of selling and we certainly saw that with GameStop so it's good to be able to understand it so now if we jump back over to our slide deck here um I we've talked now about fundamental analysis and I want to get into technical analysis U understanding stock selection was a really big one and now that you guys know that I think you're in a really good spot because stock selection is what I
would call your first level of risk management I mean well your first level is to train a simulator and then the second thing is to choose the strongest stocks each day as long as you're choosing strong stocks you're going to be doing a lot better than the majority of Traders out there who are trading the wrong stocks understanding fun fundamental analysis important but to a lesser extent and now technical analysis is very important so we're going to spend some time going over technical analysis and that's going to take us right into entry indicators and exit
indicators so when it comes to technical analysis what active Traders use are Candlestick charts and that's what you've been seeing right here these are Candlestick charts which the Candlestick chart itself was created in Japan uh actually hundreds of years ago it was created for uh tracking the price changes of rice Futures and when you look at these charts um for beginner Traders it could be a little bit confusing but the way it works is that each one of these charts and there's four of them here represent different periods of time this is a 10-second chart
here a one minute chart here a five minute chart here and a daily chart here and so each one of the candles represents the amount of time for that chart so if this is a 10-second chart you can see I could choose any different duration of time then every candle here is for 10 seconds of time so every 10 seconds a new candle will open now this isn't a stock that's moving a whole lot right now but if we looked at Apple or the S&P 500 or something like that where it's actively moving you'll see
that these candles are constantly opening and closing so each one of these Candlestick shapes represents 10 seconds of time on the 10sec chart on the one minute chart each Candlestick represents one minute of time on the five minute chart each Candlestick represents 5 minutes of time and on the daily chart each candle represents one day of time the anatomy of a Candlestick and this is going to be um now technical analysis is a Candlestick has four pieces of information the open the close the high and the low so open close high and low we always
connect the body of the open and the close and we draw a line to the top and the bottom of the high and the low and so that creates a candle now in this case this would actually be a green candle where the price moved up and we know that because it's we color it green and the open is at the bottom and the close close is at the top in the case of a red candle the open is at the top the close is at the bottom right here oops make that level right there
and then the high and the low are the same so we call the center the body of a candle so we've got the body and then these are the candle wicks right up here so those are the Wicks just like a real candle you've got an upper candle wick and and then this candle has a lower candle it's Candle that burns at both both ends as it turns out so this is the open that's the close that's the low and that's the high now this is the basis of the language of the financial markets and
what I'll tell you is that what I'm going to teach are the building blocks of reading this language just like learning to read the English language or any language for that matter first we're going to start with the alphabet so there are several key alphabet letters so to speak in the language of learning how to read candlesticks and so if we talk about these um individual Candlestick shapes that make up the alphabet I'm going to draw them for you and you're going to learn what they mean so this is our first letter so to speak
this is called a longbody candle it's a big green candle right here and this is a candle that communicates a message the open is at the bottom the Clos is at the top it didn't make a high it closed at the High and it opened at the low this is a very strong plus plus plus very bullish candle bullish means strong to the buy side then we have the exact opposite which is a red candle where it opened at the top and went all the way down this is a very negative candle the most negative
candle you could possibly get and this is a longbody candle then we have um sort of small Body candles like this which are less decisive right this is showing some some weakness this is showing some strength but clearly the sentiment is much stronger on a large candle now the next candle that I want to show you is called a candle of indecision it looks like that now it could be red or it could be green because the open and the Clos are usually more or less at the same price but this is indecisive because the
price moves up it moves down and then it closes the same place it opened this is another variation of that same candle it's called a spinning top this one was called a dogee by the way a dogee and a spinning top they're both showing a degree of indecisiveness this is called a long legged dogee it's the same as a dogee except the upper and lower candle wicks are larger this is called a gravestone dogee this is called a dragonfly dogee and this candle here is called a hanging man do a couple more go to this
side this so we did the man this candle here is called a shooting star so let me give you some context for some of these candles so let's say the price is moving higher longbody candle longbody candle what does this communicate strong sentiment right people are very bullish small body candle small body candle what's happening the trend is getting exhausted dogee there's indecision long body red candle they're selling small body red candle indecision dogee indecision candle moving back up now the trend is reversing long body candle longbody candle and then once again Trend gets exhausted
the candles get smaller and a dogee so we often find that dois are marking tops and bottoms as we have indecision in the trading and while a doe communicates indecision let's imagine that we substitute this candle we take the dogee out and let's imagine instead we put in a a shooting star like this what would that communicate that communicates a message even stronger than a dogee it shows that not only is there indecision the reversal has already begun because the candle's gone red the stock squeezed up and then dropped back down when we see a
stock that's in an uptrend and we see a large topping tail like this these topping tails are bearish they're weak they showed that while the price squeezed up sellers pulled it back down on the flip side when we see a bottoming tail like this this is actually strength because it shows the price sold off but buyers bought it back up what if in fact instead there we substitute that candle out for a hanging man right down here in this case at the bottom of a trend we would actually call this a hammer we would say
that this candle is hammering out the base if we saw that same candle at the top of an uptrend that's actually where we would call it a hang in man it shows a little bit of weakness up here because that bearish sort of that drop indicates some weakness now they ask the price move back up but it's still not great to see that bottoming tail we'd rather not see it at all so a little bit of weakness up there but down here that communicates a little bit of a different message so we're able to read
sentiment based on the shape of the candle and so what we end up having are multi Candlestick patterns where all of these candles begin telling a story in this case let's say right here it's 7 a.m. boom and all of a sudden out of nowhere the stock was going sideways and then boom spikes up 10% so the second it spikes up 10% we're going to see it hitting our scanners right it's going to be on our high of day momentum scanner as the stock is going up 10% especially if this stock of course already meets
our five criteria of stock selection and again if you guys haven't already downloaded the PDF resources those are pinned on the top of the comments and Linked In the description so you download all of those and that's going to put documentation behind everything that I'm sharing with you so far here today so we first get that Spike up it hits the scanners we're then pulling up the chart and we're saying all right this stock is moving higher I like it first huge green candle really bullish sentiment another big green candle wow sentiment so strong another
green candle where should I buy can I buy it in here gosh it I can't I can't buy it in here because it's too extended it's just going higher and higher and high higher so it ends up topping out here and then here and then we finally get that that reversal now let's say this reversal is just that small dogey right here it pulls back we have a little bit of profit taking people sell who maybe were in earlier and then as it pulls back right here this is the area where I get really excited
the reason is what I like to do is I like to buy the first pullback on a strong stock when you have a stock that has breaking news so this is a stock that's got breaking news that came out at 7: a.m. let's say it's a biotech company they've got uh clinical trials that were phenomenal really good clinical trials all right so now the stock is squeezing up that first pullback is going to get bought up that first pullback gets bought up because there's so many other traders that see this opportunity to buy a strong
stock but you don't want to just buy a strong stock at the very top you've got to be able to manage risk and so the way we manage risk is by waiting for that pullback and as it pulls back we see how low does it go now let's say for instance this pulls back and it just keeps going lower we just have more and more red candles comes all the way back down right well in that case we don't take a trade and it's easy to say that because of course I just drew that but
there's no entry indicator so what is the entry indicator that we look for well what I'm looking for and I kind of think of this as a tide that's coming in so we get a first wave up and then it pulls back and then the next wave is going to push push even higher and it's going to pull back and then the next one's going to push even higher than that and so I want to ride the momentum momentum trading means looking for a trend and jumping on that Trend as early as possible so in
this case what I'm going to look for is the first indicator that this trend which has been going up but pulling back is going to reverse for the next leg higher so how would I know it's going to reverse well I could look at some of these candles that I'm familiar with and I could ask which of these indicate there's some buying of course any candle with a bottoming tail would indicate that although there was selling the buyers came back in right and the second thing is if we have a pattern of four or five
green candles in a row and then three or four red candles the first candle that simply closes green is probably significant the only problem with that is if you wait for that candle to close green what if it goes like this shoot now you're getting in with back up here that's too high so what I actually like to do is I look at each of these candles as they're coming down I wait to see if there's one that has a little bottoming tail perhaps like this and then the next candle after that bottoming Tail as
soon as this next candle makes a new high right there all it has to do is actually make a new high which is breaking the high of that candle so let's say the high of that candle is $730 when this hits 730 and then I see orders in green going through on the the level two I'm buying right there at 730 and boom I'm looking for that squeeze all the way back to the highs so now my Max loss on this trade is the difference between my entry and the low of this pullback right here
so let's say the low of this pullback is 710 so now I'm risking 20 cents all right so how much should I stand to profit on this trade in order to justify the risk I would say I'd like to be able to double whatever I'm risking so I'd like my profit potential to be 40 cents now there are times where you'll see a chart like this and you look at it and you'll think well you know this is only let's say 7:35 I know that doesn't make sense based on the scale of chart but let's
just say h it's only 5 cents of profit I can't justify the risk and then you don't take the trade but if you look at this and and up here is you know $8 or something like that then you've got 70 cents and that's a trade I'm definitely going to take every single day now remember just because I see that awesome pattern doesn't mean I'm going to take the trade the stock has to meet my five criteria of stock selection if it doesn't doesn't matter how good the pattern is I cannot take the trade the
pattern is important but the quality of the stock is number one a quality stock now if we have an a quality stock then we of course would prefer to trade an a quality pattern and this is pretty much an a quality pattern there's there are some variations that could occur here that would make it a less than a quality pattern so let me show you um a couple of indicators that I use actually before we do that I'm going to jump back up onto the slide deck here and I'm actually going to pull up I'm
going to give you guys a little preview so um those of you who um have been interested in learning a little bit more about my strategy I'm actually going to give you a little preview straight from the warrior Pro curriculum so in my fulllength classes um I taught the first version of this class in uh 2 uh let's see it was uh 2014 was when I first taught this class and when I first built this slide deck it had 15 chapters and I think the slide deck was like I don't know it was like 15
slides long there was like one slide for each chapter uh it now is 1,700 plus slides long and this is only it's actually broken up into several slide text um but what I want to show you here is this one section that I think you're going to really enjoy so this is um part of chapter 8 momentum trading strategies and it's the long setup one part buying the first and second pullback so this is um that same pattern that I was just showing you here where we get the stock that squeezes up right here usually
it's on breaking news we get that first move higher pullback pullback first candle dips and then that first candle that makes a new high after that pullback is the entry so I'm going to jump through these here just for right now this is what that pattern looks like on an actual chart stock squeezes up then you get that pullback oops so squeezes up right here then you get the in this case two candles to pullback pullback Green candle first candle makes a new high that's your entry right there at 424 Max loss is 418 so
you're risking 6 cents a share on this 6 cents uh per per share and profit targets and moov back to the high which in this case went all the way back up towards 450 so about 25 cents of profit versus 6 cents of risk that's a 4 to1 profit to loss ratio so I'm going to animate this so you can see what it looks like the stock is squeezing Up In This Moment as it's squeezing up it's hitting our high day momentum scanner but we're not going to just Chase it we're not going to just
buy it up here we're going to wait for that pull back finally a red candle it's softening it's pulling back we've got that topping tail that shows us that it's a little bit bearish sellers are pushing it down we have another candle that goes a little bit lower right here another candle here that's green now a more aggressive Trader may buy as soon as this candle closes in the green a more conservative Trader who's a beginner is going to wait to see what the next candle does as soon as that candle the following one breaks
the high of this candle that's where I'm a buyer so I'd be getting in right about at this line and my Max loss is low of this pullback and my profit Target is high of day and you know what's kind of remarkable is that this is a setup that I've been trading for more than a decade I mean I trade it like every single day and You' think it it would oh would it just stop working at a certain point but the fact is this pattern represents the psychology of what so many Traders are thinking
wow this stock has really strong news what happens immediately the stock starts squeezing up as people buy it and then you have a little bit of profit taking as people are like well I got to sell I got to take a little profit and then you have this next round of Traders like myself who jump in to buy the first pullback on a stock that is strong that has news the biggest challenge beginner Traders have with trading this strategy is being able to differentiate is this the type of stock that has the potential to go
up 20 30% and continue higher or is just going to stall out and that requires you to really understand those five criteria of stock selection and some of the bonus criteria that give the stock the potential to do something absolutely exceptional like go up 500 600 or 700% in one day so now I want to show you a um a live trade I'm going to give you I'm going to show a clip here of an actual live trading Archive of me trading this exact pattern so when I pull up this live trading archive um you're
going to notice a couple of things number one you're going to see my actual trading software which I haven't yet introduced to you but I'm going to walk you through um right now and you're also going to see how I am executing the trade and where exactly the entry indicator and the exit indicator so just um in brief here if we jump if we pull up our slide deck uh in this section right here we're transition iing from just technical analysis a little bit into our entry indicators and our exit indicators and I also want
to share with you uh some of the technical indicators that I'm using as well but we're going to start uh we'll start here with with just this recording okay so now let's watch this um this little live trading archive so we currently have a stock just to get us oriented I'll just press pause for a second we currently have a stock that is up 85% on the day you can see that this says 85% right here and I can see the stock uh right down here says 90% uh this is on our scanners so the
stock is on the scanners it's actually our second leading percentage gainer in the entire market so as typical I'm usually making my money on one of the top five percentage gainers this one is interesting because the float is about 326,000 shares that is a very very low float it's already got over a million shares of volume it has a catalyst and it's moving higher so we've already we found the stock on our scanners and um I've already taken a few trades on it but this is one particularly interesting trade so the stock had its first
move up its first pullback right here now it's second leg up and it's on its second pullback right here I like buying the first pullback and I like buying the second pullback and usually after the second pullback I start to get a little more cautious because I don't want to chase it too much higher so I like the first and I like the second pullback all right so I just got in here at five uh 51 and the reason that I bought on this was because this stock is the number one leading percentage Gainer and
meet all my criteria for having potential plus it has bonus criteria of a somewhat recent reverse split as we can see right here and a ridiculously low float of 326,000 shares which means the supply is very low this is a stock that's already exhibiting high demand in fact the relative volume is over 1,600 times higher than normal so this is a stock that very closely meets like a quality setup so I'm being more aggressive so as it dipped down here we had that little bottoming tail and it immediately bounced back up on that green candle
this is on the 10-second chart now a 10-second chart every minute has six 10-second candles so by the time this candle goes green I most likely already have an early indicator to buy on the 10-second time frame so I'm using this fast time frame right here to give me that sort of early jump at what's moving now those of you guys who are familiar when we built out this software we added the 10-second chart because I thought it was important for helping active Traders spot these reversal indicators a little bit earlier so bottoming tail and
the candle going green and then what I see is that burst of green on the time and sales this time and sales window right here is actually showing a report of every individual transaction that goes through the market on this particular stock and this right here is the market for this stock the buyers are on the left they're sitting on the bid and the sellers are on the right sitting on the ask on the bid we can see the number of shares someone wants to buy and you always add two zeros so if it says
one that really means 100 if it says eight that really means 800 and we see that there's a spread of currently 9 cents between 750 and 760 so let's go ahead and press play so we're dipping down to 743 on the bid 750 on the ask so I'm currently read on this trade for a moment I'm watching for that first candle to make a new high 44 on the bid 54 on the bid 50 60 on the ask a little burst of green there you see those orders that went through in green that's what we
like to see that tells us other Traders are bullish on this 69 on the ask 67 on the ask and as an active Trader what my eye is primarily focused on is right here at the current price so on that trade I got in and I got back out basically break even I felt like maybe I was a little early so when I got in I was expecting immediately we would go back to the high which was about $8 so the fact that we didn't go up immediately I said you know what I better just
get out and that's one of the things that's nice about trading is you can get in and then you can jump right back out so I got in and I got back out now the stock is coming back down here to this same level of support right around 734 I I make the chart a little bit bigger so I can read it better and what I'm looking for here is still that first candle to make a new high so now I've actually added back at the same exact price but here's what's really fascinating look at
how fast this has gone all the way back to $8 so if you look at this trade this is in in just an instant it went all the way back to eight I think the problem on this trade for me was that on my first trade I tried to anticipate what was going to happen by getting in a little early and I had the right idea but I was a little early this didn't work until that first candle made a new high but look what happens the second that candle made the new high which is
so the high that previous candle looks like is about 73 773 so 772 right now and then watch immediately it goes to 85 and then immediately it's at 88 and then next thing you know we're coming up to 90 99 $8 now we're breaking eight and I'm in with full position right here 2500 shares I'm up over 50 cents a share that's a solid it's a solid move on an $8 stock it's now up 104% on the day we're coming up to 8.27 now I'm up 75 cents a share that is nearly 10% in this
is a one minute candle this stock is going up 10% in 1 minute that is an incredible move that's exactly what we like to see and I'm going to tell you if you do that even just once a day if this is the only setup you trade and you only take this pullback setup you only see one trade a day that's a quality once you are well trained to trade this on the right type of stocks you should be able to maintain good accuracy the question really is whether or not you'll have the discipline to
follow the rules and to be patient because what if there's a day where you don't have that a equality setup or what if there's a day where you have some patterns on charts but you don't have that a quality stock that meets five criteria of stock selection the right answer is it's a no trade day but the beginner Trader will typically trade anyways and go red thus hurting their accuracy their profit loss ratio and naturally their self-confidence and that can create this downward spiral so one of the things that I have all of our uh
beginner Traders do or I encourage them all to do at least is to do the one trade per day challenge for a full month and I'm I'm of course doing this right now as part of my small account challenge so each day I'm like okay guys this is my one trade of the day for the small account and then the rest of the day I trade in my regular account but during that uh that one trade a day challenge the goal is to see if you can maintain 60% accuracy at a minimum right 60% 70%
is Target you're going to have losses but can you be as accurate as possible can you be 60 75% you know 70% or higher accuracy because if you can then you're going to do you're going to do well that's what's really important so anyways this stock ends up going up here to 37 38 and then naturally it's probably going to be ready for another pullback look it just went up 10% in one candle so then this is where maybe it pushes a little bit higher and then we'd say okay we're going to wait for the
next pullback in this case if this held over $8 I might consider adding back because that's a really nice move and it's clearly showing it has the potential to squeeze up 10% maybe it could go a little higher but I really prefer to trade the first and the second pullbacks so now I'm going to back out of this chart for a second or this screen and I want to walk you through a couple of different indicators that I'm looking at then I'm going to also go back and explain those exit indicators that um that prompted
me to sell that position so on all of my charts you'll notice that they really are uh fairly simple I'm going to zoom into the one minute chart here I've seen people with charts that are very busy they've got a lot of things going on it's really hard to read and you can add a lot of technical indicators but technical indicators um they are helpful but if you add too many they're going to be um counterproductive it's actually going to be a problem because you're going to get analysis paralysis so fewer in a lot of
cases is better and so I'm going to share with you the indicators that I'm using in my trading every single day so my top technical indicators all right number one is moving averages so a moving average takes the average price so let's say we have a stock and it's we're going to add a moving average and we're going to take over the last nine candles we're going to take the average price of the stock so if this stock has been squeezing up over the last nine candles then we add all nine candles together we divide
them by nine the period that we're analyzing and that is going to be our average our average over that period so what I'm using is the nine exponential moving average the 20 EMA and the 200 EMA these are the three moving averages that I'm using on all charts the 9 the 20 and the 200 these are very well-respected indicators that most Traders use and these help us understand potential areas of support uh I I found that on the five minute and on the daily chart these are especially valid but on the one minute they're valid
as well so look at this for instance this is an example where the stock came right up to that moving average right there and then Fades back down so the nine is in Gray the blue is the 20 is in blue and the 200 is in purple so those are my three moving averages that are on all of my charts when the price is above it the moving averages form as support when the price is below it the moving averages form as resistance so I primarily trade when a stock is above these moving averages at
least on the intraday chart uh on the the one minute and the five minute the second is the volume weighted average price which is uh the acronym is vwap so the volume weighted average price is this is very similar to a moving average it factors in the average price over the course of the day but it also factors in the amount of volume that takes place at each of those prices and so the volume weighted average price is this orange technical indicator that I have on my charts right here and this is actually telling us
the true equilibrium point of this stock over the course of the day this is its average price so if it's below then it's below average if it's above it's below it's above average and what we have found is that most stocks when they're below the vwap they struggle to get back up above it it's resistance so if they can get back above and they can hold above it then the vwap becomes support for a move higher so it's very common that when a stock is trading around the vwap we pay close attention a dip off
the vwap can be a nice buying opportunity but if it breaks the vwap and it can't get above it then that's resistance usually for the rest of the day so in this case we have those three uh the the the three moving averages the 9 the 20 the 200 and then the volume weighted average price so those are plotted as the technical indicator lines on my charts now the next indicator that I use number three are volume bars so volume bars just simply communicate the amount of volume that takes place during each one of these
Candlestick periods and I have my volume bars on a separate pane down here some people will overlay it I don't like to Overlay it because I find that it it doesn't look good to do that I want to be able to see the amount of volume visually on each candle and so one of the things that's important is that when a stock is moving up we like to see that it has high volume on the buying candles so high volume buying and then we'd rather see light volume selling this is perfect right here light volume
selling on these candles and then boom first candle makes a new high and look at that surge up and I traded this right here this morning again like I said this is the same exact setup that I've been trading for forever we get that squeeze up we get the pullback first candle makes a new high boom there we go that's the move and this goes from 540 all the way up to 634 that's a fantastic trade so volume is very important and what we like to be able to see is that the profile of the
volume is showing that there's more buyers than there are sellers now I'm going to show you um a couple of examples here this is that really clean setup where we've got two four five green candles two red candles lighter volume on the second red candle and then buying comes back in and it surges higher I'm going to take that setup every day all day long when I see it here's another one this one's a little different because the stock was sort of going sideways and then it starts to pull away after it pulls away quickly
we get that first pull back then it surges higher light volume pullback surging higher we love that here's another one right here so squeezing up and then light volume pullback surging higher light volume pullback surging higher and the volume picks up big time on that one now this one I want you to tell me what you think of so here you've got two green candles and then it pulls back where's the entry well we never had a first candle that made a new high it just sold off more and more and more no one really
wanted to buy it why the selling volume was substantially higher than the buying volume it popped up on very light volume and then immediately High volume selling so that's no good and it's and even though this stock has news it still doesn't work now I'll tell you that the float on this stock is 34 million shares so in that case that's a that's a possible reason that failed but there'll be other times where we see a stock that's got the right float this one's 1.45 million shares but it just doesn't work light volume on the
buying candles heavy selling as soon as it pops up so in that case once again there is no entry the entry is that first candle to make a new high so even if you weren't using level two which is what we've got right here this is the depth of the market that's showing all the quotes and is showing the orders going through the the market in real time even if you weren't using this if you were just relying on the first candle to make a new high that would be fine as long as you're trading
the right quality setups now I think using level two is important it's like it's going to give you more data and that data is going to make you a faster Trader and probably a more accurate Trader but first and foremost is the chart in well first is the stock selection but then is chart so if you don't have the right pattern there's no trade there when I try to get fancy and I try to anticipate by getting in early I feel like a lot of those trades I end up missing on there are some that
work and I'm like oh nice good good good early entry but it's riskier it's just better if I wait for that first candle to actually make a new high so we get that pullback first candle makes a new high so I know the high of that previous candle the way I know it is because when I'm pulling up my charts I can actually Mouse over right here and this area right up here is showing me the open the close the high and the low so open high low close so as I'm mousing over candles I'm
looking at what it's saying up there sorry I'll just make that full screen again so I'm looking at what it's saying up there see how those numbers are changing as I move candles so on the one minute chart we were looking at that we get the high of this candle so I'm saying oh the high of this candle right here is 541 right so I look right up there at that that price and I put my candle over here and I say oh that high is 541 so boom now I know as soon as this
candle breaks over 541 I'm a buyer as soon as I see that first candle making new high I'm in now if I pull up the level two and I see at 540 a bunch of buying going through then I can already see other Traders are jumping in this early because they like the setup and then that's where I'm going to say all right I'm going to jump in this too getting in one penny early is not really a big deal but getting in 15 20 cents early could be a little riskier you might get a
false false confirmation so volume is very important now the next indicator that I'm using is right down here and this indicator is called the macd the macd is an acronym just like vwap this is an acronym that stands for macd moving average convergence Divergence indicator so this is actually measuring these moving averages right here and telling us the rate that they're separating because the price is mov mov quickly so the way these moving averages work is if you have a stock that is moving up really quickly let's say you have a stock that's moving up
really quickly here your average price for the last nine candles um here let's say this is nine and this is 20 your average price for the last nine candles is going to be higher that's a higher average price than an average that includes all 20 candles back here right so let's say the average here let's say this is a stock that went from uh 10 to 20 so let's say your 9 EMA your 9 EMA is going to be maybe at around 17 because it's factoring in the price just from the last nine candles whereas
your 20 EMA might be more like 15 right it's pulling back all the way to here and your 200 EMA well geez if this started at $5 a share your 200 EMA might be down around $7 that might be even lower and so what we notice is is that as a stock is moving up quickly the difference between the 9 and the 20 the price it starts to move apart and as that they diverge this indicator separates so as your 9 EMA is pulling away it's moving away from the average of this indicator and what
I have found is that consistently my best trades are on the first leg of a move up before these moving averages converge once they start coming back together here we go into a period of sideways consolidation and that's usually where it gets choppy so I like to do as much of my trading as I can on the front side of the move when the macd is open before it crosses over and it's easy as a beginner Trader to get a little overwhelmed think wow there's a lot of things to follow along with here and that's
one of the reasons I would say that it's so important to have a mentor and to trade with someone where you can be listening to them in real time while they're trading so every single day while I'm trading I'm streaming at Warrior trading and I'm providing my cont commentary so I'm saying okay guys I like this setup these are the reasons why or someone's saying hey Ross I like it right here do you think I should buy and I'll say well the way I look at this is I look at this and I'm seeing reasons
not to buy I see the macd is crossed over I'm seeing the volume is declining it looks choppy to me so of course you should do as you'd like if you if it fits within your strategy but if you're asking me if it fits within my strategy right now the answer is no ma is negative on the trade this is not set up so I try to be very clear about when I like a stock when when it meets my criteria and when nah it's too risky I got to say no of course you do
as you'd like but if you're trying to learn my strategy it makes a whole lot of sense to be able to listen to me every single day while I'm trading so you can be practicing trading in a simulated environment and you can be practicing getting in getting out does this make sense am I understanding the entries am I starting to kind of really like internalize all the things I have to check okay I've checked the five criteria for stock selection I've done my brief due diligence to check the news Catalyst I didn't have to worry
about doing any more fundamental analysis because it's the first leg of the move and we've got news now technical analysis what's the volume profile how's the macd what's the position of the moving averages so it's helpful to have that kind of you know and and even for me it's really helpful to be part of a community because I have so many of our members who will throw me ideas and say hey Ross take a look at this and I might have missed something so it's helpful to have more eyes on the market and there's just
going to be more when you're trading as part of a community of other Traders than when you're trading all by yourself so so let's see so then that was the last indicator um the moving average convergence Divergence indicator that I'm using in my trading so the last one is macd so moving averages vwap volume bars and macd now there are some traders who use RSI I mean there's literally dozens in fact there's hundreds and hundreds of indicators and thousands probably Infinite combination of indicators you could use but I'm a big advocate of keeping it simple
don't over complicate it keep it simple that's really the best thing you can do one of the things I think is important is recognizing that technical analysis is a universal language of the financial Market every other Trader out there who has some degree of experience is learning how to read these charts in basically the same way so they learn the language and what ends up happening is that inside these charts there are dozens of buy signals and cell signals you may not see them yet because your eye has not been trained just like I would
look at you know ancient hieroglyphics and not know what they mean but these Candlestick shapes they have meaning behind them and once you learn to read the meaning that is empowering and that becomes profitability so if we pull back up this um this live trading archive just for a second one of the things I wanted to highlight are my uh not just my entry indicators but my exit indicators so if my entry indicator is the first candle making a new high after a pullback that's that's reasonable enough so so then where's my exit indicator so
this is the way I think about it if I take a trade I know how much I'm risking when I get in and I can control how much I'm going to risk because I will sell if it goes down to the price where I'm saying that's my Max loss so I'll sell I'll bail out and I do that by manually pressing the buy and the sell button I don't have any addition order confirmations I can click buy I can click sell and one of the things I can also do is I can actually um harness
my keyboard to set up um hot keys where pressing shift one or shift two instantly is getting me in and out of the market I can show you how that works um in just a second but um but first when I'm looking for an exit indicator the way I think about it is if I get into a trade and well what do I want to see Let me let me throw it to you as a question what what do we want to see when we get into a trade we want to see the stock goes
up immediately right that's what we would love to see we get in and boom it immediately goes up that means we had the perfect timing we had the exact right idea the right timing probably all the other Traders out there were seeing the same thing so we're really dialed in on this stock that's good so then the inverse is what we don't want to see is we don't want to get in a stock and see it immediately drop right so this is sometimes helpful to sort of um reverse it so this is going to be
the negative of what we don't want to see this is the positive of what we what we do want to see so if we get in a trade we want to see price goes up and I would say within 60 seconds I'm a I'm a day trader so I want to see it go up quickly and a bad thing would be if price um immediately drops like just goes down instantly um I also wouldn't want to see big sellers big sellers on the level two so when I pull up the level two I can see
the size of the sell orders so right now I see a 200 share sell order and then there's a 2,000 share sell order at 760 those aren't big sell orders but if I saw a 50,000 share sell order yeah that would be pretty big that would be concerning so right now when I'm getting in I don't see any big sell orders but I do take profit right there and I took profit right there not because I saw a big sell order but simply be because I had to Che my first profit Target which is it
broke through the high of day and squeezed through the whole dollar of eight something that's really interesting um so we want to see uh no big sellers on the level two um we don't want to see um I'll say red on the tape red on tape red uh candle so we don't want to be in while a candle goes red so we want to see here uh green candles right um green on the tape which is the the time in sales and no big sellers but we'd be okay with big buyers big buyers are a
plus so that's okay all right so that's kind of what we're thinking when we first get in and then one of the things that we know is that most stocks actually trade with quite quite a good deal of respect for half dollars and whole dollars and this is kind of interesting the way this works is when a stock first starts moving up a lot of people will put out profit targets at just kind of like a logical area someone will say oh I'm in the stock at two bucks you know what I'll just throw a
profit Target order at 250 or someone say I'll just put a profit Target order out at three so the stock starts at $2 this is$ 250 this is three this is 350 this is four and what you would notice is that most of these stocks as the price moves up there's going to be a whole cluster of sell orders right around 250 and another cluster of orders around three another cluster of orders around 350 and another cluster of orders around four right around these half dollars and whole dollars this is just there's psychological areas of
resistance it's just where people logically put in order so as the price first starts moving up here big green candle breaking news big green candle and then we hit resistance resistance at $250 the half doll and This Is Us usually where we see our first pullback now if you remember in that live trading example that archive we were trading at the half dollar of 750 so we hit 750 we pulled back so in this case we hit 250 we pull back and then we break through and if we break through we squeeze up to the
next level like this so now we're up to three we pull back here for a moment we dip down and then we pop back up but what sometimes happens is we pop through and then immediately we dip back down and now what's happening is we're testing to see whether or not there's enough buyers to prove that we can hold three if there's more sellers we'll drop back down below three but if we test and we hold then we base out for another move higher so sometimes a stock is super strong and it just blows right
through but very common that we break and we pull back so if I get in this for this break right down here like at you know 275 in this example it goes up to 310 I'm going to take some off the table because I know it's probably going to come back in test three so I'm going to capture as much profit as I can on that first cross through the half dollar and the whole dollar especially if that means I'm booking profit and I'm I'm hitting my profit Target on the trade and that's exactly what
happened on this trade right here so on this trade here it ends up breaking through it it ends up going very nicely up to 775 up to 788 up to 790 breaking through eight as it Taps eight notice here there's a little bit of resistance there there's a couple more more sellers at eight than there were at any of the other prices a little bit of resistance so a little bit of Moment of Truth is it going to break eight and then immediately goes and it's like all right take that profit off the table we're
breaking eight because what we know is that we it's very possible that we'll come back down to eight so now we're back to 8813 815 on the bid 804 we're back to 8 so now we're retesting 8 and I already took some profit at like 825 826 823 so I took that extra 23 cents of profit we dip back down do we hold eight now right now it's holding but then then it goes all the way to 89 by 90 so this is a really good example where now it's below the whole dollar now it's
back above it so it's struggling a little bit there we call that straddling a half dollar a whole dollar and now it's got to kind of it's going to now have to do another pullback and that's fine but I might as well just take my profit get out and then I can always get back in So when it comes to exit indicators when I get in if the price is just squeezing higher if I don't see any obvious exit indicator I'm going to hold as long as I can I don't want to sell if I
don't have to I mean i' I'd rather stay in the position but if it starts to kind of you know stall out or it breaks through a level like the half dollar whole dollar then I'm going to say to myself I better book some profit on this thing it's probably it probably makes sense now I have a couple other um you know kind of interesting live trading archives here I'm not going to go through all of them I I I do this when we're in our full length classes but um but I think for right
now I'll let's let's jump on to uh the next section so let's see um and again we're trying to condense 27 years of trading knowledge here into um this comprehensive but relatively um concise class so we've gone through this first section here and we've covered entry indicators and exit indicators let's talk now a little bit about risk management so we know without a doubt that trading is risky I mean I think it goes without saying it is a high-risk activity and there are some people that don't have the appetite for risk and just get too
Paralyzed by the thought of losing money that they can't even trade I think that um for a lot of Traders I'm actually very risk averse I I don't like taking risk and what's kind of funny about that is I'm an active Trader but for me I find that it's a lot easier to predict what a stock is going to do over the next 5 minutes or 10 minutes then over the next five or 10 days and so the way I manage my risk is by holding stocks for short periods of time I get in on
a pullback the first candle to make a new high and I take profit as soon as we get that little dip and so by being very precise about getting in and getting out I feel like I'm reducing my risk but active trading is risky and it's risky for the primary reason that most beginner Traders jump into the market without a proven strategy and they're trading with real money as they get started so the number one biggest step you can take to mitigate your risk is trade in a simulated environment instead of putting real money on
the line so at Warrior trading for our members we offer a trading simulator that actually is very similar to the platform that I'm using every single day with real money and so it allows you to trade the market real-time data side by side with me as you'd like without putting real money at risk which I think is important but if you use um thinker swim or maybe a different uh trading platform some of those Brokers do offer simulators that you could use there as well so step one for mitigating risk risk is to trade in
a simulator what is step two I think you already know so this is a little bit of a pop quiz so risk management so so number one is Sim and number two is stock selection by choosing the strongest stocks each day you are greatly reducing your risk number three is avoid over trading which is why I always put beginner Traders on the one trade per day challenge now it's worth noting that as a beginner when you first get started you don't want to just take one trade a day you want to get as much experience
as you can right you you really want to you want to trade everything because it's an opportunity to get better at reading charts to get better at reading the language of technical analysis to get better at reading level two the time in sales so you want to trade a lot but then you get to the point where you say all right I've been trading in the simulator for a while and I'm actually making some money I'm thinking about going live how do I transition and the way to transition is to start in the simulator with
the one day per day challenge so you try to just do 10 days in the Sim one trade a day and test yourself to see over these 10 days am I number one net profitable and number two what's my accuracy and number three what's my profit to loss ratio so those are the three core components that we look at so avoid overtrading and doing the one trade per day challenge and then analyzing profit loss ratio which is all your average losers compared to all your average winners your accuracy right here so profit loss ratio accuracy
and um net profit if all three of these are po well if your net profit is positive that's the most important and then as long as your accuracy is above 60% and your profit loss ratio is better than one: one then I would say at that point you could advance to trading with real money but only trade with super small size for the next 10 days and repeat this one trade per day challenge with real money but with like either 10 shares or 100 shares whatever is an amount of money that if you lose you
feel nothing you don't even care so if that means taking $20 of risk on every trade take $20 a risk right it's if it's $2 a risk start with $2 a risk whatever your comfort zone is you just want to start at a level that you can totally 100% handle and honestly cut it in half just don't overestimate cut it in half and that way you are 100% trading at a level that is like negligible you do not care and that's important because that means you could focus on trading the setups really based on the
quality of the setup now when we talk about risk we also have to think about the total amount of money in a position so when I take a trade if I buy a th000 shares of a stock at $3 I'm putting $3,000 into that position now some people would say Ross you're risking $33,000 and I wouldn't say I'm risking $3,000 because I own something that I can resell on the open market so I bought it at $3 if I don't like it anymore I can sell it the question is what can I sell it for
and being able to understand the realistic difference between your entry and the price that you could sell it for means having some experience reading the market you might think I got in at $3 I can sell it at $2.99 I'll only lose a penny when in reality if it drops quickly you might sell at 285 and that was the the fastest you could get out which means instead of risking one penny you're losing 15 pennies 15 cents it's $150 on a th000 shares it's not the end of the world but that would be a bigger
loss so in order to be able to calculate how much you're really risking you've got to look at the difference between your entry to the difference between the low of the pullback for the setup that you were trading so if you're trading the first pull the first candle to make a new high and then you look at that and you say all right well in this particular example here that had me with an entry at about 7 50 and a Max loss at about I think it was 730 so we risking about 20 cents per
share on that trade all right that's my realistic Max loss so if I put $1,000 into that trade I'm not risking $77,500 I'm risking 300 bucks 20000 bucks and that's it it's kind of like flipping a house in a way if you buy a house for 200 Grand and you plan to put some money into it and sell it for 250 you're not really risking 200 Grand you own a house you know obviously houses are not as Li liid as stocks stocks you can get in and out of in the same minute a house it's
going to take some time so that stocks are even a better example of the fact that you can just get out the second you don't like it so I think of my account and the money in my account in a way as a tool and I use that to be able to buy and sell stocks and although I might buy $5,000 worth of stock I'm really only risking a couple hundred on any one of those trades cuz I'm never going to hold until something goes to zero that's not realistic why would I ever do that
so I'm going to get in I'm going to have my Max loss and I'm going to sell if it hits that point and it's as simple as that so that's the way I think about risk the best way to mitigate risk is to trade in the simulator to use stock selection to avoid overtrading to focus on a one trade per day challenge and then to remind yourself that the amount you're risking is the difference between your entry price and your max loss that is that's the reality that we're in so for me I mitigate my
risk I think quite well I've taken an account with less than five well $583 15 to be exactly precise and as I grew it to over 13 well $13 million in gross profit the biggest draw down that I ever had during the entire challenge was about 3% of my account so when we look back at my account right now and we look just at the last 90 days let's see look at recent 90 days there are some draw Downs here but these aren't substantial drawdowns my account I mean I'm never drawing down more than a
couple thousand dollars really even if I draw down $330,000 off of a total profit of 13 million these are not substantial draw Downs these are very small now I'm fortunate because I trade a strategy and I have chosen to keep my strategy within risk parameters that mitigate my downside so although I'm sitting up almost $800,000 on the year if we look at my year to date the most I ever was at risk of going red on the year Well if we look at year to date what we can actually do here is we can look
at um the overview and oh no sorry we'll go to detailed for the year and then we're going to go to win loss expectation and this shows the biggest draw Downs that I had of the year so I started the year pretty much in the green just focusing on each day coming in trying to get one or two good trades some days I got three or four just chipping away trade after trade after trade and you know then eventually I caught a little bit of a loss in March I had my draw down went down
30 grand over the course of two days not great but recovered very quickly and it counts back to the highs and then again in June a little bit of a drop those drops in June were what led to me looking at my um my average losing days and noticing my accuracy was only 50% I wasn't happy here I said this isn't good enough I got to do better and then went on to a 45 Day Green streak then a couple of losses recovered another loss recovered and the account kind of stays right near the high
now there's other Traders out there that might draw down a lot more six figure draw Downs seven figure draw downs but when they rally back up they have six figure seven figure kind of green days I just don't trade at that level while I think it's wonderful for the people that are able to trade at that level I can't handle the emotional risk that comes with having those types of big red days so I've chosen to scale back my own uh I I guess in in a sense upward potential based on the fact that I'm
not comfortable with the downside risk but here's the thing that I'll tell you if you're not comfortable with downside risk the upside that you could have would have should have made doesn't matter because if you can't handle the risk it's not worth taking the trade we're not here to gamble we're here to make money consistently and to make money consistently we've got to be managing risk risk first how much am I risking on this trade and can I justify taking the position based on that amount of risk and what I think is a realistic profit
Target and for this class I've really focused just on this one setup of buying the first pullback I call it the micro pullback setup buying the first pullback second pullback and there'll be a link pinned at the top of the comments it's well it's the download of all of the PDFs and it includes my micro pullback strategy PDF now one thing that I'll note is I have this book over here let's see um oh it's it's this one here it's uh not this one it's thinking in bets by Annie Duke in this book she talks
about how her brother taught her how to play poker Annie Duke is a professional poker player who's made um millions of dollars playing poker and she said when her brother started teaching her he said these are the hands you should play and he gave her a list of the different hands that she should play and she said wait a second I see other people playing different hands you know they've got different cards but they're still playing it and they're better than me so why shouldn't I play he said listen I'm telling you to play these
hands because these are the ones that as a beginner have the highest degree of success it doesn't mean there aren't other hands you can play there are you'll learn them later right now your job is to keep your head above water so these are the only hands you play just like that and I want to encourage you to do the same so this first pullback setup my feeling is that this is one of the best strategies for a beginner to trade because what you're benefiting from is that wave of momentum that comes right after a
stock has breaking news you've got that breaking news you've got that squeeze and you're buying that first pullback and this is a strategy and a setup I've been trading for so long I'm really confident in it so this is the setup that I'm trading whenever I'm doing small account challenges it's like that's the pattern that's the setup and I'm not going to make it overly complicated so what I'm actually going to do for you guys is um I will one of the links in that um in the PDF one of the downloads in that um
group of PDFs is my trading plan and it's a trading plan that documents exactly what to do as you're trading a simulator during those first 30 days how to find the stocks where to get in where to get out the metrics that you want to achieve so it really sets it up almost as a business plan now the next thing that I want to talk about is when to walk away each day and this is actually um a great book here the power of knowing when to walk away it's also by Annie Duke and what
I like about this book is she she talks about how important it is to know when to step back because so many beginner Traders their biggest struggle is overtrading so someone who chronically over trades is going to be a Trader who essentially is just it's almost like I feel like almost like sitting at a slot machine just like pressing pressing pressing it becomes compulsive they're like unable to walk away but the fact is while at a certain point in your career it having greater quantity of Trades can mean more profitability as a beginner getting started
one trade a day can be more than enough one trade a day that's it you don't have to over complicate it you get one trade and you pull 20 cents a share out of the market okay with 100 shares you're only making 20 bucks but you start with $20 a day and if you could do that consistently for 10 days for 20 days for 30 days for 40 days then you start increasing size to 200 shares to 400 shares to 500 to 600 within a couple of months you're trading a th000 shares you're doing $200
a day consistently boom that's $50,000 a year that's a foundation that's the starting point and you could do that all the way up to trading five 6,000 shares and doing 500 to 700 to $1,000 a day with one trade a day now you get to a point where you realize all right I'm holding myself back by not taking two trades or three trades on a day when the Market's hot the problem is for a lot of Traders it becomes a slippery slope when you're doing just one trade a day it's easy to say one trade
a day that's it but once you're doing two you're like ah what's the difference between two and three what's the difference between three and four what's the difference between four and 400 next thing you know you really broken the ice now you're just trading with with almost no restraint so one of the things that I talked about uh in my book had a day trade is guard rails you will not win the Tour to France with training wheels on your bike but as a beginner you need those training wheels to keep you safe to help
you have a positive experience so when you're getting started you can build confidence so you can put on that positive feedback loop so as a beginner I think it's really important to have these guard rails even though they can feel restrictive and you know that you're not going to keep them on forever for right now they keep you safe and so one of those restrictions is limiting the number of Trades you take every single day and the easiest way to do it is to trade in a cash account because if you're trading in a cash
account once you run out of cash boom you're done so you can fund a cash account with $33,000 you could trade one $3 stock with ,000 000 shares each day you get in at 290 you sell at 310 that's 20 cents 200 bucks boom your account's green you're done your cash is now tied up you got to wait till the next day to trade again and and I think that that really is a good way to approach it so for me knowing when to walk away as part of The Beginner's trading plan we just sort
of basically we automate it and say it's after you've taken one trade because that's that's the rule you trade in a cash account you've taken one trade then you're done once you've proven profitability over the course of several months of trading one trade a day in a cash account and you've increased your size only then do you say all right I think I'm ready to graduate to taking two trades a day and you can still do it in a cash account you just take take trades that a little bit smaller amount of money so now
you take two trades now you take the next day two trades two trades two trades you do that for 10 days you prove that you can trade a little bit more you take three trades and on some days you only take one because there's only one good setup but on other days you take three then you take four then you take five and you know what's going to happen you're going to get to a point where you're going to expand a little too fast and you're going to have a loss and this is one of
the most important things that can happen to you you have your first big loss and then you prove you can recover and how do you recover by putting the guard rails back on by going back to one trade a day for a week just until you've smoothed back out it's so important after having a big loss that you stop the bleeding as quickly as possible so it's like I imagine being in a rowboat and a big loss is like all of a sudden I hit a rock and there's a giant hole in the boat so
the first thing I have to do is stop the bleeding I've got to stop the water from coming in so I've got to plug this hole that's the first thing stop the water from coming in right stop the bleeding stop losing the next step is to start bailing yourself out but there's no sense bailing yourself out when you're still D digging the hole deeper when you're still making mistakes you're still spiraling you're still emotionally compromised first stop the bleeding so add the restraints add the guard rail slow down one trade a day stop the bleeding
now start slowly bailing yourself out one trade one trade one trade slow recovery and then you get to the point where you're like okay I'm back I'm feeling good right and now I'm calm cool collected it's amazing how how quickly Traders can go from calm cool collected to fully emotionally hijacked and then it takes a couple of days of calm Trading trade a day to bring it back down it's so easy to reactivate and go right back to that emotional place so for most beginner Traders the cash account is the way to go now the
next thing you could do for Knowing When to Walk Away each day is to set a Max loss this is the most I'm willing to lose on any day and it's x amount if I'm down below that I'm done now with the broker that I'm using I can actually call them and I can say hey guys put a Max loss on my account if I'm ever down more than $5,000 lock my account and don't let me trade for the rest of the day and they're happy to do it they're happy to do it because they
don't want to see me lose money they they I've been a client for a long time they want to see me continue trading for a long time so they don't mind putting that restraint on my account in the event that I have a day where I go down more than $5,000 boom account is locked so you can't do that with all Brokers but with some Brokers you can do that so if you got a broker that allows you to do that then you absolutely should it's like a safety nut it it's like having a you
know it's like rock climbing without the you know being on Bay it just it's why would you take that risk just put the risk parameter on your account it's done you do it once you don't have to think about it but on the one day you need it it's there for you so that means our uh our kind of exit indicators here for not on a particular trade but on a particular day is when to walk so um and we'll just say quit when to when to quit each day so one certainly Max loss right
Max loss dollar amount boom number two three red trades and I would say if they're backto back and they're sizable just three red trades period you might have three red trades and you're down like $12 so it's if it's it's not really about just three red trades but if you have three big losses I follow the three strikes your out rule number three if I give back uh half my profit so if I end up having a day where you know I I went from up you know from zero on the day to up a
th and then give back half I try to walk away there and remind myself that you know what the glasses have full I'm incredibly fortunate and you know even a to day like today I'm up $3,700 my daily goal is$ 5,000 but I'm going to say you know what I got to be grateful this is a really solid Green Day and there's a lot of people that work a lot more hours than I had to work today to make a lot less money so be grateful for what you've got I find that when Traders fall
into that habit of Revenge trading and becoming emotionally High Jack you're angry be and frustrated because things aren't going the way you wanted them to go all right you didn't want to have a red day and the fact is I feel like in those moments we're no longer grateful for what we have because when we start overtrading and giving back more and more losses we're losing what we have chasing what we wish we had so if we can just accept that you know what the glasses half full life is good it's a small red day
hey big picture is I'm still green on the week big picture I'm still green on the month I'm still green on the year why let one day get me so bad out of shape does it really matter and that is part of being a good loser being able to recognize the big picture that one red day is not significant in fact there will only be two really significant days in my trading career my biggest Green Day Ever and my biggest red Day Ever those are two days in a lifetime of trading every other day is
just in between little green little red doesn't really matter as long as I'm consistently making a little more than I'm losing I'm doing well as long as I'm consistently sucking just a little bit less I'm doing well now in order to really understand how well you're performing you do have to be able to analyze your metrics so I want to talk about the review of metrics right now I'm going to pull up the software that I use and by the way I'm not an affiliate of any kind um for any broker or any platform um
I use I use day trade Dash which is my own software that I've built out and I use Trader view which is software that I've been using for a long time uh and if you use them as well that's fine you're welcome to if you don't that's fine too it doesn't really doesn't matter to me but this is what I've been using so when so the way this works is you can import your trades so I when I import my trades I use Lightspeed as my broker I tag my account with Ira because it's an
independent retirement account and then I click here and I upload my file and I click on that and then I click open now I already uploaded that file for today so I I don't need to upload it a second time or I can't actually it would duplicate the trades and kick them out so you upload your trades and you can import from any one of these brok ERS we've got the warrior trading simulator here so we've got our simulator you can import from but you can really import from any different broker and just like that
you import your trades you you choose your broker then you look at the instructions of how to do it you import your trades so once you import your trades what I'm looking at when I'm importing my trades are a couple of different key components I think that there are three core components to profitability so I call them the profit trifactor it starts with accuracy profit loss ratio and then consistency right here these are the three core components so we're going to start by looking at um my accuracy all right so my accuracy here and we'll
look we'll just look at last month for instance um we'll look at a smaller period of time doesn't really matter but last month was um was pretty nice so we'll just take a look at it all right so detailed last month I traded better than average maintained 70% accuracy all right so accuracy right here 70% solid now my average winners and average losers all of my average winners my average winning trade was $516 and your a my average loser here 283 so that gives me a profit loss ratio of about 2: one which is good
so profit loss ratio 2:1 and then the consistency over the month how many weeks were green and so for the month of August um all all four weeks were green I was Green each month or each week here well I guess it's a short week but nonetheless green green green green Green so very solid month now a month like that is there really anything to correct is there anything I could would have should have done differently realistically on a really solid month like that probably not if we look at the last um the last 30
days what you'll notice is that in the last 30 days my accuracy declined a little bit my profit loss ratio declined and my total profit declined mind as well and what you'll notice is that there are a couple of things the data is going to tell me number one I had some losses trading higher price stocks that's a mistake so I took a little bit of risk and traded some higher price stocks I did not get paid for it I had another mistake during this 30-day period uh I traded later in the day so during
this cycle I was teaching live classes from 12:00 p.m. till about 2: p.m. every day and so because I was teaching those live classes um at the at 2 p.m. after I finished trading I would often be looking at the market because I'd been teaching class all afternoon and I'd say oh look at this and then I took a number of Trades going into the close and those cost me quite a bit now this is sort of atypical of me I don't usually trade in the afternoon but in fact that cost me a lot in
terms of accuracy it hurt my accuracy it hurt my profit loss ratio and it hurt my consistency and so after seeing all of that I made the realization that I needed to make a change and it was easy to see that by looking at my metrics I saw right in my metrics it was plain as day said Ross if you have stopped trading right here 11:00 a.m. every day you would have been better off so do that now moving forward now it's true that during the month of August um I did have some nice trades
in the afternoon during Power Hour um and maybe that was it was that particular month it worked but in September I tried implementing essentially the same strategy after after I finished uh teaching classes and for whatever reason in September it didn't work and that might just be that there's not a lot of Rhyme or Reason to it it just for whatever reason this month was not as clean with setups into the close but I think the problem for me that I noticed was that when I took a loss at 300 p.m. after having previously had
a good day so right now I'm sitting at $3,740 and it's 418 so 4 4:18 in the afternoon so if right now I take a trade on this stock and I lose three grand it's like I lost something that I've already had for for 6 hours seven hours and then I just lose it and like there's a Hu there's a much bigger sense of loss and that can create the bigger sense of loss the bigger emotions which then leads to an inclination to Revenge trade to try to recoup those losses as quickly as possible and
start a spiral and that's what happened to me on several days where all of a sudden in the close I made a couple of mistakes so I'm a big advocate of having you guys review your metrics so you can track your performance and so you can give yourself you know kind of that honest feedback of what am I doing right now that's working what's working and what's not working because you know invariably uh you know on a month where you struggle you'll find some element that's like oh okay I should do that differently actually I
have another month here I'll show you so this we go back to uh March so March of this year was a little bit of a tough month for me um and this is all relatively speaking because I mean these are green months but nonetheless look at this so on this month I was really venturing in the higher price stock range and and in fact it wasn't even necessarily just higher priced but I just wasn't performing well on stocks above $10 a share so I said you know what man this is not working all right so
what are you going to do for the month of April you're going to keep trading stocks between 1 and 10 or between 10 and and 20 how about for the month of April you only trade stocks between 2 and 10 so let's look at the month of April month of April I do $45,000 of profit I basically traded nothing above 10 I got a couple of Trades and that was it so I stayed much more disciplined and the result was better profit so it takes an ability to look at your metrics to see this and
one of the things I've noticed about a lot of traders that really disappoints me is I've seen a lot of beginner traders that do not track their metrics at all so they're not looking at their performance they literally have no idea so they'll say oh I'm not trading well I'm losing money and I'll say well what's your accuracy oh I don't know what's your profit L ratio oh I don't know and that to me is is like someone complaining they don't feel well but never going to the doctor it's like don't complain to me if
you're not going to put in the basic uh you know the basic work to try to figure out what's going on so I often ask my members to say hey students go ahead and send me screenshots of you doing the one trade per day challenge and show me how it looks so this is a student Jack who did one trade a day really solid very disciplined this is a Trader who a little more intermittent did a couple trades on different days this is a Trader who stuck with it pretty well one trade a day another
one one trade a day and look there's going to be some red days in there and even if there bigger losses as long as you're mostly green I think you're going to be pretty happy and that's that's really been my Approach and it it goes back to what Jess was saying of just you know getting in getting out not overstaying your welcome get green and don't push your luck you know be grateful for what you've got so once you know how to review your metrics what you do is you take those metrics and you take
the trading plan that I've already given you and you document that into an actual business plan so here's the idea if you're thinking about investing 5,000 10,000 $25,000 into your trading business I think you should write a business plan I think you should prove to me why that's a good investment why that $25,000 is better with you trading it than putting that money just into the S&P 500 or even putting it into treasuries you get a nice Treasury a nice interest rate you put it away you're guaranteed to earn interest so are you going to
outperform that treasury Now setting the bar relatively low you should be able to if you've practiced in the simulator if you've proven you've got the metrics but this is that next step and the traders who do better are the ones who really approach this as a business approaching it as a business also helps sort of compartmentalizing the losses you have a loss it's like well that's a business expense look every business has a business expense and for me it's once a week I have a loss that's okay as long as I follow the rules it's
a successful red day that is part of what is overall a very successful strategy so it's not a problem so by documenting your business plan you're outlining the time of day you trade the price stocks you trade where you get in where you get out how you find those stocks how you manage your risk how you're going to account for your gains and losses what you're going to do for taxes I mean there's several different layers of it when you download the group of PDFs you'll get my trading plan in there and you can use
that as a starting point for developing your business plan now the the business plan I wouldn't say you need the business plan before you start trading a simulator but I do think it's helpful to have at least a trading Plan before you start trading the simulator so you can make the best use of your time especially because most trading simulators cost a little bit of money because you have to pay for real-time Market data and the exchanges make you pay for it so starting in the simulator definitely important step and again use whatever simulator you
want we have one at Warrior trading which I think is great but if you want to use one with Weeble or with thinker swim or whatever that's fine too if you want to trade one trade a day in a commission free account one uh one share a day for trades you could do that and it's kind of like Sim trading because it's only one share but you just want to make sure you keep your positions super super moderate as I said transitioning to real money you only do that once you've met the metrics for Success
you then do the 10 10 day challenge in the simulator you then transition to do that same 10-day challenge with uh with real money and if you can't if if it doesn't work with real money then you obviously go back to the Sim until you're able to prove that you can maintain those metrics uh you sort of keep going back to the Sim get to the point where you can maintain the metrics improve your accuracy and then try the 10-day challenge again so some people go live and then they go back to the Sim and
then they go live and then they go back to the Sim once you're set with live and you're starting to do well that's when we move into scaling up your business and the way we scale it up is by increasing the number of shares you're trading first and the quantity of Trades you're taking second if you go to increase the quantity of Trades first you say I'm going to go from Trading one trade a day to trading 10 trades a day but you're doing it with small size it's going to be a problem for a
couple reasons number one in a cash account you're going to run out of buying power and number two it's going to um expose you to the trigger of having a lot getting really desperate getting really frustrated and then struggling to recoup and revenge trading so it's better to build the discipline and to build the consistency at the rate of one trade per day and first increase share size because you can make money with one trade a day with 2,000 3,000 shares that can be more than enough so I think that's the better way to approach
it try to capture 10 to 15 cents 20 cents per share of profit out of the market each day once you're doing that consistently max out your share size with that one trade a day then introduce two trades a day three trades a day four trades a day that's the right way to approach it and then that's also the point where you say all right now I'm going to consider transitioning from uh trading in a cash account to trading in a margin account now we have to talk about taxes and retirement planning one of the
things that I think is absolutely incredible about day trading is that you can day trade in a retirement account and I've done exactly that I set up a Roth IRA I did a traditional IRA then converted it to a Roth and I set it up and then it was with $118,000 so the way uh the Roth IRAs work is you've got your max contribution so for me contribution I funded $6,000 and I did this I think it was in um 2019 2020 and 2021 so it totaled 8,000 um it might have been 2018 that I
did the first one I can't remember but in any case I funded it with $188,000 and from there I started day trading it now until I was over 25,000 I only took one trade per day one trade per day and really it was only a couple of Trades per week it wasn't every day I was trading it once I was over 25,000 from there I just kept growing the account I've actually grown that account from $118,000 in initial contributions to over $7 million of profit $7 million fully audited profit now my results are not typical
but that is real money and the wonderful thing about trading is that you can trade as much as you want in a retirement account and in a Roth IRA the income is tax-free and the distributions when you take them are also taxfree the only problem is you can't touch the money till you're 59 and a half years old and so what a lot of beginner Traders will do is they'll trade in a regular account to produce profit in order to pay bills and things like that and I think that's wonderful and then what I encourage
you to do is as soon as you possibly can start saving money into a Roth IRA and plan to use that Roth IRA so you'll each day trade in your one account you get your one trade a day in the first account and you get your one trade a day in the Roth IRA one trade is taxfree saving for retirement the other trade is taxable but that's okay you want some taxable gain that pays you know your bills and everything else and generates some profit so you want to do that but then that second trade
is in the Roth IRA so then you get to the point we're doing two trades a day one in the main one in the Roth IRA and you slowly grow that Roth IRA now the way I think about it is when I created my IRA with $188,000 I grew it pretty quickly up to 100 Grand and then I started thinking well how much money do I really need in an IRA when I'm trading and how much money do I really need in my day trading account if I'm trading a stock at $10 a share and
I want to buy $10 ,000 shares that's 100,000 bucks all right so that's a pretty big position for a beginner Trader but for someone like me I could handle doing that I probably wouldn't go a whole lot heavier maybe 15,000 shares so realistically $150,000 is about the most that I need in my trading account so what do I do when I take 18,000 and turn it into 7 million well I keep about 100 150,000 in my trading account and then I do a direct rollover to an IRA which is longterm so this this is a
long-term IRA and with this money which is now about 6.9 million over there 7 million just about that I invest long term and for that the goal 8% a year I'm not trying to be crazy I'm not trying to be a hero I want slow consistent returns but look 8% a year on a nearly $7 million account this is hundreds of thousands of dollars per year completely passive I don't even have to think about it and now this can grow for the next 20 years I can't touch it for 20 years anyways so this gets
to just keep growing and growing and growing and every time I get my account up to to 250,000 to 300,000 I take another 100 grand out I send it over here I take another 100 grand out I send it over here and so this account stays perpetually relatively small again $150,000 is not a tiny account by any means but I keep it relatively small and then all excess profits goes go over to the long term and one of the other things that's really nice about this is by Never Keeping much more than $150,000 in this
account I also am risking the most that I could ever really lose day trading so having turned you know $583 into 13 million in that in gross profit I there are some traders who trade a strategy where in one trade they could lose $5 million and that's not possible for me because I don't have enough money in my account for that to happen so it's very important for me that I pay myself and I clear the profit off the table and I put it away I put it away I put it away that's an additional
form of risk management I only keep enough money in my account that I realistically need to execute the trades I'm going to take on a daily basis now some people would say Ross you know you turned $583 into 10 million why didn't you start with 5,000 you could have turned it into 100 million why don't you start with 50,000 you could turn in a billion dollars and here's the problem during my 58 $3 to $10 million stretch my average position size was 8,000 shares so if I wanted to 10 times that I would have needed
to have traded with an average position size of 880,000 shares if I wanted to do 100 times that I would have needed to trade with an average position size of 800,000 shares and I'm telling you that's not possible so there is a limit to scalability in the market I know people out there that do trade with 80 and 100,000 share positions on a fairly regular basis and look they have six figure red days they have days they go red two3 $400,000 they have days where they're green three $400,000 they're playing in a little bit of
a different game than than where I'm at I don't have emotionally the the ability to tolerate that type of loss I I just don't have it in me so my own success to a certain extent is limited by my personal risk profile just as yours will be you may not get to the point where I'm at or you may far exceed where I'm at I have several of my students who have earned million dooll badges who are trading a higher level than me and I'm super proud of them and I hope that they continue to
do really well and but there's nothing wrong with that I don't feel competitive with that because look we have different risk profiles so that's okay you just have to find what works for you but what works for me is making sure I save for retirement I'm putting that money away long term and when it comes to taxes the more that I can save the better positioned I'll be in the retirement account the better positioned I'll be because I keep my tax bill very low now when it comes to taxes what a lot of Traders will
do is they'll file for what's called Mark tomarket accounting when you file for Mark tomarket accounting you become completely exempt from wash sales a wash sale occurs when you take a loss and then you buy back a substantially similar position within 30 days when you do that you're no longer allowed to write off the initial loss and that could be a problem for a Trader for instance who wants to trade the same stock every single day now that's not my strategy so if you're trading the same strategy as me don't really probably have to worry
about about that but but wash sales can still be a factor if you're trading the same stocks over several days and you do have uh gains and losses gains and losses so what most Traders will do is they'll file for marketto Market accounting and that's exactly what I did as soon as you file for that you notify your broker that you've changed your accounting status to Mark to Market and from that point forward you no longer have any wash sales that are exempt that you cannot write off against your income now the next thing that
I really encourage people to do is to treat trading as a business so of course you have your business plan but you also want to think of all of this as equipment trading is a business if it's producing profit and this is something that you're doing it is your business so all of this equipment you can expense it you can well depreciate it deduct it you've got the monitors you've got your computer you've got your subscriptions you've got your education cost you've got all the things that you put in to this business if you were
starting a coffee shop you would treat all of this as a business expense if you went to workshops to learn about how to run a coffee shop if you took classes if you took courses about how to run a coffee shop those are expenses you would itemize all those expenses and you would deduct them against your income especially in those early years when you're doing the startup there are many people who will be negative during their first year because they're trading in a simulator they're not putting real money on the line but they're incurring some
cost through Market data equipment subscriptions education and so you want to make sure you itemize all that and you keep that set aside a good accountant will help you make sure you do it all the right way I think a good accountant is worth their weight in gold so I highly encourage you to get good accounting CPA advice to make sure you're making the right decisions but these are things that I've done in my trading that really help me a lot and I think we're definitely the right move uh certainly when I was getting started
so I have officially condensed 27 years of trading knowledge into this class right here which I think is the ultimate beginner's guide into how to start day trading if you enjoyed it I hope you hit that thumbs up I hope subscribe to the channel if you didn't already download the collection of PDFs make sure you guys check that out and I will remind you as always that hey trading is risky my results aren't typical so manage your risk take it slow and I'll see you here for the next upload real soon [Music]
Related Videos

1:41:30
The ONLY Technical Analysis Guide You'll E...
Ross Cameron - Warrior Trading
200,461 views

24:52
The Most Useful Thing AI Has Done
Veritasium
3,731,844 views

1:21:01
How Danny Scaled his Day Trading Strategy ...
Ross Cameron - Warrior Trading
70,902 views

28:30
How do Graphics Cards Work? Exploring GPU...
Branch Education
3,587,234 views

1:14:33
Discussing the Frontier of Particle Physic...
StarTalk
1,370,049 views

48:02
How Sociopaths Actually Work | Authorized ...
Insider
747,949 views

3:06:12
The Ultimate Day Trading Guide for 2025 (F...
Ross Cameron - Warrior Trading
267,370 views

28:33
Terence Tao on how we measure the cosmos |...
3Blue1Brown
1,221,300 views
31:22
The Trillion Dollar Equation
Veritasium
11,181,956 views

32:44
The Closest We’ve Come to a Theory of Ever...
Veritasium
9,694,397 views
1:37:30
Ultimate Guide on ADDING to Winners with S...
Ross Cameron - Warrior Trading
245,341 views

12:23
#1 Best AT HOME Test to Find Clogged Arteries
Dr. Ford Brewer
3,065,119 views
25:05
Ranking Paradoxes, From Least to Most Para...
Chalk Talk
220,007 views
1:04:29
How to WIN at Day Trading as a BEGINNER in...
Ross Cameron - Warrior Trading
633,778 views
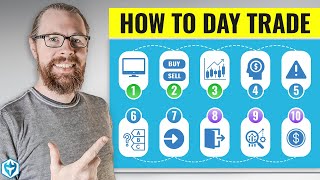
2:37:50
How to Start Day Trading from ZERO (Full T...
Ross Cameron - Warrior Trading
498,429 views
2:43:35
Body Language Expert: Stop Using This, It’...
The Diary Of A CEO
8,317,994 views

1:54:59
The Simplest Day Trading Strategy for Begi...
Ross Cameron - Warrior Trading
64,979 views
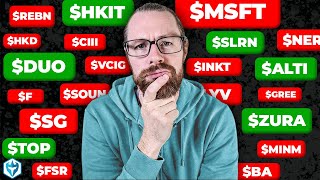
55:21
How to Pick the BEST Stocks for Trading (w...
Ross Cameron - Warrior Trading
385,636 views

3:31:24
Deep Dive into LLMs like ChatGPT
Andrej Karpathy
735,089 views

48:15
Reading Candlestick Charts Was HARD Until ...
Ross Cameron - Warrior Trading
1,205,036 views