Como criar ROBÔ TRADER de HiLo para Profit BlackArrow e Vector
31.31k views3608 WordsCopy TextShare

Clube do Robô Trader - Profit e Vector da Nelogica
====== ⚠ IMPORTANTE! LEIA A DESCRIÇÃO COM ATENÇÃO ⚠ ======
✅ Clique 👉 https://bit.ly/yt_ClubeDoRobo...
Video Transcript:
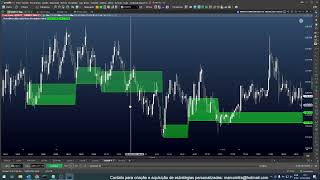
in this video you will learn how to develop a robot trader from absolute zero for Nelogica platforms using the HiLo indicator that generated this result anyone even if they don't know anything about programming that applying this step by step will be able to put this robot trader to operate in the your account still talks guys welcome to my channel if you still don't know me my name is Danilo Leandro I'm a trader engineer and robot programmer if you liked the idea of this content already send that click on like to like this video and now let's go there for profit let's start developing this robot together let's go there so let's go there now on the profit screen and remembering that this same code you will be able to use both in profit in Vector and in BlackArrow ok so come on we are using it here profit let me show you the first thing you need to do is place the indicator to understand how it works , put it here on the chart to understand how it works and we can compare it with what we will build in the code . today we are going to use the HiLo as a base indicator here to generate our entries if you don't know it, I suggest you put the indicator there so that we can analyze it together, the moment of entry and exit, we are going to use a six-period HiLo here and I will put it appearance here it signals as red and green mine was automatic but see that it is plotted in black so I clicked here ok and here it shows the entry and exit times and what we will consider as the entry and exit time of this operation with HiLo when it signals and here it is in green, that is, it is below the price here it will be considered as a buy ok so here it will be a buy and in the same way when it reverses, as it happened here it will be indicated for us to sell it's good and to make it easier, right to make it a little more robust what we're going to do here in the execution, it's going to need for us to consider buying to signal both by HiLo and the box, right that we're going to use here it needs to be too positive in the case of buying, HiLo indicates selling, we will also analyze if the box with is at that moment negative ok and when we will exit the operation, we will operate from the operation when the first box changes direction so we consider here the sale in this box that had the negative box plus the HiLo signaling for sale and when the customer would leave this operation down here I will put it here in blue in this box here that would be the first positive box , that is, a sale was coming and at that moment the box signaled the exit of the operation ok in the same way in the purchase, so let me take a hypothetical purchase situation here, right, so you bought here because the candle closed the positive box, in addition, the HiLo was indicating a purchase and it sold when this first box here ended sell the exit of our operation so this will be the logic once understood we go there now to the strategies editor to start this development let's go there for us to reach the strategies editor just come here in the strategies menu strategies editor this screen will open you can click here's a blank strategy and that's it, we 're already here in the strategies editor, I'm just going to organize the window here . and on the left side we'll start developing our code to make it easier.
I 'm going to use that basic code that we developed in the other video . for you to understand how we built this base code and you will see that we are going to build this robot trader in just three simple steps so let me bring here our base code for us to start programming it every week I upload new videos about automated strategies and robot development if you would like to learn how to develop your own robots and have them operate for you in the financial market, subscribe now to our channel and don't forget to enable the bell so you don't miss any videos and have the source codes of these robots first hand ready I already copied our base code I'll paste it here ready it's complete and if you don't understand here why it's like this don't forget to go there on the card I left behind and it's also in the video description here the link for you understand the step by step and we are going to follow these three simple steps starting with this 3rd step we are going to load the indicator in this case the HiLo 2nd step we are going to define what will be the criteria for the buy and sell signals that is the signals of entry and the third step will be the indication of the exit moment that we already established earlier here at the beginning of the video where I showed you the graph signaling here which moment will signal the sale in this case here or the purchase in this case here . well then let's go there ah Danilo and the rest of the code right this bottom part here as it is indicated here in our base code that you will watch later there to understand the bottom part properly we are not going to change why because the part of of execution of input execution of output and the coloring is already ready using this rule that we have been using applying here in our YouTube videos ok so then you will watch this other video there to understand the important step by step here that you will use this base code that I'm bringing you here and in three simple steps you'll build your robot trailer let's go there so the first thing we're going to do here is bring our HiLo activetor indicator , but then you don't know the indicator, right?
here you will load it when you open the parentheses here it will say what we need to indicate first the period we indicate here the period which is the six-period HiLo that I defined and we will use parameter one here and why the parameter one this parameter one will tell us if the HiLo is indicating buy or sell , that is if it is below or above the price, so we will not need to know the HiLo value , but only the position if it is indicating buy and sell it and you will understand this in practice ok and of course we need to put this information here inside a variable that we will create it up here let's put it here as HiLo direction and what is the type of the variable I will put float here because I already know that it is a float but how can you find out this information let's go I'll put it here to load and then you come here with the mouse over the HiLo function for the mouse and it will bring you this help see this I'm going to take a print here and you're going to observe this criterion here, it's going to give you the right description that what happens who is the HiLo indicator it gives you the parameters in this case here you just need to pass a parameter which is the period in this case we defined it as six and the result is of type float so here you go with that you know what the type of variable needs to be, what is the type of variable to receive the value of this function from the raylon activetor ready now. learned more about this one to build your robots, including other indicators, okay, let's go, I brought it and loaded it . I already did the first step.
Check It. The first step is ok. it's going to be our buy signal, let's go first thing that we're going to do the next railô it will return us one or zero depending on the position if it's buy or sell if you still don't know what we can do here we go create a test session here and let's make a plot let 's plot the result of the raylon direction here to see at what moment it is one or zero for us to define together here what your buy or sell signal will be this I'm going to save this code I'm going to save it here as raylon YouTube underline robot club and save now it comes here on our chart on the right side I'm going to right click insert indicator and I'm going to get the HiLo that we just created HiLo robot club I'm going to insert it here in the lower window ok and I give an ok done that it is already plotting here the way we need it to be one or zero as I had commented and here it is very clear for us to understand that I will bring here a little arrow for us when we signaled a buy it it brought the value one when it signaled sell which was in this case here was the moment that it brought the value zero and it kept zero until it reversed until it signaled here passing signal as green i.
e. as buy so for us it will be the signaling the direction of HiLo one is buying signaling HiLo zero is selling ok so once that's done we can delete our indication here and we don't need this plot anymore ok I'll leave it there for now but we don't need this plot in practice then we can come here and already considering this information we are going to erase these two bars to remove the comment from that line of signal c and we are going to put our rule here what is our rule for buying buy signal direction HiLo needs to be equal to one as we just looked together and I had commented on the rule that we will also consider that the box is positive so how do we do that, the closing is enough for us to indicate here that the closing of this box is greater than the opening opening with that already defined buy Helô it's indicating a buy and the box is positive, it signaled a buy so I'm going to do the following I'm going to copy this line I'm going to delete this comment here from the beginning of the line and I'm going to put it here o pay this semicolon so it's not duplicated and I pasted it ok now which one is which these are the differences, right, for a sell signal, HiLo needs to indicate zero as we just saw and the box needs to be negative, that is, the closing has to be less than the opening ready in a matter of seconds we have defined our two entries for both buying and selling now let's signal our exit what our exit will be like I'll take the comment of stop c here and as we had commented the exit will be when the box closes the opposite of our operation contrary to the direction that we are navigating there, right that we have the operation open so how will it be in the case of buying the box it has to be always positive to indicate to me that the operation is going in favor of our operation when we want to exit when there is the first negative box for us to signal this, it is enough to be the following right closing closing it needs to be what is smaller than opening this indicates that the box is negative in the same way in the case of selling we go sell and remain short until the first positive box occurs that's it already that solves it already indicates both our our buy entry signals sell entry signal our buy stop and sell stop I'm going to save this indicator it will continue posting here only which now with all the coloring, right, which is indicative of buying and selling and you will see how this works I will click with the right button and it will show here for you to insert it here, the execution strategy and we will also bring here the High low that we just created, I click here now I'm going to bring it here on the graph itself ok and notice that let me enlarge the graph a little here I'm going to put it in full screen initially to make it easier for people ready here I bring our little arrow here signaled a sell you see here he sold in this position because he sold in this position because he signaled in this box here it is 1 box that originated the entry is in his closing so we are executing it in the back test and we will also use it this way to run the code only when the box closes , then closes this box, ends both the HiLo and the sale, it's up here and down here, in addition to having the box, we check that our indicator indicated zero, also confirming the information that we have in the this graph satisfies our sell entry and he kept the short operation until the first box closed in the inverse position, that is, a box closed positive and then here it is signaling with this little orange arrow here the buyTocover , that is, the exit of the sale initially that we were already operating even though at that moment it continues to show a sell signal here in HiLo we exited the operation ah Danilo but then it kept right HiLo remained below that is signaling a sell and there was a box closing here negative what what it happened again, there was 1 sale operation taking place in this position and it remained short until when 1 box came out positive repeating this operation again here coming down here and it came out when there was this other box only in these three operations here I will clean it up a little the screen just see the results right we sold here bought here already had almost a percent gain then sold here and left here already had another 0. 3% gain then sold here and left here had another 1 point 23 gain then this in how long in 2 days remembering that this operation here is 1 swing trade operation for vale on the 21-period renco chart later you can do tests there too testing other results in other periods in other assets now let's see the result of this back test together and for that we just need to come back here in the back test I'll maximize it here so if you want you can take a print of the code and let's see this together result for this we click here on execute it will execute this code right I'll show you enter and exit there see it's worth 1 day that 's not what we want we want 21 r so you can do 2 paths right I like to click here on stop so as not to weigh it down I click on the chart I type 21 r enter ready he already brought it down here you observe the moment of twenty-one r okay the chart of twenty-one renks as standard we are going to put a thousand shares here that is what we have been using our back tests here for the spot market as a standard and we are going to see this result together by clicking on play here .
all you have to do is delete this part here or save it, it will rerun , not putting that graph there anymore and now let's see the result together by clicking here on statistics and then you're liking this content so subscribe to our channel don't forget to activate the bell so you don't miss it no video and receive the source codes of these robots firsthand if you believe that this type of content can help other people share it with your friends send it to those trailer groups and let's build a great community together look damn impressive huh 102,000reals 493 102,000reals and 493 so look, let me bring it here to the graph and increase it and we will analyze this result together because the market is open so there is variation and it is probably positioned and we see here the net result of one hundred and two thousand four hundred and eighty-three for 1 profit factor of 01:52 total operations in this period 1176 okay 1 drug of 14% is 1 drug OK a hit rate of thirty-four percent ok with the number of winning and losing operations an average of winning operations, when we earn here the average is seven hundred and thirty-seven reais and when we lose three hundred and fifteen, that is, we are earning more than we lose in each operation, this is a very good indication and let's see the equity curve together. and a beautiful equity curve from starting there from June 2022 until today , giving here the result of more than one hundred thousand reais using a thousand shares is a considerable curve, remembering that it is only one year, right? back test then you can do more periods in your profit do other tests changing for example the HiLo period or putting some other variable putting some filter like moving average v WAP in the case of the futures market I know it works well these operations, these filters, we've seen the results in other videos here, here, what shows you is also that really the positive result, right, when there's a gain, is much greater than a negative one , and why is that, right, because we put the rule there once it entered if in the first box after the entry is already a box contrary to our operation it already exits so basically the output here is the size of a box in this case here twenty-one r but you can select other periods there to also do your own back tests and an important analysis that I suggest you also do in the back tests strategies that you execute, come back here in the editor and make the slippage increase that is here we are considering zero slippage let's put one here and let 's see if the result remains positive here , right ?
79 0 was 102 right with 3 33 with 4 11 i. e. I already put fours right cents in this case four slippage ticks in all operations and still the result is positive i.
e.
Related Videos
![BLACKARROW EA FOREX written by CHATGPT for EURUSD [EURO-DOLLAR]](https://img.youtube.com/vi/3sd84ylwzIc/mqdefault.jpg)
1:25:42
BLACKARROW EA FOREX written by CHATGPT for...
Clube do Robô Trader - Profit e Vector da Nelogica
25,208 views

30:03
President Trump delivers his inauguration ...
LiveNOW from FOX
326,016 views

16:27
Automatizando a sua primeira estratégia | ...
Nelogica
44,485 views

30:31
Full Donald Trump inauguration speech: 'I ...
PalmBeachPost
207,731 views

26:25
Pres. Donald Trump's inauguration: FULL SP...
FOX 4 Dallas-Fort Worth
138,378 views
![Como CRIAR seu PRÓPRIO INDICADOR no PROFIT [Aprenda o passo a passo para começar DO ZERO C/ Exemplo]](https://img.youtube.com/vi/NzCb4FuHrtM/mqdefault.jpg)
28:23
Como CRIAR seu PRÓPRIO INDICADOR no PROFIT...
NeoTraderBot
10,361 views

1:33:52
Como criar um ROBÔ TRADER no PROFIT do ABS...
Nelogica
29,594 views

1:24:35
Como criar um ROBÔ TRADER em apenas 3 PAS...
Nelogica
14,835 views

1:03:19
Passo a Passo: Configurando o seu primeiro...
Nelogica
15,489 views

28:23
How to create RSI+EMA+HILO EA TRADER for P...
Clube do Robô Trader - Profit e Vector da Nelogica
18,679 views

20:57
Robô Renko com HILO - Setup de virada do B...
No Risk No Gain - Robôs Para Day Trade
20,061 views

LIVE: Trump Inauguration Day 2025 | FOX 7 ...
FOX 7 Austin

30:52
'GOLDEN AGE': President Trump delivers ina...
Fox News
306,067 views

Watch Live: The Inauguration of President-...
The Wall Street Journal

Inauguration Day 2025: Donald Trump Become...
WUSA9

23:49
Um dos Melhores Robôs para Day Trade Usand...
No Risk No Gain - Robôs Para Day Trade
16,718 views
9:29
Order Block no Profit Pro - Indicador grat...
MarconiTrader Indicadores Profit Vector BlackArrow
15,731 views

24:00
Man Insults Keanu Reeves on a First Class ...
Heroic Acts
1,814,207 views

46:25
SETUP 9.1 Larry Williams e Palex (ROBÔ TRA...
Clube do Robô Trader - Profit e Vector da Nelogica
55,678 views

39:49
How to create MACD TRADER EA for Profit an...
Clube do Robô Trader - Profit e Vector da Nelogica
23,125 views