The 5 Best Price Action Indicators To Spot HIDDEN Signals
291.36k views2793 WordsCopy TextShare

Switch Stats
📈 #1 Trading Indicators: https://LuxAlgo.com/?rfsn=7183373.b9fdcf4
In this video, we unveil the t...
Video Transcript:
price action concepts are some of the most powerful Concepts because they strip away the noise and clutter price action Concepts offer a raw and unfiltered view of Market Behavior allowing traders to see meaningful patterns Trends reversals and the true essence of the market Behavior the biggest obstacle holding Traders back from utilizing these price action Concepts is that they can be hard to identify because of this we searched for and tested many different price action indicators allowing us to eventually find the best price action indicators that help Traders easily spot these powerful signals in this video
we will be going over and showing you multiple powerful indicators to spot price action Concepts such as Candlestick patterns support and resistance zones trend lines chart patterns and breakouts the first price action concept we'll be looking at is Candlestick patterns one of the oldest and most tested patterns that are widely used by Traders there are many different types of Candlestick patterns however there is actually an indicator that is able to combine and shows us all of these patterns at once let's first add the indicator to the Chart head over to the indicator search Tab and
search for the Candlestick patterns indicator select the all Candlestick patterns indicator by trading View and add it to the chart instead of showing us one Candlestick pattern such as the doji or engulfing candlestick this indicator is able to show us nearly all of the Candlestick patterns if we head over to the indicator settings tab and click on the input tab we can see the following currently the trend is detected based on a 50 period moving average let's remove this next we can see that only a few Candlestick patterns have been selected we will change this
and check only the most popular Candlestick patterns the first one we will keep enabled is the doji candlestick a doji Candlestick has a small body with long upper and lower wicks it indicates Market indecision uncertainty and a balance between buyers and sellers it suggests potential Trend reversals or periods of consolidation the next two Candlestick patterns we will enable are the dragonfly and gravestone doji the dragonfly doji is a bullish Candlestick pattern that resembles a t the gravestone doji is the opposite indicating a bearish reversal another important pattern we will be enabling is the engulfing Candlestick
which occurs when the body of a larger candle completely engulfs the body of the preceding smaller candle the final two patterns we will be enabling are the hammer and the spinning top the hammer is characterized by a small body a long lower Wick and little to no upper Wick on the other hand the spinning top has a small body with upper and lower Wicks of similar length since we won't be using the other patterns we can disable them now that we have added and configured the indicator let's take a look at how it can be
used here we can see that the price was in a bearish trend however during this bearish trend we can see that a bullish doji Candlestick formed indicating a potential Trend reversal along with this we can also see a bullish engulfing candlestick both of these signals indicate that the price may make a bullish Trend reversal or a short bullish pullback because of this let's enter into a buy position here we will be placing the stop loss at the recent swing low for the take profit we will be targeting a two times risk to reward ratio now
let's see how the trade plays out [Music] in this case we can see that a large uptrend was taking place however at the end of the uptrend we can see that two Candlestick patterns occurred the first of which is the engulfing bearish Candlestick which indicates that a bearish reversal might start soon the second Candlestick pattern that formed was a bearish doji Candlestick also indicating a possible bearish reversal because of this let's enter into a cell position here we will be placing the stop loss at the recent swing High for the take profit we will be
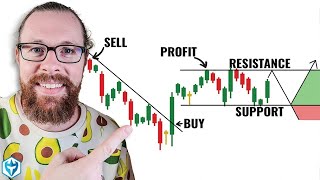
targeting a two times risk to reward ratio now let's see how the trade plays out the second price action concept we'll be looking at is support and resistance which is one of the most important Concepts to use in order to become a profitable Trader in order to help us identify these support and resistance levels let's add an indicator to the chart navigate to the indicator search Tab and search for the swing high low support and resistance indicator select the indicator made by patternsmart and add it to the chart this indicator plots dotted lines that represent
swing high and swing low points that can act as both support and resistance zones since the settings of the indicator aren't optimal yet let's adjust them navigate to the indicator settings tab and click on the input tab we will first be changing the swing high strength value this refers to the number of bars to the left and right of the Swing point for swing highs if we increase the number drastically we can clearly see this change being reflected on the chart since we are looking for a middle ground we will be changing the value to
20. since we want the same rules to apply to the swing lows we will also be changing the value to 20 for the swing lows now let's take a look at how the indicator can be used the indicator looks at previous price action to determine which levels will have significant amounts of buying or selling pressure which will cost for consolidations or reversals to occur here we can see that the price action has been in a small downtrend we can also see that the price action is now approaching a support Zone that was plotted by the
indicator this signal is strengthened by the small consolidation phase that previously was made at this level this tight consolidation phase will indicate a bullish order block formation finally we can see that a large green Candlestick formed that Wicked into the support level before closing back above it because of these signals let's enter into a buy position here aiming for a two times risk to reward ratio while setting the stop loss right below the support level [Music] in this case the price was in an uptrend before it reached a resistance level that was plotted by the
indicator after it reached the resistance level a tweezer top formed this is a bearish reversal pattern formed by two consecutive candlesticks with matching highs indicating potential selling pressure and a possible Trend reversal because of this let's enter into the cell position here we will be placing the stop loss just above the recent resistance level for the take profit we will be targeting a two times risk to reward ratio now let's see how the trade plays out keep in mind to always validate the support and resistance levels before considering them the third price action concept we'll
be taking a look at is the trendlines these can be hard to spot however by using an indicator we can easily identify accurate trend lines but before that if you are looking for a crypto exchange where you can hold or day trade crypto then check out by bit they currently have some of the lowest fees along with many trading possibilities such as spot derivatives nft and even options trading sign up via the link in the description to get up to a thirty thousand dollar sign up bonus along with zero maker fees for the first 30
days navigate to the indicator search Tab and search for the trend lines indicator select this indicator made by Lonesome the blue and add it to the chart as you can see now that we have added the indicator to the Chart we can easily identify trend lines the indicator calculates these trend lines by finding pivot highs and lows based on if the current pivot high or low is smaller or greater than the previous pivot high or low the trend lines are plotted if we take a closer look we can also see that H and L labels
will sometimes be plotted on the chart these represent the pivot highs and lows that are used for the trendline calculations here we can see that a bullish trend line formed which has been respected multiple times showing that it's strong and likely to provide support in the future as well we can see that recently a pullback was made back to the bullish trend line after the pullback was made the price made a clear rejection by respecting the trend line if we take a look at the previous price action we can also see that the price has
Consolidated and rejected this level before further confirming the bullish bias because of all of these signals we will enter into the position we'll be aiming for a two times risk to reward ratio and placing the stop loss at the recent swing low let's see how the trade plays out [Music] while analyzing the price we can see here that the price recently made a pullback to a bearish trend line that the price has previously respected multiple times we can see that after the pullback was made the price respected it again and continued in the bearish direction
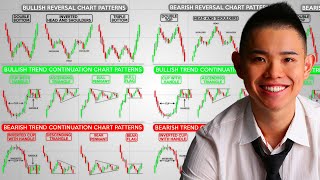
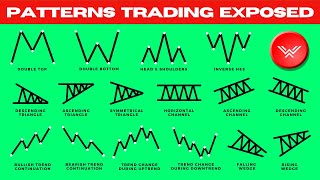
along with this if we take a look at past price action we can see that this price level has been used as a consolidation and resistance Zone before because of this let's enter into the cell position here we will be placing the stop loss at the recent swing High for the take profit we will be targeting a two times risk to reward ratio now let's see how the trade plays out the fourth price action concept we'll be taking a look at his chart patterns chart patterns are specific formations that appear on price charts and can
provide valuable insights into future price movements let's first add the indicator to the chart head over to the indicator search Tab and search for the wedge and flag finder indicator select the indicator made by trendoscope and add it to the chart by using multiple pivots this indicator is able to identify powerful tart patterns known as the wedge and flag patterns in the price action if we head over to the indicator settings tab and navigate to the input tab we can see that the length of the wedges can be changed this means that by changing this
setting you can change how many pivots a wedge can have the following check boxes are for visual changes when the first checkbox is enabled it will cost the indicator to try to avoid overlapping wedges while still showing nested wedges which is a wedge within a wedge the other checkbox is to enable or disable the zigzag lines however since these can be useful we'll keep them enabled the final settings are for enabling or disabling the different zigzags we will be keeping these settings at default this indicator helps us detect three patterns the first of which is
the rising wedge a rising wedge is a bearish chart pattern formed by converging trend lines with higher highs and higher lows indicating a potential reversal a rising wedge is a bearish chart pattern characterized by converging trend lines that slope upward it consists of higher swing highs and higher swing lows with the price moving within a tightening range this pattern suggests weakening momentum and potential reversal often leading to a bearish price movement the second pattern that can be identified with the indicator is the falling wedge a falling wedge is a bullish chart pattern formed by converging
trend lines that slope downward it comprises lower swing highs and lower swing lows with the price confined within a narrowing range the falling wedge indicates a potential Trend reversal as buying pressure May overpower selling pressure resulting in an upward price movement finally the indicator can detect flag patterns a flag pattern is a pause or consolidation phase that happens after a fast price move it looks like a rectangle and can slope slightly in the opposite direction of the main trend if a flag slopes upward it's called a bearish flag and if it slopes downward it's called
a bullish flag Traders see flag patterns as signs that the previous Trend might continue in this case we can first see that a rising wedge was playing out which cost for the price to make a sharp move to the downside after the sharp move the price Consolidated which ended up creating a bearish flag pattern indicating that the price will move in the downward Direction however we can also see that a falling wedge was made within this bearish flag despite this the sentiment is still bearish this is because the falling wedge was small and after it
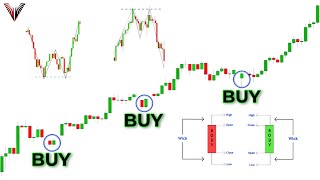
was created a small bullish move did indeed occur before the price headed back in the downward Direction because of this let's enter into the cell position here we'll be placing the stop loss at the recent swing High indicated by the previous pivot for the take profit we'll be targeting a two times risk to reward ratio now let's see how the trade plays out [Music] the final price action concept we'll look at is breakdowns and breakouts breakouts or breakdowns are great signals that can trigger buying or selling interest and drive the price in the respective Direction
there is actually an indicator that can help identify breakouts let's add this indicator to the chart head over to the indicator search Tab and search for the breakout finder indicator select the indicator made by Lonesome the blue and add it to the chart if we take a look at the chart now that we have plotted the indicator we can see that red and blue boxes are plotted on the price action these boxes help visualize where a breakout is likely to occur or have occurred if we head over to the indicator settings tab and click on
the input tab we can see the following the first setting is the period which is used to find pivot Points as you can see when we decrease this value smaller breakouts will be detected on the other hand increasing the value will allow us to see longer term and more important breakouts since a value of 5 is good for detecting midterm breakouts let's keep the value of the setting at 5. we will also be keeping the other settings at default if we analyze the price action we can see that the price was in a large downtrend
here during the downtrend we can see that a consolidation period occurred potentially indicating that a further bearish sentiment is entering the market which will push the price action further in the downward Direction finally we can see that a breakout was made in the downward Direction further confirming our initial bearish bias because of this let's enter into the cell position we will be placing the stop loss above the upper line of the breakout box for the take profit we will be targeting a two times risk to reward ratio now let's see how the trade plays out
here we can see the following a significant uptrend occurred followed by a pullback and a consolidation phase we can see that after this unfolded a bullish breakout took place indicated by the blue arrow because of this let's enter into a buy position to manage our risk we will place a stop loss below the lower line of the breakout box for the take profit level we will aim for a two to one risk to reward ratio now let's monitor the trades progress and see how it plays out the market structure also plays an extremely important role
when entering into a position for this we can use the premium price action Concepts indicator by Lux Aldo as you can see this indicator shows us ICT and smart money concepts related to price action if you are interested in getting access to the Lux algo premium indicators check out the link in the description to get them with a 30-day money-back guarantee I hope you enjoyed the video if you did please leave a like And subscribe to the channel if you have any questions feel free to leave a comment
Related Videos

21:49
Convert TradingView Indicators into Strate...
Michael Automates
193,239 views

55:11
Master This ONE Candlestick Pattern TODAY ...
Ross Cameron - Warrior Trading
882,095 views

39:19
Support And Resistance Didn't Work Till I ...
Rayner Teo
1,829,705 views

29:01
Technical Analysis is Hard (Until you see ...
SMB Capital
685,166 views
1:16:42
The Ultimate Chart Patterns Trading Course...
Rayner Teo
741,216 views

32:21
15 Best Price Action Strategies After 15 Y...
Wysetrade
1,555,584 views

26:44
13 best PRICE ACTION signals I found after...
Tradeciety.com
2,200,605 views
55:18
How to Read Candlestick Charts (with ZERO ...
Ross Cameron - Warrior Trading
2,347,268 views

48:15
Reading Candlestick Charts Was HARD Until ...
Ross Cameron - Warrior Trading
633,592 views
58:21
The Only Candlestick Patterns Trading Vide...
The Trading Channel (The Trading Channel)
3,927,922 views
38:15
Ultimate Chart Patterns Trading Course (EX...
Wysetrade
5,670,932 views

24:05
My Incredibly Easy 1 Minute Scalping Strat...
Riley Coleman
77,501 views
14:29
The Trading Indicator That Is 10x Better T...
Switch Stats
200,267 views

21:47
20 MUST-HAVE TradingView Indicators For 20...
Magic Indicator Strategies
310,686 views

28:55
Best Trend Lines Trading Strategy (Advanced)
Wysetrade
4,552,956 views

11:46
The Best 3 AI Trading Indicators on Tradin...
Switch Stats
274,208 views
44:00
Best RSI Indicator Trading Strategy - Wyse...
Wysetrade
2,859,155 views

3:26:20
Become a PRICE ACTION 'Beast'🔥 | 3+ Hours...
Fortune Talks
2,759,968 views
45:00
The Only Day Trading Strategy You Will Eve...
The Trading Channel (The Trading Channel)
5,154,446 views

11:58
This Oscillator Tells You Exactly Where To...
PineTrades
73,385 views