🔴 This "NEW CONCEPT" Trading Strategy Prints Money!... (INSANE Results!)
2.84k views4292 WordsCopy TextShare

Trader DNA
🔴 EMA-CCI "New Concept" Forex & Stock Trading Strategy
https://traderversity.com/ema-cci-new-concep...
Video Transcript:
hey traders welcome back to Trader DNA your ultimate destination for mastering the markets Let's be real technical analysis can be tough If you're not crystal clear on what you're looking at and if you're not analyzing the right factors you won't last long in this game But here's the good news I've got you covered Today I'm breaking down a simple yet powerful technical analysis process that will help you trade smarter faster and with more confidence No more second-guessing your entries No more confusion Just clear disciplined decision-making that leads to better accuracy and bigger profits Trust me
this is the kind of insight that completely transform the way you you trade Instead of feeling lost and unsure you'll gain the confidence to execute trades with precision sticking to your rules staying disciplined and most importantly maximizing your profitability So hit that like button subscribe and stick around because if you miss even one of these trading rules it could cost you an accuracy and profit Let's dive in and unlock this powerful trading strategy right now One of the most powerful high probability entry signals one that holds massive profit potential is the trend reversal A valid
trend reversal shouldn't be hard to spot if you know exactly what to look for In fact it's right there in plain sight And if you can capitalize on these shifts in trend direction you can maximize your profits like never before But here's the crazy part So many traders especially beginners and amateurs completely fail to take advantage of trend reversals Instead of riding the wave to bigger gains they keep making the same mistakes ending up with loss after loss Meanwhile those who truly understand trend reversals are cashing in on huge opportunities So what's the big problem
Why is there so much confusion And even more importantly why does this same mistake happen over and over again to new traders The truth is most beginner traders over complicate trend reversals way more than they need to And that's exactly what we're going to fix right now In this video I'll break everything down for you step by step so you can finally avoid the trap of overanalyzing trend reversals and start using them to your advantage First things first let's simplify trend reversals and bring everything back to the fundamentals Too many traders get caught up in
unnecessary details Forget the noise Focus on what really matters Making money maximizing profits and minimizing losses And that's exactly what we're doing today In this video I'm breaking down a simple be five-step process to accurately spot trend reversals know exactly when to take action and capitalize on every opportunity So let's not waste any time Let's dive right in Step one identify a market with a clearly established trend I'm going to prove to you that this is incredibly simple so don't overthink it and definitely don't get stuck in unnecessary details First things first wipe your chart
clean Get rid of all those indicators and make your trading chart clear and clutter-free Now zoom out If a trend jumps off the screen then guess what You've got something to work with So let's take a look at this chart Is there a trend Which direction is it moving Now check this one Same question Trend or no trend Up or down And here's another one See how clear this is No confusion No distractions just pure price action telling you exactly what's happening in the market All right what about this one If you have to lean
in squint your eyes and scratch your head just to figure out if there's a trend chances are there isn't one And here's the deal If the trend isn't obvious don't force it Move on There are thousands of stocks forex pairs and crypto assets out there Keep searching until you find a market that's clearly trending and actively moving right now This is a fundamental key that most beginner and amateur traders completely overlook And that's exactly why they keep losing trades But you now you know better From this moment on always apply this first step to every
single trade you take Step two choose your trend reversal indicators All right now we're diving deep so pay close attention This step is critical and missing even a single detail could wreck your entry accuracy And trust me without precision you'll never get to enjoy the sweet profits that trading has to offer So let's bring this blank chart to life That means adding indicators or spotting chart patterns to give us a clear edge Now there are tons of indicators out there but for this tutorial we're keeping it laser focused with just two the 50 period EMA
our key level for support and resistance The CCI commodity channel index our entry signal generator Because this strategy relies on just two carefully tuned indicators it's easy to follow keeps you disciplined enough and can even be automated into a trading bot Now let's break it down Starting with 50 period EMA I'll walk you through the exact settings you need to ensure it adapts perfectly to the market and the time frame you're trading Get ready This is where things get exciting Let's break this down First take a look at this The EUSD chart on the daily
time frame from June 14th 2024 to March 8th 2025 You can see how price consistently respects the 50 period EMA Now check this out the BTC USD chart on the daily time frame from August 7th 2024 to March 8 2025 The market once again reacts to the 50 period EMA confirming its importance And finally here's the GBPUSD chart on the daily time frame From April 23rd 2024 to March 8th 2025 we see the same pattern Price respecting the 50 period EMA time and time again So after seeing these three solid examples do you think the
50 period EMA is just another random setting Absolutely not This is one of the most widely recognized EMAs used by banks and institutional traders alike That's why it's a powerful foundation for incorporating moving averages into market analysis And here's the best part By the end of this video I'm going to break down step by step the most precise most advanced and easiest way to set up the moving average indicator so you can use it to its full potential This is the ultimate method and I'm revealing it exclusively to you But first let's dive into this
powerful strategy because this is the backbone of our entire trading approach Master this and you'll have a rocksolid foundation for everything that follows Let's break this down The market's reaction to the 50 period EMA Now let's zoom in and take a detailed look at how price reacts to the 50 period EMA because this is the foundation of every high accuracy entry we make Look right here here and here Notice how the price bounces perfectly off the 50 period EMA Now check this out When the price breaks below the 50 period EMA it stays below confirming
a bearish trend Then once price breaks back above the 50 period EMA it holds above it And every time it retests the EMA it bounces right back up just like we see here here and here And once again when price breaks below the 50 period EMA it remains below acting as resistance Every time price rises back to the EMA it rejects downward reinforcing the trend Now that you've seen this pattern unfold I'm sure you can spot the behavior The market consistently respects the 50 period EMA We can use this reaction to pinpoint high accuracy entry
signals with strong profit potential while keeping risk minimal And here's the kicker This is exactly the kind of entry strategy that big traders banks and institutions rely on So how do we find these high accuracy entries the ones that can consistently deliver massive profits The answer lies in the CCI indicator And some traders also combine it with trend lines and support resistance for even greater precision Don't worry I'm breaking it all down for you in this video All right let me take you straight to this window right here We've got the CCI indicator but with
a special setting set to five Now last week I already broke down the CCI indicator and how to use it to pinpoint high accuracy entry signals but in this video I'm giving you a quick recap just enough to make sure you fully understand this strategy from start to finish CCI is one of the most powerful oscillator indicators out there If you're serious about mastering it there's a lot to explore This indicator has a long-standing reputation for being incredibly effective But for today we're laser focused on the most important part combining the CCI with moving averages
to supercharge this strategy As I explained in last week's video I'm going to show you exactly how the CCI plays a crucial role in this setup Now while there's a lot to learn about the CCI I'm keeping it simple In this strategy we're using CCI as a supporting indicator making it significantly easier to spot high probability entry signals First I'll walk you through how to read the CCI to identify entry signals with high accuracy and strong profit potential Take a look at this On the CCI indicator there are three critical levels So minus 100 0
and plus 100 These are the key levels you need to watch Um if you want to spot high probability entry signals that offer solid profit potential relative to your risk mastering these levels is absolutely essential Let's break it all down step by step The rules of this analysis make sure to follow them exactly one for a bullish trend If the market is in a strong bullish trend which you can confirm by checking that candlesticks are consistently moving above the 50 period EMA then here's what you need to do Wait for the market to enter an
exhaustion phase How do you know the market is exhausted Look at the CCI indicator If it drops below 9 as 100 the market is showing deep exhaustion Now here's where it gets exciting If the CCI rebounds from below none as 100 and breaks back above plus 100 that's a valid buy signal But there's a catch If during the exhaustion phase the CCI doesn't drop below none at 100 then we simply ignore this phase Why Because trades taken in these conditions usually don't yield significant returns Now two for a bearish trend Now if the market is
clearly in a bearish trend meaning candlesticks are staying below the 50 period EMA the strategy works in a reverse You need to wait for the market to hit an exhaustion phase indicated by the CCI rising above plus 100 Now watch closely If the CCI drops from above plus 100 and breaks below Nana's 100s that's a valid sell signal Again if during the exhaustion phase the CCI doesn't reach above plus 100 we ignore it because trades under these conditions tend to have weak returns Why use CCI With this strategy you don't need to memorize hundreds of
price action patterns CCI does the heavy lifting for you However if you spot a price action pattern that aligns with this setup that's even better It boosts confidence in the trade and increases the probability of a winning entry Is the 50 period EMA plus CCI enough Absolutely not We're not here to chase every signal We're only interested in high accuracy signals with maximum returns The key understanding how price interacts with the 50 period EMA just as I explained earlier that's the real secret to filtering out noise and focusing on the trades that matter Let's dive
deeper CCI entry signals in this strategy The effectiveness of a CCI entry signal in this strategy depends entirely on where price is positioned when the signal forms As I explained earlier if price breaks below the 50 period EMA it tends to stay below it indicating strong bearish momentum On the flip side if price breaks above the 50 period EMA it usually remains above it signaling a bullish trend Why does this matter for our trading strategy This behavior is key to identifying markets that aren't just trending but trending with extreme strength And how do we confirm
this By observing how price reacts when it reaches the 50 period EMA Let me simplify it In a bullish trend when momentum weakens price starts dropping If it falls all the way to the 50 period EMA and then breaks below it the trend has shifted into a bearish market In a bearish trend when momentum weakens price starts rising If it climbs up to the 50 period EMA and then breaks above it the market has transitioned into a bullish trend But here's the game changer Sometimes instead of breaking through the 50 period EMA price bounces off
it And when that happens it's a clear sign of a powerful trend because the market is actively rejecting a reversal This is the exact opposite of a weakening trend and a huge clue for high probability trades And this is where we strike in this strategy We wait for price to bounce off the 50 period EMA and look for a valid CCI entry signal at that moment This creates a powerful confluence making it one of the most profitable entry spots in trading Um every trader should know this because this is where massive opportunities are hidden Um
now let's see this strategy in action Everything we've covered so far now it's time to put it to the test in a real market scenario Take a look at this chart Price has successfully broken above the 50 period EMA That tells us one thing The market is in a confirmed bullish trend This is our first key requirement a clear established uptrend Now on to rule number two The market must go through a deep exhaustion phase And how do we spot that The CCI indicator drops below minus 100 If you look closely once CCI enters that
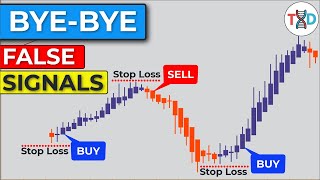
oversold territory and price retraces down near the 50 period MA this is our first major clue a high probability buy signal could be forming Now for the third step confirmation If price bounces back up and CCI breaks above plus 100 we have our golden ticket A high accuracy buy signal with massive profit potential Executing the trade Here's what you do As soon as we get this signal we enter a buy trade on the next candle's open But where do we place our stop loss You have two solid options One stop loss below the 50 period
EMA Why Because in a bullish market price naturally moves away from the EMA This stop-loss is tight and efficient keeping risk low while maximizing the risk-to-reward ratio meaning small risk big potential profit Two stop loss below the nearest swing low This is a classic approach used by price action traders A wider stop gives price more room to move reducing the the chance of getting stopped out too early The trade-off lower risk-to-reward ratio compared to the first option And then boom just like that price skyrockets locking in massive profits This is the kind of trade every
trader dreams of Sell trade Here's how you catch massive profits Now let's flip the script and talk about how to execute a sell trade with precision Take a look at this chart Price has broken below the 50 period EMA That tells us one thing The market is officially in a bearish trend This is our first major rule a clearly established downtrend Next rule number two we need to see the market enter an exhaustion phase How do we confirm that Um the CCI indicator must spike above plus 100 If we zoom in we can see that
once CCI reaches this overbought zone and price moves up near the 50 period EMA this is our first sign that a high probability sell signal is forming Now for the most critical step the entry If price rejects the EMA and starts dropping while CCI plunges back below minus 100 we have a textbook high accuracy sell signal Um this is exactly the type of setup we're looking for in this strategy And what do we do We execute a sell trade at the open of the next candle Play it smart In this setup the nearest swing high
aligns with the 50 period EMA That's a key resistance zone So we place our stop loss just above both of them for maximum protection And just like that boom price plunges hard and fast locking in massive profits This strategy is incredibly powerful but there's one golden rule You must stay disciplined and follow every step exactly As I mentioned at the beginning of this video today we're diving deep step by step into the most precise most advanced and most effective way to set up the moving average indicator If you want to master moving averages and use
them flawlessly in any market and any time frame this is the ultimate guide you need Let's start with one of the most widely used EMAs in institutional trading the 50 period EMA It's a go-to for banks and hedge funds But here's the catch It doesn't work the same way in every market and every time frame And understanding this is the key to mastering technical analysis Take a look at this chart At first glance the first large 50 period EMA looks like a solid level Price keeps reacting whenever it approaches the line But let's zoom in
What if we swap it out for a 150 period EMA Now we see that price is responding even more accurately to the 150 period EMA instead of the 50 Now let's analyze this next chart here Price seems to respect the 50 period EMA making it a decent guide for trend movement But wait what if we fine-tune it Instead of a 50 period let's try an 80 period EMA Suddenly the price movements align even better with the EMA making it a far more accurate tool for this particular setup Next up check out this chart We're testing
multiple EMAs 50 100 200 80 20 and 30 period EMAs And after analyzing them all guess what The 30 period EMA turned out to be the most reliable for capturing price movements in this scenario And that is how you use moving averages the right way Um no more guessing no more confusion Instead of blindly applying a single EMA to every market test how price reacts to different periods Once you find the EMA that consistently aligns with price action stick with it for that market and time frame Now go test this on your own charts and
see how much more accurate your trades become All right to complete this tutorial I'm about to break down some of the most powerful yet easy to master moving average strategies strategies that are not just effective but can actually help you consistently make profits One combining EMA and trend lines Now let's talk about one of the simplest yet most effective ways to trade using moving averages This is a gamecher a method that allows you to spot high probability trade setups with precision So here's the deal I'm going to walk you through step by step exactly how
to combine the EMA and trend lines for trading forex stocks commodities literally any financial market And more importantly I'll show you how to use this strategy to maximize your profits consistently You'll learn exactly when to enter high probability trades using the EMA indicator reinforced by a perfectly timed trend line signal And I'm not just explaining the theory I'm diving straight into real market examples so you can see this strategy in action The goal to fully understand this powerful trading technique and use it to your advantage So let's jump in At first glance this strategy might
seem simple but don't be fooled This is an advanced trading strategy That's why you need to pay close attention and follow each step carefully Even the smallest details can make a huge difference in how this strategy plays out All right let's break it down Step one apply the EMA indicator to your chart and set the EMA period exactly as I showed you earlier In this example we're using the 60 period EMA Step two draw the relevant trend line to confirm that a clear market trend is in place Step three watch for a breakout We're looking
for price action to break both the trend line and the 60 period EMA Now once you have the trend line and EMA set up here's exactly what you need to do First spot an early warning signal a breakout of the trend line In this chart the price breaks the trend line from below to above signaling that the bearish trend might be coming to an end But the confirmation happens only if the price also breaks above the 60 peak period EMA That's your cue to get ready because the trend could soon reverse into a bullish move
Second price breaks above the 60 period EMA Sometimes price crosses the EMA before breaking the trend line and other times it happens after Either way that's totally fine What matters is that both levels get broken Look at the left side of the chart here Price broke the 60 period EMA but failed to break the trend line the market held its position instead of reversing So the moment price successfully breaks above both 60 period EMA and the trend line traders can enter a buy position on the next candle's opening There are three ideal stop-loss levels in
this strategy One below the EMA line two at the nearest swing low three at the starting point of the bullish trend In this example placing a stop loss below the EMA isn't ideal It's too close to our entry point and placing it all the way back at the start of the bullish trend would be too far So the best option here right below the nearest swing low and then boom the market explodes into a bullish trend locking in massive profits Now since this is confirmed bullish trend you can take advantage of multiple buy entry points
using additional techniques like combining CCI and EMA analysis to pinpoint more precise setups Let's break down exactly how to execute the perfect sell entry with this strategy Step one set up your EMA First things first apply the EMA indicator to your chart and set the period exactly as I showed you before In this setup we're using a 60 period EMA Step two draw the trend line Next identify the market trend by drawing a clear and relevant trend line This helps us confirm the price direction before we enter a trade Step three watch for the breakout
Now this is where things get exciting We're looking for a price breakout below both the trend line and the 60 period EMA This is our key signal to enter a sell trade Once you've got your EMA and trend line in place here's how you execute the sell entry Step one identify the breakout Look at the chart Notice how the price breaks below both the trend line the 60 period EMA almost simultaneously That's a strong confirmation that the bullish trend is ending and a bearish trend is taking over Step two understand the sequence As I've mentioned
before sometimes price crosses the EMA first and other times it breaks the trend line first In this case both breaks happen almost at the same time with the same candlestick Which one comes first It doesn't matter The key is that both confirm the new trend direction Step three execute the sell trade Once the price successfully breaks below both the 60 period EMA and the trend line it's time to place a sell order at the next candle's opening Managing risk is crucial So let's set our stop loss correctly This strategy gives us three options for stop-loss
placement One above the EMA line two at the nearest swing high three at the starting point of the bearish trend For this specific trade setup the best stop-loss placement is right above the nearest swing high which is right here And then boom the market drops sharply confirming the bearish trend and delivering huge profits That's everything you need to know Simple right But here's the real secret to making this work Stay consistent I said it before and I'll say it again Discipline is everything One of the biggest mistakes beginner and amateur traders make they ignore the
rules If you take a few losses don't start tweaking your strategy Don't clutter your chart with extra indicators that only confuse your analysis And definitely don't mess with your indicator settings Stick to the system because this strategy is a powerhouse when used correctly This is all you need No gimmicks no distractions just pure high accuracy trading And as always if you learned something valuable today make sure you subscribe hit that notification bell and drop a like to show your support I'll see you in the next one [Music]
Related Videos

29:08
Why Did The Mars Helicopter Disappear?
Veritasium
3,531,700 views

10:13
Bitcoin Is About To Explode (Here’s Why)
Andrei Jikh
136,464 views

25:05
Stop Being Nice to a Narcissist—Do THIS In...
EMPOWERED MIND
526,626 views

1:29:35
Music for Work — Deep Focus Mix for Progra...
Chill Music Lab
3,579,064 views

25:38
🔴 1:5 Risk-Reward Ratio EXPOSED! How Bank...
Trader DNA
74,774 views

21:58
How I Nailed Trading with the MACD Indicat...
Ross Cameron - Warrior Trading
701,623 views

22:39
🔴 The Mother of All Price Actions... Brea...
Trader DNA
184,572 views

16:14
Excel’s Biggest Upgrade Ever – How to Use ...
Kevin Stratvert
75,630 views

22:49
'I Haven't Paid Council Tax! Water & TV Li...
Liam Galvin
113,730 views

28:37
🔴 This Trading Hack Makes PROs RICH (Insa...
Trader DNA
77,092 views

18:27
How to Use ChatGPT (2025)
Kevin Stratvert
311,266 views

25:27
🔴 The FASTEST Way to Profit with Volume &...
Trader DNA
21,941 views
20:00
🔴 STRENGTH INDEX Trading (Say BYE-BYE to ...
Trader DNA
276,004 views

14:06
🔴 These 7 Candlestick Patterns Can Predic...
Trader DNA
43,472 views

19:43
Zapier AI Tutorial for Beginners: Automati...
Kevin Stratvert
118,117 views

15:18
Most Traders Use the RSI WRONG! This Bluep...
Ezekiel Chew
47,756 views
14:17
🔴 Day Trading ORDER BLOCKS... Follow THIS...
Trader DNA
52,843 views

20:32
🔴 The LAW OF MACD… Here’s What No One Tel...
Trader DNA
47,025 views

34:09
🔴 This NON-REPAINTING Indicator Can Make ...
Trader DNA
70,121 views

14:14
Bull Market Vs. Bear Market (The Reason Yo...
Wysetrade
223,791 views