Buy Low, Sell High! This Indicator Shows Market Tops & Bottoms
79.89k views1466 WordsCopy TextShare
PineTrades
Looking to master the classic "buy low, sell high" strategy? The TopG Indicator by BigBeluga helps t...
Video Transcript:
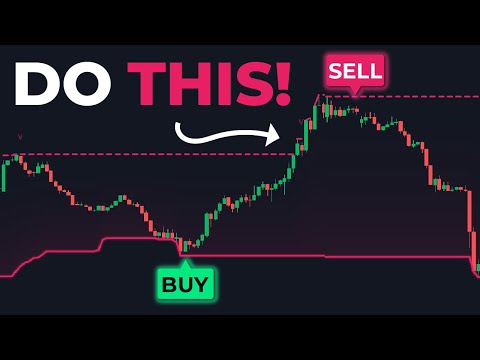
Buy Low sell high in other words you want to buy at a market bottom and sell at a market Top This is a market bottom as identified by this indicator let's take a Buy and see what happens place a stop loss under the channel of the indicator Target a 1 to 1.5 risk reward ratio let the trade run and it was profitable now here was a market top which means we're supposed to open a short position stop loss above of the upper Channel take profit at 1.5 times the risk let the trade run and as
you can see the trade was profitable ladies and gentlemen this is the top G indicator by big Beluga it's a tool designed to identify Market tops and bottoms helping you to spot Trend reversals with ease in this video we're going to go over what this indicator is and how you can use it in your trading if you happen to find Value in this video remember to leave a like let's get into it now to add this indicator to your chart you want to go to trading View and then open any trading security that you like
in any time frame for me I'm going to be using the 15minute time frame of CAD CHF next you want to click on indicator and type in top G and you want to select this one called top G indicator by big Beluga now you may be thinking but what exactly is this indicator well the top G indicator by big Beluga is a technical analysis tool designed to assist Traders in identifying potential IAL Market tops and bottoms its Simplicity and focus on Market extremes makes it particularly useful for Traders looking to time entries and exits in
trending or ranging markets as you can see it's a super simple indicator which is made up of the following components first of all we have the trend Channel at the top of the channel we have the upper band and then at the bottom we have the lower band and then at the center of it we have the midline these bands serve as key reference points for analyzing price movements they can be used to identify potential areas of support and resistance helping traders to decide whether to enter or exit trades with greater confidence when the price
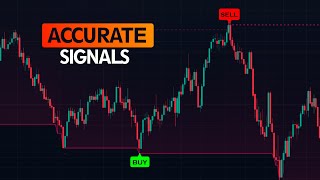
approaches the upper band it may indicate overbought conditions and a potential reversal or resistance Zone conversely the lower band signals oversold conditions and potential support the midline serves as a dynamic equilibrium helping Traders gge whether the market is strongly trending or consolidating with in a Range now the main components of this indicator are the top and bottom labels this is the top label and this is the bottom label whenever you see this it basically means that the market is likely reaching a high probability top or an overbought Zone it signals a potential reversal to the
downside making it a good point to consider exiting long positions or entering short positions this label is based on price action dynamics that indicate Market exhaustion or resistance on the other hand at the bottom we have the bottom label marked with the G sign this indicates a high probability bottom or an oversold Zone it signals a potential reversal to the upside making it an ideal point to consider entering long positions or closing short positions this label reflects conditions like low volatility or momentum shifts suggesting that the market may be preparing for a rebound and then
we have this carrot and this inverted these are called intermediate signals this one indicates potential bottom areas but with less certainty than the G labels these are secondary signals useful for Traders monitoring for reversal opportunities on the other hand this signal identifies a potential top area but again with less certainty than the top label providing additional context for Traders who are trading in range bound markets now how can we use this indicator to trade well I'm going to tell you but before we do that let's take a look at the set of it and see
how customizable it can be on the input tab we have the length with a default value of 150 this determines the number of bars or periods used to calculate the indicators range and dynamic bands a higher value like 150 results in smarther bands with fewer signals as it captures a longer term view of the market on the other hand lowering this value makes the bands more sensitive to recent price changes generating more signals but potentially increasing noise and then here we have an option to change the main color of the indicator for me I'm going
to change it to this bright pink for better visibility the length is going to remain at 150 and then on this tile tab I'm going to disable the midline for a cleaner look after that click okay next let's add the macd indicator so we can cross check the strategy double click on it so we can open the settings uh on the style tuab you want to disable the macd line as well as the signal line options after that click okay now that we've set everything up let's go over the conditions for taking positions now the
idea behind this strategy is to use the top G indicator to identify Market tops and bottoms now before we take positions at these tops and bottoms we will look for divergences on the macd indicator as extract Confluence now for a long position you first of all want to identify a bullish Divergence on the macd this unique type of Divergence requires three things first you want to look for your initial macd low for in a clear trough and then let the macd histogram move upward and create several green bars after that the histogram must form another
macd low with a series of red bars you want to ensure that the first macd low is lower than the second macd low confirming a bullish Divergence now on the chart you want to draw a line from the middle of the first Mach D low to the middle of the second Mar d low and compare this to the price if the price creates lower low lows while the macd shows higher lows this indicates a Divergence now within the Divergence you want to look for a G label signaling a potential Market bottom and further increasing the
odds of an upward move now once you see the macd histogram turn green again indicating bullish momentum you enter a long position place your stop loss right under the lower band set your take profit two times the risk let the trade run and in this example it turned out profitable now how do we take a short position well it's going to be the opposite of what we did here now condition number one is you want to identify a bearish Divergence here as you can see I've drawn it and this is the explanation the macd created
two highs with one low in between the first high was higher than the second High which means while the price was creating a higher high the MD was creating a lower high giving us a Divergence looking at this we can see it's the exact mirror opposite of the bullish Divergence that we used for the long position once we have the Divergence we need to Mark the beginning of it all the way to the end of it and then in between these two lines we need to look at the price and see if there is at
least one top label printed right here we can see that we have multiple top labels printed indicating that the price may be overbought and due for a bearish reversal once this is confirmed we just wait for the macd histogram to shift to Red to Signal an increase increase in bearish momentum we take a short position stop loss above the upper band The take profit is going to be set at two times the risk let the trade run and as you can see it was profitable in summary the top G indicator by big Beluga identifies Market
tops and bottoms using Dynamic bands and labels paired with macd divergences it helps Traders spot high probability reversals and execute trades with clear entry stop loss and profit targets well that's been it for this video I really hope you found some value if you did remember to leave a like or even consider subscribing to stay tuned thanks for watching see you next time
Related Videos

9:28
This Oscillator Tells You Exactly Where To...
PineTrades
149,547 views

13:41
Liquidity Sweep Filter: The Most Powerful ...
PineTrades
23,772 views

10:32
This Indicator PREDICTS Market Bottoms wit...
Data Trader
142,630 views

5:22
Trade PERFECT Fibonacci Setups Every Time ...
LuxAlgo
41,583 views
11:17
THIS Trend Indicator ALSO Measures Trend S...
PineTrades
40,316 views
11:17
Premium Indicator, Now FREE! 99% Accurate ...
PineTrades
285,143 views

21:49
Convert TradingView Indicators into Strate...
Michael Automates
1,026,610 views
9:20
New Scalping Indicator With Accurate Buy A...
Bitmoni
30,868 views

13:48
How To Learn Any Skill So Fast It Feels Il...
Justin Sung
1,450,478 views
7:39
11 Moving Averages In One! THIS Oscillator...
PineTrades
64,177 views

28:37
🔴 This Trading Hack Makes PROs RICH (Insa...
Trader DNA
67,652 views
12:42
1 Indicator, 3 Uses! Most Powerful Trading...
PineTrades
559,175 views
20:00
🔴 STRENGTH INDEX Trading (Say BYE-BYE to ...
Trader DNA
234,204 views

11:28
5 TradingView Indicators I’d NEVER Share P...
Magic Indicator Strategies
45,529 views

5:49
Claude 3.7 goes hard for programmers…
Fireship
1,442,824 views
12:21
This 1 Indicator Identifies Both Momentum,...
PineTrades
82,215 views

14:26
Google Changes Coding Forever by Making Ge...
Gary Explains
93,945 views

7:30
The Most Accurate All-In-One Trading Toolk...
PineTrades
96,454 views

19:26
My Scalping Strategy is Boring, But Makes ...
Scarface Trades
184,226 views

16:55
🔴 The MOTHER of All Indicators (Dangerous...
Trader DNA
324,390 views