Best Multi-Time Frame Trading strategy Smart Money Concpets
221.88k views2395 WordsCopy TextShare
Smart Risk
In this video, we are going to show you a trading technique that combines multiple timeframes to get...
Video Transcript:
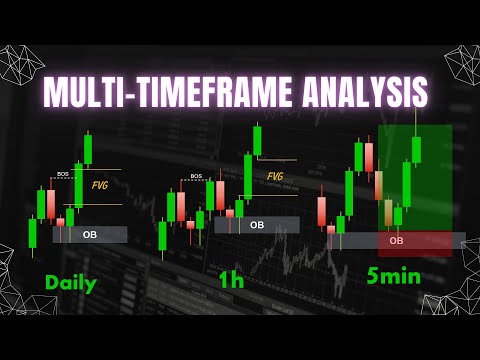
hey guys in this video we are going to show you a trading technique that combines multiple time frames to get a well-informed trade execution with smart money Concepts if that's something you're interested in as always make sure to hit the like button to show your support and subscribe to our Channel if you're new see you after the intro and [Music] [Applause] [Music] disclaimer the process of executing a successful trade begins with analyzing the higher time frames and zooming into the lower details to identify trading opportunities there are three types of time frames each serving a
specific purpose firstly we have higher time frames such as weekly and daily which we use to determine the overall Market Direction and identify key levels secondly we have analysis time frames where we conduct most of our analysis including applying Concepts such as identifying Market Direction fair value gaps order blocks liquidity areas and potential trading opportunities finally we have entry time frames of 15 minutes and 5 minutes where we seek confirmations before entering the trade as we begin our analysis on the 1-hour chart our initial step is to outline the market structure schematic to understand the
market Direction and structure this schematic is sketched from the lowest point to the highest points of visible swings for example here this could be the schematics of Market structure swings for this pair now you can also draw some internal structures onto the chart as well however the primary objective of sketching a schematic is to observe the recent movements of bulls and bears in the line chart to get a clearer understanding of who is in control every reaction to a certain price level could be considered a swing however the strength of a price movement is determined
by the distance it has pushed the imbalance and the rejections through Wicks now in order to make the schematic drawing non-subjective we have specific rules for identifying the major swings through which we obtain the General market Direction via these levels let me walk you through how we identify these major swings here we see a sharp bearish movement establishing a low which we mark on our schematic to identify further swings we wait for the price to break and close below the previous Market structure the peak point between these consecutive lows becomes our major high now we
can accurately draw the schematic these lines represent the major swings while anything between them constitutes internal structure it's important to note that our Trend identification primarily relies on these major swings following this we wait for the price to either break the high to the upside or the low lower low to the downside once again the peak point between these consecutive lows becomes our major High next we can see that the price has broken the swing High to the upside this indicates a shift in the market structure because the sellers have failed to hold this level
and now the buyers have taken control so we have a new high subsequently the price breaks this High to the upside therefore the lowest point between these highs is considered our major low as I mentioned these are considered the major swings that our directional analysis relies on anything between them is considered the internal structure or minor swings but sometimes they can also provide valuable trading information and opportunities for example here this marks the beginning of the latest bearish impulsive movement however the origin point of this imbalance is these candles so the supply order block is
located here and if the price returns to the this level it could offer a great trading opportunity on the other hand if the price manages to break above this extreme Supply level it indicates a significant loss in bearish momentum which could signal a potential Trend change here we have gold on the 4-Hour chart this is the latest Market structure schematic if we bring the schematic to the side this Market structure is exactly what we are looking for when we want to trade a clear Market structure movements with obvious Direction and swing points now we can
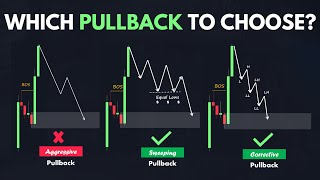
apply the smart money Concepts to find Opportunities to go long with the dominant bullish direction or if the price breaks the latest swing low to the downside we can take short entries until we reach the next important key demand area on the contrary look at this chart this is the latest Market structure schematic the market is continuously validating the major swing highs and lows to both sides leaving us with no clear Direction this is the time when we have to stay away from the market until we get a clear bias knowing when not to trade
is as important as identifying the right time to execute one also always pay attention to upcoming major news because they will significantly impact the price without regard to technical situations if you're curious about how we stay updated on financial news and fundamental analysis well we rely on fastb one of the best trading websites with various useful trading tools this site provides one of the most accurate and detailed economic calendar a tool we use every day before starting our technical analysis 247 economic live streaming also allows us to stay informed about the latest trading world's news
and fundamental analysis so if you want to benefit from multiple trading tools that can significantly improve your trading make sure to check the link in the description so when discussing a proper multi-time frame analysis the initial step is to open the chart in the the analysis time frame and sketch out the most recent Market structure so obviously we have a moving downtrend in the dollar yen in 1 hour chart the next step is to zoom out to the higher time frame such as weekly and daily to observe the larger scale we do not want to
complicate our trading we only use the daily time frame to determine the overall Market Direction and identify key levels we determine the overall Market direction to see if our lower time frame analysis is aligned with the higher time frame bias or not not secondly we identifi daily key levels to see how much room we have before price tapping into a key level of support or resistance this also helps us to determine our higher time frame Target so here on the daily time frame what do we have in terms of price action the market was in
a long-term downtrend until it broke the trend line to the upside after rejecting this key area of support three times we also have a change of character that shows the buyers have taken control and the price might start a counter Trend we can also witness that the price has recently rejected this area of resistance right now we don't have a clear bias because this order block can cause a reversal we have to wait for the next moves in the market if the price breaks this Supply area to the upside it shows that the buyers have
taken control and we can go long until we reach the next Supply Zone in front of the price on the contrary if the price breaks below this demand Zone it shows that the sellers have taken control and we can look for short entries until the price reaches this demand area as much as the higher time frames are important executing trades is done in the lower time frames like 15 and 5 minutes combining the lower time frames with the analysis time frames is primarily for finding trading setups entry reason and Confirmation usually if we Mark our
Trading Zone in the 4 Hour and 1 hour we look for entering the market in the 15 minutes and 5 minutes respectively here on the AI dollar 1 hour time frame the schematic of the latest swings does not show a visible Trend so let's see what we have in the 4-Hour time frame here on the 4our chart we can see a very smooth bearish Trend if we draw all of the visible swings now let's apply the smart money Concepts to this chart here we have a mitigated fair value Gap area that pushed the price lower
recently if we focus we can mark this major level of Market structure that has acted as both support and resistance multiple times recently so we have lots of liquidity above this area we also have an unmitigated order block which is a great Supply area to look for short opportunities but we cannot Place trades at this order block because first of all this is a very large Zone to place a trade second the market shows a sign of indecision by failing to break this level to the downside so a perfect idea would be to zoom into
the lower time frame to look for confirmation to go short and enter the market at a better price you could use various trading setups in the lower time frames but as always make sure to back test your trading strategy enough to assess its performance and gain the required confidence to trade step we use the trader Edge platform for back testing our exclusive trading strategies if you're interested in using Trader Edge as your back testing tool be sure to check out the link in the description below as we mentioned earlier this is a 4-Hour Zone so
we need to zoom into the 15 minutes to execute the trade if we get the opportunity here on the 15 minutes we have a double toop reversal pattern rejecting this area we have a drastic bearish move to the downside that created an imbalance now this is the confirmation that we were looking for it shows that the sellers have entered the market and pushed the price lower so it signals a possible reversal but if we enter the market right now our stop will be too large so we need to wait for some sort of a pullback
to enter at a better price even if we take the four bullish candles before the DraStic move as our supply Zone we would still have a great risk to reward ratio trade our Target is this demand area in front of the price and our stop loss needs to be protected above this double top if the price breaks and closes above the double top this means that the seller has failed to push the price lower from the 4-Hour Supply Zone and we would close our trade with losses so let's see what will happen of course this
trade has happened in the past data but the key Point here is that even if it ended up losing still it was a great trade since we have combined multiple price action signals like the pieces of a puzzle to determine the next movements of the market we identified that the higher time frame direction is bearish we marked our supply Zone and waited for the price to enter it we waited for the price to show a bearish momentum and executed the trade based on measuring risk to reward here on the Dow Jones 1hour time frame we
observe a bullish Trend the market continuously forms higher highs and higher lows but where can we enter the bullish Trend as smart Money traders the first thing we look for is the fair value Gap by applying the Fibonacci retracement tool we can observe that this fair value Gap is precisely located between the 61.8% and 78.6% retracement levels therefore if the price returns to this area we can zoom into lower time frames to seek confirmation to enter a long position so let's scale down to the 5-minute chart to observe the price action here on the 5-minute
chart we observe a very strong downtrend the market has rejected the demand area with a double bottom reversal pattern but we still have no entry reason to go long we identify a fair value Gap area and a robust Supply Zone ahead of the price which could continue to drive the price downward therefore the change of character occurs when the price breaks breaks above the supply area at this point we can assert that Supply is no longer in control and the market may continue to move higher in line with the higher time frame but how do
we enter the market we await the next moves to create a fair value Gap and designate the candle that generated the imbalance as our demand area we initiate a long position with a spread size above the order block and place our stop loss below the swing low let's observe the Market's Behavior here the market has formed another order block without canceling the first trade we open another long position as the price could still return to this area and activate our order however it's important to note that this means the second trade may end up in
a loss let's monitor the situation this time the second trade has been executed and resulted in a winning outcome remember it's vital to understand the significance of risk management in trading one key principle is to limit the amount of capital you risk on any single trade to around 2 3% this means that even if a trade goes against you it won't severely impact your overall account balance by adhering to this rule you're protecting yourself from significant losses that could jeopardize your trading Capital remember the goal is not just to make profits but also to preserve
and grow your Capital over the long term consistently risking only a small portion of your cap Capital ensures that you have the opportunity to recover from losses and continue trading with confidence ultimately practicing effective risk management is a fundamental aspect of achieving success in the financial markets so guys that's it for this video I hope this video provided value to you if it did please go ahead and smash the like button to show your support and if you're new here consider subscribing to our Channel see you in the next episode
Related Videos
22:15
Multiple Timeframe Secrets You're Not Supp...
Rayner Teo
652,553 views

15:49
Best Top Down Analysis Strategy - Smart Mo...
Smart Risk
1,608,251 views

16:44
Order Block Simplified - Smart Money Course
Smart Risk
773,848 views

38:40
Multiple Time Frame Trading Is Hard, Becom...
The Trading Channel
354,718 views

39:19
Support And Resistance Didn't Work Till I ...
Rayner Teo
1,653,909 views

17:23
Best Fair Value Gap Trading Strategy
Smart Risk
490,543 views

13:39
My Incredibly Easy Scalping Strategy To Ma...
Riley Coleman
153,597 views

17:46
Simple and Profitable Top Down Analysis ST...
The Trading Geek
498,092 views

14:16
My Incredibly Easy Scalping Strategy To Ma...
Garland Trader
78,013 views

11:14
STOP Using the Heiken Ashi! This Indicator...
Data Trader
715,857 views
14:26
Best Pullback Trading Strategies In Forex ...
Smart Risk
532,882 views

14:07
Ultimate Smart Money Trading Guide
Smart Risk
113,114 views

55:11
The ONLY Candlestick Pattern You'll EVER N...
Ross Cameron - Warrior Trading
710,727 views

14:55
Transform Your Trading with This Proven Or...
Smart Risk
102,635 views

28:30
Multi Time Frame Analysis ( Non Complicate...
ETM FX
27,919 views

22:00
Smart Money Trading: Top Entry Strategies ...
Smart Risk
421,444 views

14:12
Smart Money Concept for Multi Time Frame T...
FOREXSOM
87,438 views

28:33
This SMC SNIPER Entry Strategy Will Make Y...
The Trading Geek
256,053 views

20:46
ABC Of Multiple Timeframe Analysis
Solomon King
27,200 views

15:17
Best 1 Hour Day Trading Strategy (Advanced...
Smart Risk
383,532 views