DAN ZANGER | Breakout Trading Strategies | World Record Returns!
218.42k views1486 WordsCopy TextShare

Financial Wisdom
DAN ZANGER Made world record returns through numerous breakout strategies against many popular chart...
Video Transcript:
today we take a look at the world record holding trader dan zanger although not an author dan is very highly regarded and has appeared in numerous literatures he also produces the zanga report on the website chartpatten.com dana however gained notoriety for record holding returns when he turns just over ten thousand dollars into 18 million dollars in under two years his returns hit the media spotlight soon after the performance was audited and proven through his irs records let's take a look at how dan achieved such gains and learn from the method which he continues to use
to this day and please if you find value don't forget to subscribe and hit the notification bell to see all our future videos dan was raised in the san fernando valley of los angeles he later began college but dropped out to eventually become an independent contractor building swimming pools throughout california in 1997 dan sold his car for eleven thousand dollars with the sole goal of using the capital to become a full-time stock trader he soon created millions from his investment and left contracting behind for good in the years prior to making his fortune dan studied
the works of william o'neill cementing a bias towards specific chart patterns accompanied by increases in volume dan himself said over the last 25 years i've spent over 30 000 hours studying every type of chart pattern formation imaginable from cup and handle patterns to falling wedges ascending triangles bull and bear flags and too many others to list here now and lucky for us these patterns repeat over and over and over again recognized primarily as a momentum trader dan applied his strategy during the tech bubble era whilst applying considerable leverage the results he achieved were audited by
a company called efron we can see here a letter dan received from efron confirming his results the audit confirmed an astonishing return of 29 223 this dwarfed the s p 500 index return of just 23 percent over the same period clearly returns of this magnitude do not come without significant risk but just how much risk did dan take how close was he to blowing up his trading account when asked about risk dan is quite vague although in october 2000 his accounts dropped by as much as 32 percent in one day and at one point during
a bear market his portfolio had a drawdown of 75 to say he is more of an offensive rather than defensive trader is probably accurate although when asked about managing risk dan said if a stock doesn't accelerate quickly out of a basing area then i'll sell the stock promptly during that first day i'll do this even if i've been in the stock for only 20 minutes regardless of profit or loss at that time if a stock isn't moving up sharply right away then the trade must be wrong additionally when asked about selling a more mature position
dan said i never use trailing stops but i will sell a position of strong stocks moving up quickly or for long periods of time this would imply the use of mental stops as opposed to entering a firm stop-loss order into the market in essence dan relies heavily on discretionary decisions when it comes to managing positional risk such an approach requires immense discipline let's move on to the specific chart patterns dan uses to find what he calls explosive stocks the first chart is from the company internet capital group and shows the trades made by dan during
his world record return the patterns he often looks for and recognized in this example were areas of consolidation the stock was an initial public offering back in august 99 trading at 30 dollars per share a couple of weeks passed and dan noticed a small descending trend line forming the price soon broke above and he quickly took a position dan sold his position as soon as the stock lost its upward trajectory several weeks later the stock formed a horizontal trendline and once again dan entered at the break the stock continued its surge before losing its momentum
at over 190 dollars per share dan saw the shift in momentum and again sold his position true to form the stock consolidated again for several weeks into what dan called a high-level symmetrical triangle dan entered a position on the break and sold on the first considerable sign of a change in momentum these chart patterns were typical examples of the type dan traded throughout the two-year period and when asked how many trades of this type he took dan said there were so many of them in that two-year period it's impossible to remember all of them it
must have been at least 200 trades or more another stock dan bought over the same period was an internet company called ask jeeves dan described this setup as a very bullish flag pattern commonly known as a bull flag and is unsurprisingly described as such due to its resemblance to a flag in this example dan saw a consolidation in price over a seven day period followed by a surge through the resistance line he bought shortly after the break and watched carefully for obvious signs of a trend reversal the price continued its upward trajectory and tripled in
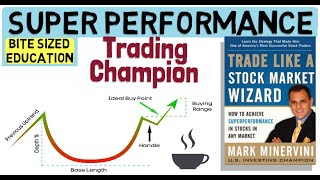
price to approximately 190 dollars per share the price eventually lost all its momentum and then sold his entire position bullish flags like this are known to be one of the most reliable continuation patterns available to get a better understanding of dan's trading strategy we look at nine of his golden trading rules the first rule is to ensure the stock has a well-formed base or pattern such as the examples we just covered next having established the trend or resistance line enter a position after the price has broken the line but do not pay more than five
percent above the breakout be quick to sell the stock should the price drop below the breakout point which down alludes to being a five to seven percent stop loss fourth as the stock rises sell between twenty to thirty percent of a position once the stock has climbed between fifteen to twenty percent from the breakout number five hold the stocks which continue to rise and sell those that lose momentum or begin to turn down dan adds remember stocks are only good when they are moving up six keep an eye on strong industry groups and where possible
try to make your selections from within these groups seven look for reversal patterns to exit your positions dan recommends the candlestick patterns which bulkovsky provided in-depth research on as a good starting point eight volume is highly important to the success or failure of your trading decisions look for healthy volume at the point of breakout and finally dan says never go on margin until you have mastered the market charts and your emotions margin can wipe you out dan's zanga report can be accessed in the link below through a week free trial and we can see here
a list of some of his recommendations offered in the report from 2019 for those looking to dig deeper into his strategy you can check the ticker and date of selection to look at the setups in more detail from this list we can see his average return from each selection was 52 percent and his average holding time was 4.92 weeks the selections are obviously cherry picked as examples but it can give you a better idea of what to expect from some of the better performing stocks dan summarized his concept best when he said trading for me
is all about volume and price action i buy on pattern breakouts when volume is rising and as long as price is responding well to increasing volume i stay on board but when either price or volume stops rising it's time to get out let's look at the other chart patterns dan uses and reveal the obvious commonalities between each first we have the flat base pattern a consolidation and a break above resistance with increasing volume next an ascending triangle pattern a contraction in volatility and a break above resistance with increasing volume finally a symmetrical triangle a contraction
in volatility and a break above resistance with increasing volume these are just some examples of the many chart patterns dan trades but they all have the same traits consolidation volume increases lines of resistance and a breakout of resistance in summary dan created immense wealth by adopting breakout strategies at a time when the tech industry was exploding at an extraordinary rate luck genius or a combination of both i'll let you decide once again thanks for listening and please join our growing community below
Related Videos

11:13
KRISTJAN QULLAMAGGIE - Multi Millionaire S...
Financial Wisdom
486,097 views

10:02
CANDLESTICK PATTERNS by THOMAS BULKOWSKI -...
Financial Wisdom
93,338 views

11:21
Trade Like a WILLIAM O'NEIL Disciple (How...
Financial Wisdom
151,229 views

37:36
Trick To Picking Top Stocks With David Rya...
Investor's Business Daily
78,816 views

10:51
The Best Chart Patterns To Trade (Reliabil...
Financial Wisdom
150,793 views

1:23:34
259% Return in 1 Year: The Risk Management...
TraderLion
22,388 views

12:49
TURTLE TRADERS STRATEGY - The Complete Tur...
Financial Wisdom
423,190 views

22:37
MAXIMUM TRADING GAINS - Using Price, Time ...
Financial Wisdom
134,853 views

13:07
Best Trading Strategy Concept Ever? (With ...
Financial Wisdom
178,461 views

16:47
MARK MINERVINI THINK AND TRADE LIKE A CHAM...
Financial Wisdom
248,210 views
1:00:41
33,554% Return in 5 years | Trade Like a S...
Richard Moglen
444,184 views

9:16
STAN WEINSTEIN - Knowing When To Sell (Bul...
Financial Wisdom
78,259 views
15:27
MARK MINERVINI- Trade like a stock market ...
Financial Wisdom
247,252 views

9:41
5 BEST Moving Average Strategies (That bea...
Financial Wisdom
195,722 views

12:59
BEST Trading Strategy 2024? - US Champion ...
Financial Wisdom
298,621 views

1:33:10
1,379% Return in 3 years | Interview with ...
TraderLion
199,911 views

11:21
TRADE MANAGEMENT - Knowing When To Sell A ...
Financial Wisdom
122,429 views

11:18
TRADING PRICE ACTION (Validated by trading...
Financial Wisdom
323,606 views

12:41
TREND FOLLOWING STRATEGIES (The Trend Foll...
Financial Wisdom
160,010 views

59:34
Mark Minervini: Selling Into Strength And ...
Investor's Business Daily
113,832 views