Evidence That We Live In An Ice Age Termination Event!
171.87k views2476 WordsCopy TextShare
Insane Curiosity
In this video, we're delving deeper into a mysterious anomaly that has captured the attention of sci...
Video Transcript:
EVIDENCE That We Live in an Ice Age Termination Event! Intro Welcome to Insane Curiosity. In this video, we're delving deeper into a mysterious anomaly that has captured the attention of scientists worldwide.
In 2006, something remarkable happened. They noticed an unprecedented spike in a key greenhouse gas, methane, saturating our atmosphere. This wasn't just any spike; it was a departure from the norm.
You see, throughout Earth's history, ice age termination events have been marked by significant surges in methane levels. But here's the catch - these spikes were typically separated by vast expanses of time, often over 100 thousand years. What we're facing now is something altogether different, and frankly, quite perplexing.
It's been a mere 12 thousand years since the last surge, a blink of an eye in geological time, and nobody can explain how that was possible. Should we worry? Let’s find out.
Quaternary Period In order to understand what is actually going on, we need to explain the period we live in. Before we dive deeper into the methane anomaly and its implications, let's set the stage by journeying back in time to an epoch known as the Quaternary period. This span of Earth's history, which began around 2.
6 million years ago, encompasses the era of ice ages and modern biodiversity as we know it. During the Quaternary period, our planet was teeming with a diverse array of exotic animals, many of which might seem quite outlandish compared to the species we're familiar with today. Giant ground sloths, massive mammoths, saber-toothed cats, and even formidable woolly rhinoceroses roamed the lands.
Now, within the Quaternary period, we find two significant epochs: the Pleistocene and the Holocene. The Pleistocene, often referred to as the 'Ice Age,' spanned from about 2. 6 million years ago to a mere 12 thousand years ago.
This epoch was characterized by recurring glaciations, vast ice sheets, and dramatic shifts in climate. And then came the Holocene, which began around 12 thousand years ago and continues to this day. This epoch marked a pivotal moment in Earth's history.
The climate became more stable, and the ice sheets receded, allowing for the emergence of modern ecosystems as we know them. But here's where things get truly remarkable. The Holocene also saw the rise of a new player on the global stage: us, Homo sapiens.
This is the epoch where human civilizations began to flourish. --- Glacial, Interglacial Periods, and Termination Events So, from about 12 thousand years ago up until today, we've been in a special phase of Earth's history. This is when most of the ice sheets retreated, revealing more of our planet's surface.
Technically, we're still in an ice age, but it's like we're in the tail end of it, where ice doesn't dominate the landscape anymore. We call this part the 'interglacial period,' a time of relatively stable and warmer climate compared to the chilly glacial periods when large portions of Earth were covered in ice. This shift to a more stable climate paved the way for major leaps in human development.
Agriculture took root, and the societies we recognize today began to take shape. Now, let's tackle something that might seem a bit puzzling at first: ice age termination events. You see, both the glacial periods and the interglacial periods are phases within an ice age.
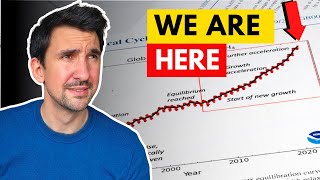
That means the transitions, the ice age terminations, also fall under this big umbrella. It's a bit of a head-scratcher, I know, but hey, that's science for you, right? --- Now, as we zoom in on one of these termination events, a fascinating journey unfolds, revealing distinct phases that researchers have tirelessly explored for decades.
Today, we've gained a deeper understanding of this process. So, let's dive straight in! Phase One: Deglacial Onset The Deglacial Onset marks the initial phase of an ice age termination event.
This pivotal transition is primarily attributed to the well-known Milankovitch cycles - cyclical variations in Earth's orbit around the sun. These cycles play a profound role in shaping our planet's climate. Now, let's delve into the specifics.
Milankovitch cycles encompass three key elements. First, the oscillation of Earth's axial tilt. Imagine Earth as a colossal top, gradually swaying back and forth over thousands of years.
This tilt is like a planetary dance move, affecting the way sunlight hits different parts of our globe. When the axis tilts more, the polar regions receive greater exposure to the sun's rays. This increased exposure leads to a higher influx of solar radiation, and subsequently, a more rapid melting of ice.
As you can understand, it is a delicate balance of nature, and even the subtlest shift in this axial tilt can bring about significant changes in our climate over the course of millennia. Next, we have eccentricity. This term refers to the shape of Earth's orbit around the sun.
It's like a stretch or squeeze applied to the circular path we might imagine. When eccentricity is higher, the orbit becomes more elongated or elliptical. Conversely, when eccentricity is lower, the orbit is closer to a perfect circle.
This subtle change in orbit shape directly impacts the amount of sunlight that reaches Earth's surface. When the orbit is more elongated, Earth spends part of its journey closer to the sun and another part farther away. This means that at certain times of the year, our planet receives more intense sunlight, while at other times, it receives less.
It's important to note that these changes happen over incredibly long time frames, spanning thousands of years. They contribute to the complex dance of Earth's climate, influencing periods of warming and cooling that scientists study to piece together our planet's climatic history. Finally, let's explore precession.
This term refers to a subtle wobble in Earth's rotation, somewhat like the wobble of a spinning top. This unique phenomenon has a notable impact on the timing of our planet's seasons. As Earth spins on its axis, this wobble causes a gradual shift in the orientation of our planet in space.
This means that over thousands of years, the position of the North and South Poles has changed in relation to the stars and the sun. The cycle of this wobble takes approximately 23 thousand years to complete. This long-term gyration contributes to variations in the Earth's climate over these extensive time frames.
So, in a nutshell, the Deglacial Onset is set in motion by these Milankovitch cycles, orchestrating a symphony of climatic shifts that pave the way for significant changes on our planet. Now, before moving on, let's take a moment to grasp an essential concept about colors. As you likely know, white objects have the ability to reflect a significant portion of the incoming light.
This property allows a white object to maintain a cooler temperature, as it absorbs less radiation. That's why, in the heat of summer, you might choose to wear light-colored outfits. On the flip side, black surfaces absorb a majority of sunlight and only reflect a small percentage back.
This knowledge is crucial in understanding the Deglacial Onset and the subsequent surge in heat on Earth. Picture our planet like a canvas: the white expanse represents the poles and ice. As this ice diminishes, darker areas emerge, absorbing and retaining heat more efficiently, leading to a rapid increase in temperatures.
As the heating process intensifies, Earth moves into the second crucial phase of an ice age termination event: the full deglaciation period. Phase Two: Full Deglaciation Period During this phase, we witness an even more substantial melting of ice caps, leading to a corresponding rise in sea levels. To put it in simple terms, roughly 50 percent of the increase in sea level can be attributed to ice melt.
Picture this scenario: you have a glass of water with an ice cube. Leave it on the table long enough, and you'll notice the ice cube melting, causing the water level to rise. But what about the remaining 50 percent?
Well, just like metals or any other material, water expands when heated. Since 1850, the Earth's surface temperature has, on average, risen by about 1°C. This rise in temperature, a result of climate change, leads to the warming of seawater, causing it to expand.
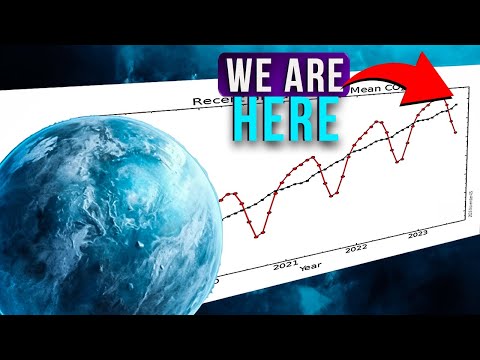
This expansion contributes to the increase in sea levels. Additionally, the discharge from land-based water bodies could be another factor, although the extent of its impact on sea-level rise remains somewhat uncertain. Space agencies all over the world have sent some satellites to space in order to study sea level rise over the years.
For instance, Sentinel-3 is a series of Earth observation satellites, sort of like high-tech space cameras, designed to keep a watchful eye on our planet. These incredible machines are part of the European Space Agency's Copernicus program, a global effort to monitor Earth's environment. One of Sentinel-3's superpowers is its ability to measure sea levels with incredible precision.
It's like having a super-accurate ruler from space. So, how does Sentinel-3 do it? Well, it uses something called altimetry.
This fancy term basically means it measures the height of the sea surface from space. It does this by sending out signals and timing how long it takes for them to bounce back. This helps scientists create detailed maps of our oceans and track changes over time, like the one you see in this plot!
As we step into Phase 3, known as the Interglacial Period, a remarkable phenomenon unfolds. --- Hey! Before moving on, be sure to like or dislike the video, so that we can improve it for YOU the viewer.
Plus, Don't forget to subscribe to our channel by making sure to hit the NOTIFICATION BELL, so you don't miss ANY of our daily videos! --- Phase Three: Interglacial Period With rising temperatures, the once ice-covered expanses now give way to flourishing vegetation. These newly thriving plants act as nature's carbon-absorbing machines, drawing CO2 out of the atmosphere.
Over time, this carbon dioxide level naturally diminishes, as it's locked away in sediments and deposits. It's a stabilizing process, aimed at mitigating greenhouse gases like CO2 in the atmosphere. This dynamic has been ongoing during the Holocene, the interglacial period we find ourselves in today.
So, the question arises: why are we observing a surge in methane? Typically, this phenomenon occurs during Phase One of an ice termination event, yet here we are in Phase Three. What could possibly be at play?
--- Methane Map Explained Methane, a molecule well-known to astronomers, even makes appearances high in the skies of distant planets, like Mars. But it's not just a cosmic curiosity. Methane plays a crucial role in life here on Earth.
It hides beneath the surface, a hidden treasure in the Earth's depths, and can be unearthed from the remnants of ancient plants and animals in places like swamps and wetlands. Once released into the atmosphere, methane lingers for up to a decade before radicals break it down, forming CO2 and water. In your very own kitchen, methane comes into play when you fire up your stove using natural gas.
It flows through the pipes, ready to assist in cooking delicious meals. And that's just the beginning! " Cows, goats, and yaks, while they may appear innocent while grazing, hold a secret.
These seemingly harmless grazers are responsible for a significant environmental concern. They release a whopping one-fifth of the world's methane emissions annually. This methane, a by-product of the bacteria in their digestive systems, adds to the challenge.
Termites, rice paddies, swamps, and even those unassuming photosynthetic plants all contribute to this methane mix-up. Surprisingly, volcanoes, awe-inspiring natural wonders, account for less than 0. 2 percent of Earth's methane budget.
And to top it off, these volcanic emissions might just contain methane from ancient organisms. The artificial processes we discussed, while significant, only contribute a fraction to the overall presence of methane in our atmosphere. To truly understand the surge in this greenhouse gas, we require advanced tools and technologies for a thorough examination of its production.
In the coming years, we're poised to make significant strides in detecting and pinpointing the sources of methane, both on Earth and beyond. Among our most potent tools are satellites, equipped to study greenhouse gases by emitting laser beams toward the surface of our planet. More specifically, they can be directed towards Earth to directly detect methane, as this gas possesses the unique ability to absorb light at particular wavelengths.
By precisely tuning the laser to these specific wavelengths, the majority of emitted light will bounce back to the satellite. This returning radiation originates from gases in the atmosphere. However, if, during its orbit, the satellite observes a sudden and significant decrease in the laser light returning to it, it signals that something has absorbed the laser light instead of reflecting it.
This indicates the presence of methane in that specific location, as it absorbs energy from the satellite. Conducting such studies over multiple orbits allows us to create a comprehensive map of methane sources across our planet, like this one. Recent studies using advanced mapping techniques have shed light on the sources of increased methane levels in our atmosphere.
Surprisingly, the majority of this rise can be attributed to natural factors, rather than human activities. While human-made oil and gas facilities in Turkmenistan release significant amounts of methane, exceeding 50 thousand kilograms per hour, they account for only a fraction of the observed increase. A substantial portion of the heightened methane levels originates from wetlands and tropical regions.
This surge can be attributed to the accelerated growth of plants, spurred on by the rise in CO2 levels. The hastened decomposition of these thriving plants releases a substantial amount of methane into the atmosphere. A parallel process unfolds as permafrost thaws, leading not only to rising sea levels but also to the liberation of trapped organisms.
These freed entities are then exposed to higher temperatures, accelerating their decomposition and subsequently releasing even more methane. In conclusion, while human-induced methane emissions have indeed risen in recent years, they only constitute half of the observed methane increase. The remaining portion is attributed to natural biogenic processes.
Understanding and addressing both sources of methane is of critical importance in mitigating the greenhouse effect. Developing methods to reduce the presence of this potent greenhouse gas, whether it emanates from human activities or organic matter decomposition, is a crucial step towards a more sustainable future. By combining efforts to curb human-made emissions and implementing strategies to manage natural methane sources, we can work towards a more balanced and environmentally conscious approach to greenhouse gas reduction.
--- Hey! This video ends here. Thanks for watching.
Do you think this methane increase will turn out to be just another harmless anomaly or is it something to worry about? Let us know in the comments below. I’ll see you next time on the channel!
Related Videos
18:07
New Evidence We Are Entering An Ice Age Te...
Dr Ben Miles
3,708,448 views

18:34
Catastrophe and Cartography - Ice Age Floo...
Peter Zelinka
2,285,084 views
10:54
The Last Time the Globe Warmed
PBS Eons
8,925,680 views

16:39
How 2023 Broke Our Climate Models with Nei...
StarTalk
2,273,418 views

16:06
What Will the Solar Maximum do to Earth in...
Astrum
1,707,575 views

14:18
How Milankovitch Cycles Are Causing Earth’...
Insane Curiosity
670,932 views
15:28
The Geography of the Ice Age
Atlas Pro
5,698,731 views
11:13
This Well Known Effect Breaks the Climate ...
Jordan B Peterson Clips
2,638,928 views

13:03
Is Earth's Largest Heat Transfer Really Sh...
PBS Terra
1,793,344 views
11:35
What the Hockey Stick missed about climate...
Simon Clark
1,151,786 views

50:48
Only the Bible Can Explain the Ice Age
Creation Ministries International
371,983 views
16:28
What the Upcoming Geomagnetic Reversal Wil...
Astrum
2,428,035 views

16:10
What the Polar Vortex Will Do to Earth thi...
Astrum
4,097,425 views
15:28
Is an Ice Age Coming? | Space Time | PBS D...
PBS Space Time
4,927,867 views
14:01
Within This Century Climate Change Will Gi...
Insane Curiosity
30,246 views
13:03
This Geological Fault Is More Dangerous Th...
Insane Curiosity
163,989 views

49:12
Why Did The Earth Totally Freeze For 100 M...
History of the Earth
2,843,924 views

4:29
The Milankovitch Cycle Timeline: Where are...
It's Just Astronomical!
496,017 views
18:14
Killer Asteroid Coming In 8 Years: How Wor...
Insane Curiosity
38,078 views
22:14
This Will Be My Most Disliked Video On You...
Astrum
3,667,139 views