Illumina Sequencing Overview: Library Prep to Data Analysis | Webinar | Ambry Genetics
184.35k views7061 WordsCopy TextShare

Ambry Genetics
For more information about genetic testing, visit https://www.ambrygen.com/
To register or see our o...
Video Transcript:
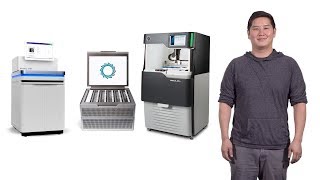
dr scott westenberger and scott is a staff field application scientist with over 10 years in biotech industry supporting next generation sequencing and microarray devices and over 20 years of experience of molecular biology and genetics research scott is a specialist in clinical oncology focusing on supporting clia laboratories running ngs in vitro diagnostic devices and lab developed tests as well as pharma and contract research organizations engaging in translational research clinical trials and companion diagnostics he received his phd from ucla in 2006 in microbiology immunology and molecular genetics he received his postdoc at the scripps research institute in
san diego focused on parasite genomics and novel anti-malarial drug screening we're very happy to have scott joining us today and i will pass it over and let him get started all right well thank you very much for that introduction and i really appreciate the opportunity to present as part of your educate next series so today i'm going to be giving you a introductory overview of the illumina sequencing process from library prep to data analysis so the objectives for this training session is that we want to review the major steps in the illumina sequencing workflow that
includes library preparation cluster generation sequencing and data analysis and we're also going to go into an in-depth discussion of the differences in the chemistry as the technology has evolved over the last few years including differences in the sbs or sequencing by synthesis process involving the four channel two channel and one channel chemistries so the overall illumina sequencing workflow can be broken down into these four major steps the first is library preparation that's taking your genomic dna or rna and converting it into an illumina adapter ligated library then that happens again prior to using our instrumentation
then on the instrument those libraries will go through a cluster generation process to amplify those dna fragments then perform sequencing by synthesis and then finally the data analysis so let's give a high level overview of library preparation so there are a wide array of different library preparation kits available from illumina or other third-party vendors that will work on illumina systems as these are sort of open systems research use only as well as some of our ivd assays for the next seek dx and mycdx are still forthcoming but the overall goal of library prep is to
have small dna fragments with alumina adapters ligated on either end so the diagram that i'm showing here is the basic illumina library prep construct so regardless of whether your starting material is whole genomic dna or rna that's been converted into cdna or pcr amplicon products or enriched regions of the genome that you've targeted with a particular library prep those small fragments are going to need to be adapter ligated or included through a pcr based process and then an overall pcr amplification in order to produce the construct depicted below so the major portions of this library
prep construct that are essential of course is our dna insert region of interest in the middle that will be sequenced immediately flanking that dna insert region are the read one and read two sequencing primer binding sites that allow us to perform the paired end sequencing into that insert region of interest flanking those are the embedded illumina indexes or adapter barcodes as they're sometimes referred to and what we're showing here is what we refer to as a dual indexing scheme where we have two different unique index sequences embedded in either end of the molecule and then
on the very ends of the molecule are the p5 and p7 adapter oligos these are homologous to the capture oligos on the surface of the flow cells inside the illumina sequencing device so they will allow for hybridization cluster amplification and sequencing once they have been inserted into the instrument so there are so many different types of library prep i couldn't possibly cover them even multiple hours so this is just to give you an idea of what the final product would be that would be going into our sequencers so with that i'm going to move forward
with the next step so following your library preparation with of course appropriate qc and quantification to prepare the appropriate loading concentrations we will then put that library into one of the illumina sequencers to perform the automated cluster generation which is the second step of the sequencing workflow so what is a cluster well a cluster is a group of dna strands that are positioned closely together and a cluster represents anywhere from one to five thousand copies of the original dna library fragment that are contained within a very small one to two micron spot on the surface
of the glass slide flow cell so the process of cluster amplification is going to be taking a single strand of a dna library and performing a high fidelity amplification to produce a clonally amplified cluster where we now have thousands of copies that allow us to amplify the signal for the sequencing by synthesis process that happens after cluster generation you can see in the image in the upper right what it would look like if you were to examine a thumbnail a close-up view of the surface of the flow cell now what we're showing here is what
we call a randomly hybridized and cluster amplified flow cell this is the traditional alumina cluster generation process where we have a lawn of oligos and the clusters randomly seed and amplify in different positions so what is a flow cell when i talk about a flow cell it's essentially like a glass slide sandwich where we have a slide on the top and the bottom and then in between we will have separate lanes in some cases just one lane to as many as eight lanes in the case of a hiseq and inside those lanes are fluidic channels
and the surface of the glass slide is coated with a matrix in which is embedded those p5 and p7 homologous capture oligos so although this picture shows them as a nice orderly array that's not really the way it looks as they are in many different directions and orientations but very thickly coating the interior surface both the top interior surface and bottom interior surface of that glass slide allowing us to amplify clusters and image data from both top and bottom interior surface thus doubling the overall imaging and surface area producing lots of overall sequencing data so
again to touch on the differences in the evolution of our flow cell architecture over time the original model of cluster generation used a random flow cell where there was this uniform lawn of capture oligos and the single strands of the dna library could hybridize and amplify in any position now this leads to randomly spaced clusters and it accommodates variable insert sizes and shows relatively low duplication rates but it does require more image analysis to be able to identify the clusters as each flow cell run is a random amplification where we have to pick out the
signal from the noise in order to determine where the clusters have amplified and analyze the data correctly in contrast on some of our newer systems we have a patterned flow cell technology in the pattern flow cells we have a hexagonal grid of embedded nanowells where the clusters will be formed only within the wells this greatly simplifies the cluster amplification and image analysis process because we don't have to pick out the random signal from the noise in the case of the random flow cell on the left we know exactly where the clusters are and can match
those very quickly and easily for rapid data interpretation so what's the difference with pattern flow cells in use of the pattern flow cells we are able to control both the pitch and the feature size that is the distance but from center to center referred to as the pitch between one nanowell and another nanowell and then the feature size that is the uh diameter of that nanowell and through improvements in this technology we anticipate that we will be able to both decrease the pitch and decrease the feature size thus allowing more and more data to be
generated uh from these smaller features as improvements to the imaging and chemistry allow for greater and greater data throughput so on the random flow cell it requires more data analysis to analyze these randomly amplified clusters whereas the rigid registration or alignment of the images to this hexagonal grid of known positions of nanowells greatly decreases the time of what we call template generation where we have to identify those spots and pick out the signal from the noise so let's review the process of traditional cluster generation so when you go to load your library onto the sequencer
it's going to be a double-stranded library and you go through a process of denaturation with sodium hydroxide and then dilution from a nanomolar concentration down to a picomolar concentration so we're loading extremely low concentrations of single-stranded molecules onto the flow cell this is to allow enough space between the different molecules so that they will amplify and have sufficient distance between one amplified molecule and another this single stranded dna library template molecule will randomly bind to one of those p5 or p7 homologous adapter capture oligos on the surface of the glass slide we will then perform
a three prime extension with a high fidelity polymerase to make an exact copy of that initial template strand which is now going to be covalently ligated and fixed in place on the surface of the glass slide once we have that copy of the original template strand we will then denature and remove the original template strand leaving us with a single stranded copy of the original library molecule and again this is done in a random process so while most of the molecules may be separated from one another it can happen that a small percentage of molecules
hybridize and amplify right next to or nearly on top of one another this is going to be filtered out in our data analysis process using a passing filter algorithm that determines the signal purity so that any perceived clusters that have mixed signal are going to be filtered out and not used for downstream data analysis so once we have that initial copy bound to the surface of the slide we will then go through an isothermal amplification using a bridge amplification process where by controlling the denaturing or hybridization conditions with chemistry that's flowing through the channels of
the flow cell we can allow that amplified molecule to hybridize to one of the adjacent p5 or p7 capture oligos in its immediate vicinity we then again perform a three prime extension to recreate the double stranded product and the result is now we have two copies covalently bound of the single stranded templates we repeat this process by continually denaturing and then allowing for hybridization and further primer extension until we have created a amplified cluster that is identical to the original single stranded molecule again forming approximately thousands of clusters thousands of molecules in each one of
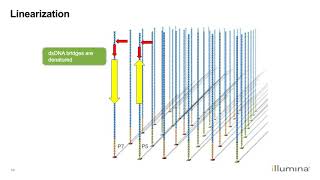
the clusters and again depending upon the instrument this can be taking place anywhere from 25 million clusters up to billions of clusters on the surface of the flow cell depending upon the instrument and the surface area of the glass slide so once we have the clonally amplified cluster in order to proceed with the next steps of sequencing by synthesis we will need to perform a linearization process because we are going to actually synthesize the complementary strand we need to cleave off and remove one of the two strands so using either a chemical uh or either
a chemical or enzymatic process depending upon the exact type of chemistry we will cleave and remove the reverse strand leaving all of the molecules in that cluster in only the forward strand orientation we will then perform blocking of adding a three prime blocking agent to the ends of the molecule and finally hybridizing our read one sequencing primer this will allow for primer extension and sequencing by synthesis through the insert region of that clonely amplified molecule so once we have achieved this cluster amplification and primer hybridization we can then automatically proceed on the instrument to the
sequencing by synthesis process so with that that will take us to the third step but in contrast i'd like to present information on our newer methodology of clustering amplification called exclusion amplification or x-amp cluster generation so again we have simultaneously launched the pattern flow cell technology together with this new methodology of exclusion amplification cluster generation whereby the xampp technology will create a clonely amplified cluster specifically within each one of those nanowells derived from an individual library molecule again we're starting with a glass slide that has imprinted nanowells in which are the grafted p5 and p7
capture oligos the libraries will hybridize and perform the bridge amplification and through multiple cycles of amplification fill up that nanowell and will then be linearized and primer hived to prepare it for sequencing so when we manufacture these pattern flow cells we are going to be depositing the p5 and p7 capture oligos only within the wells the area between the wells is kept bare and free from capture oligos so here you can see a close-up view of what that would look like again all of those are only present within the nanowell allowing us to quickly and
easily identify the position of each of the clonally amplified clusters so similar to traditional cluster amplification a single stranded dna molecule in a hybridization solution will randomly bind and become amplified within the nanowell once that library molecule binds it will very quickly go through an amplification process we have altered the chemistry so as to decrease the efficiency of hybridization but yet it dramatically increased the speed and efficiency of cluster amplification so as to limit the possibility of multiple molecules hybridizing and populating the nanowell in this way as soon as one molecule hits the surface it
will immediately begin a clonal amplification process through a proprietary process the double-stranded ends of the dna will become denatured and then re-hybridized to the adjacent p5 and p7 capture oligos and perform the simultaneous amplification of both strands using a strand displacement process they will amplify continuously until all of the available capture oligos within the nanowell are populated and utilized to create the amplified cluster this will now exclude the possibility from another molecule hybridizing and populating and creating what we call a mixed signal or polyclonal well within each one of the nanowells at the end of
that amplification our x amp process similar to traditional cluster amplification the molecules will need to be linearized and remove the reverse strand leaving only the forward strand orientation and we will hybridize our read one sequencing primer to allow for primer extension and sequencing by synthesis into the dna insert region of interest so that concludes the discussion of cluster generation now we'll move on to step three of the process which is our sequencing by synthesis again the process is automated on all of our systems and we have a wide variety of different sequencing devices from our
smallest iseq miniseq and mysqq benchtop devices our medium throughput nexseq devices to the very high throughput hi-seq and novaseq devices the overall chemistry is very similar however there are slight differences in the engineering and some of the fluorophores that are used which i'll describe here briefly but overall the process is identical on all of these systems with again the major difference being the overall throughput surface area and reads that are being generated within a particular sequencing run so let's review the traditional methodology or original methodology of sequencing by synthesis so initially when illumina launched the
hiseq and my seek this included a four channel or four color sbs chemistry wherein we had four different dna bases each one bound with a unique fluorophore so there are two that are excited by the green laser but they produce slightly different emission spectra from the peak distribution between g and t are both green wavelength fluorophores in contrast the a and c are red fluorophores but they also can be filtered for the unique emission spectra peak for each one of those bases but this requires us to collect four different images where we take the emission
from the flow cell we pass it through various filters and align those to different cameras to capture the emission spectra peak unique to each one of the four gta and c bases now this process works great however it is more time consuming relative to the newer two channel cluster generation and sbs chemistry process which only requires two images to be collected for each round of sequencing so how does the sbs or sequencing by synthesis process work we refer to sbs chemistry as going through cycles where each cycle is made up of a three-step process those
three steps are incorporation imaging and cleavage so during the incorporation step we have a mix of the four fluorescently labeled nucleotides together with the polymerase and again these are reversible terminator nucleotides so that within each cycle only one base will bind at any given primer binding site and the four bases are competing together with the high fidelity polymerase to ensure that we have a accurate incorporation of the correct base at each of the thousands of molecules within a cluster and across all of the millions of clusters on the flow cell surface once we have allowed
for the polymerase to incorporate that fluorescently labeled terminator nucleotide we will then wash away any unincorporated nucleotides and proceed with imaging this is done with either high-powered lasers or leds to excite the red and green fluorophores on the surface of the nucleotide we will then capture that emission spectra from the flow cell through the cameras and to the cameras will be capturing that in real time so it's a lot of data that gets analyzed as part of our real-time analysis process the raw data images from this imaging are analyzed and deleted immediately it would create
multiple multiple hundreds of terabases of terabytes of data if we were to keep all of the raw images so the raw images are used for the image interpretation and then deleted immediately after extracting the intensities and performing data normalization once we have captured the intensity from all of the different lanes and both top and bottom surface of the flow cell we will then use a cleavage mix that will cleave off the fluorophore and the reversible terminator on that base thus allowing for the next round of incorporation so in each cycle of this three-step process we
will be producing one base call from a particular cluster again across all of the millions of clusters and because the signal has now been amplified with not just one molecule but thousands of molecules giving us the same signal intensity we can normalize that signal intensity in order to produce a base call from each one of those clonally amplified clusters and because the clusters are fixed in place on the surface of the slide we will know exactly the sequence from that position from cycle to cycle and image to image in order to build our sequence string
that is being synthesized on that particular clonely amplified cluster so different systems have different read length capabilities based upon the chemistry and the engineering design of those systems but typically the number of cycles is equivalent to the number of base pairs which can range from 2 by 150 again that's a paired end 150 base pair in either direction up to 2 by 300 base pairs in the case of our my seek with the longest possible read lengths so let's contrast that traditional four channel or four color sequencing by synthesis chemistry with the newer two channel
sbs chemistry that is available on the nexique miniseq and novaseq so the advantage of the two channel or two color chemistry is that it only requires capturing two images rather than four different colors we're only capturing a red and a green image which thus decreases the imaging time by half and how do we derive four different bases from only two colors well the t bases are labeled with a green fluorophore the c bases are labeled with a red floor for the a bases are labeled with an equimolar mix of both red and green and thus
will appear in both the red and the green images and create a yellow when we overlay those two images and finally the g bases are dark they are not labeled with a fluorophore and originally when we launched this we refer to this as a dark g chemistry so as long as there's more than uh one non-g base in the first five bases we are able to detect that randomly amplified cluster if however in the case of nexique or novaseq we have a string of multiple g's at the beginning of the read we will not identify
that cluster but that happens very rarely in most applications after imaging we're going to extract the intensity from the red and the green image from those x y coordinate spots of each of the randomly amplified or nanowell positions of the clonal clusters and we will plot that on an x xy scale of red and green intensity and it will form these base calling clusters or clouds that are unique to each of the four bases allowing us to accurately determine which of the base calls are going to be made on that particular cycle derived from the
red and the green intensities from that spot so the sbs chemistry is identical to the four channel chemistry in terms of the workflow of incorporation imaging and cleavage for each of the cycles that's generating one single base call from a clonely amplified cluster however the only difference is the underlying nature of the fluorophores attached to each one of those bases so here you can see the dark g the c and the t and the mix of a signal with both red and green will be incorporated imaged and then analyzed to produce the sequence string you
see over on the right where again green signal would be equivalent to a t base call no signal would be a g base call red would be a c and red and green would be an a so this process again rapidly increases the speed of data analysis and acquisition allowing us to scan and interpret more data more quickly through the process of only acquiring and interpreting two rather than four images per cycle finally i want to touch on our newest type of sbs chemistry which is a one channel sbs chemistry this is currently available only
on the iseq 100 platform this uses a one channel chemistry combined with a unique flow cell type that is referred to as a cmos or complementary metal oxide semiconductor technology so this system has a unique type of pattern flow cells with nanowells that are going to be fabricated on top of this cmos type of chip very different from our glass slide flow cells that we've used for all of our other sequencing platforms prior to this so the way in which we can derive four unique bases from just one channel or one emission frequency is through
the use of multiple chemistry steps to determine the bases so we take two images but two images over two different chemistry steps within one cycle of the sequencing run and then based upon the signal pattern across those two images we can determine which of the four base calls should be made on that particular clonely amplified cluster so intensities extracted from one image will be compared to a second image in four distinct populations each corresponding to one of the four nucleotides so how does this process work similar to our traditional four or two channel chemistry it
will be like the three-step process but we've expanded that into a four-step process so first we'll do incorporation of the fluorescently labeled bases however we will then after imaging that first incorporation perform a second chemistry step whereby some bases will have the fluorophore cleaved and removed other bases will have a fluorophore added and two other bases will not change so as you can see here the a base is originally labeled with the fluorophore that is cleaved off the c base has no fluorophore but has a binding site where we can add a floor for during
that second chemistry step the t base will remain labeled with the fluorophore in both steps and the g base will remain dark in both steps of imaging so once we've captured both the first and the second image we'll then cleave off all of those terminators and fluorophores allowing for the next round of incorporation and two-step chemistry and imaging process which will produce one base call again per cycle so the data analysis for this is very similar to our two channel or two color chemistry but in this case we're analyzing the intensity not of just red
and green but the intensity of one color in two different images so we will plot whether it had high or low intensity in image one versus high and low intensity in image two in order to then differentiate the four different bases and so in summary you can see here a diagrammatic view of how the bases are labeled and how those bases are going to be interpreted and in the traditional four channel chemistry we have four unique fluorophores on each of the bases each one has to be filtered and captured through filters and cameras unique to
each one of those fluorophore emission spectra in the two channel chemistry we have either the dual labeled a the blank non-labeled g or the green t and red c bases acquiring two images allows us to differentiate between those four different bases and then the one channel chemistry it's one type of fluorophore emission spectra captured in two images with a chemistry step in between to either cleave or add fluorophores to discriminate the four different bases so let's discuss the process of paired end sequencing now that we're familiar with the cluster amplification process and sequencing by synthesis
let's assume that we've proceeded through our read one sequencing by synthesis at the end of read one we will have that newly synthesized strand bound to the library molecule that's covalently bound on the surface of the glass slide for demonstration purposes i'm only showing one strand although this is taking place on thousands of strands within the cluster we will then denature and remove that newly synthesized strand allowing us to proceed with another round of bridge amplification similar to the initial cluster amplification we will regenerate the double-stranded product through an isothermal pcr on the surface of
the glass slide once we've recreated that double-stranded product now we will selectively cleave and linearize to remove the forward strand leaving only the reverse strand orientation for all of the molecules in that cluster and we will now hybridize our re2 sequencing primer to perform that sequencing by synthesis in the reverse complement orientation into the dna insert region of interest so how do we incorporate the indexing or barcoding process into this overall sequencing workflow for single indexing on any platform the overall process would be we would perform our clonal amplification hybridize our read one sequencing primer
and perform sequencing by synthesis into the insert region we then denature that newly synthesized strand and hybridize our index 1 sequencing primer which would now perform sequencing by synthesis extension not into the insert but into the embedded barcode on one end of the molecule we would then perform that paired end turnaround or cluster resynthesis and cleave off the forward strand and hybridize our re2 sequencing primer to read into the insert region but this was only allowing up to 24 different unique single indexes to be read and thus 24 samples to be mixed and combined within
one sequencing run in order to allow for greater multiplexing capabilities and greater numbers of samples per run we have now extended this to a dual indexing configuration so there are slight differences in the order of operations between some instruments on illumina so for example the traditional sequencing on my c kaisek and novaseq would go through that read one sequencing by synthesis index one hybridization and sequencing but then in order to read the second index or i5 index we will utilize the capture oligos on the surface of the glass slide to serve as our primer to
extend and read the second index in the forward strand orientation although it's being done in this bridge confirmation we will then after reading that second index we will perform the paradigm turnaround cluster resynthesis cleave off the forward strand and read our read 2 in the reverse complement orientation this is slightly different if you are operating on an iseq miniseq or nexique or hi-seq4000 wherein we have changed the order of operation of paradigm turnaround to happen between the index 1 and index 2 process so rather than using the capture oligos on the surface of the glass
slide to read the second index in the forward orientation we actually perform paired and turn around and read the i5 or second index in the reverse complement orientation once we've read that second index we denature and remove that synthesized strand for the i5 or second index read and then finally hybridize our read two sequencing primer to extend and perform sequencing by synthesis into the insert region so very slight differences but for those of you who have experienced this this can cause some bioinformatic confusion during the demultiplexing and fast q generation step so it's very important
that you have properly formatted sample sheets to provide to your bioinformatics team to know whether or not the index 2 should be looked for in the forward or reverse complement orientation so with that those are the major steps of the illumina sequencing workflow i'm just going to briefly touch on data analysis which again could be multiple hours of seminar in and of itself but in a high level summary the instrument say my seek will be performing the imaging and initial data interpretation to convert those raw high density tiff images into extracted intensities and base calls
with an associated quality score so the output from most of our sequencers is going to be a base call or dot bcl file now many of our benchtop sequencers also include an analysis software which would allow for the subsequent interpretation of those raw base calls into fast queues where we identify the individual index 1 and index 2 combinations in order to sort the reads into different fastq files for each one of the biological samples depending upon their unique index combinations so many customers are using that on instrument fastq generation to output fast queues from the
instrument however the raw base calls can also be copied to a linux server and you can perform that same bcl to fast queue conversion in the linux environment using linux command lines to create your individual sample fast queues and then subsequent to that initial fast queue generation there are many different types of analysis software which will take those fastq files and perform alignment and variant detection and visualization annotation and reporting some of which you can find many basic interpretation excuse me many basic variant detection and alignment algorithms within our base base cloud computing environment or
there's a wide range of third-party academic developed scripts which will perform those functions again on the linux server so with that i'm going to conclude and i wanted to thank you all for your time and attention and at this time i'm available to take any questions thank you so much that was a fantastic presentation and um to everyone thank you again for joining us please you're able to submit questions on in the control panel and we can have dr westenberger answer some of them so i see we have a couple questions here now um here's
one i frequently hear about beads and generating clusters on beads how does this relate to the process you're discussing so illumina does not use beads during the cluster amplification or sequencing by synthesis process however there are competitor technologies for next generation sequencing that do that on beads and our microwave devices also use a bead-based capture technology to perform snip genotyping however beads can be used during the library prep process wherein we have say ampere beads or other sorts of capture beads that will have say biotinylated capture oligos bound to streptavidin magnetic beads as well as
more generic dna binding beads allowing for very rapid and automated library prep and size selection and purification so although beads can be used during the upfront library prep process which again can be manual or automated on third-party devices we don't actually use beads within the cluster generation or sequencing by synthesis process on an illumina sequencer great thank you uh another question how do you differentiate between a dark g and a deletion that's a very good question so the initial steps of the sequencing by synthesis process will retain multiple cycles worth of image data and we
are going to overlay those images in order to identify if a spot is present in the first five cycles so we will look for new clusters and try to identify all of the possible clusters on the surface of the flow cell generally over the first five cycles of the sequencing run if however we don't see intensity during those first five cycles then we're going to assume that's a blank region of the flow cell so for our two channel chemistry is where this is most important where we have the dark g we have to have at
least one non-g base appearing in one of those first five cycle images so one of the first five bases of the sequencing read has to be a non-g in order for us to detect the presence of a cluster at that particular position on the flow cell once we have identified that xy coordinate spot of the amplified cluster we then will apply data normalization by doing localized background subtraction and interpretation of the red and the green images to very confidently call a lack of signal as a g base after those first five cycles so that would
allow us to again accurately interpret the bases after the first five cycles once we've identified the randomly amplified clusters on the flow cell surface sounds good thank you um i think there's a follow-up to that other than data file size data processing speed what are reasons to choose four channel versus two versus one channel chemistry so when we launched the two channel chemistry which initially came on the nexiq platform we did extensive comparative analysis to the four channel chemistries that were on the older my seek and hiseq platforms and we did sequencing of reference genomes
and we engaged with academic sequencing centers in order to demonstrate that the fidelity and accuracy and quality scoring is equivalent between the four channel and two channel chemistry systems so although the underlying floor fours are slightly different and obviously the data normalization process is slightly different between the two chemistries we are very confident that the quality scores which allow us to interpret the accuracy or probability of error in base calling is very very highly accurate and equivalent between the two channel and four channel chemistry systems so there really should be no difference in one's confidence
in interpreting either a two channel or four channel chemistry system and again the same libraries could be run on the four channel like high seek and my seek and two channel nexseq in order to generate equivalent quality scores and variant calls okay and then the other question is um specificity and sensitivity between the four channel and one channel and i don't know if there if um there are any nuances between those two that you want to describe right so in each of the different chemistries whether we're talking about four two or one we have identified
appropriate bioinformatic algorithms to normalize and interpret the data again with appropriate confidence intervals and each base call from any of the four two or one channel chemistries will have its associated quality score which is again based upon the algorithms and chemistry unique to that platform and each of these chemistries and platforms is going to be benchmarked against control genome sequences from human mouse and e coli to demonstrate the accuracy of base calling even across different genomes with different gc contents thank you and we have one last question um i'm not sure exactly what i i
think maybe you can answer um how well does this strategy reduce mixed signals um that's probably in transitioning from our randomly amplified flow cells to the uh pattern flow cells so randomly amplified flow cells do have more probability of overlapping clusters and more difficulty in sorting out mixed signals because clusters can randomly seed and amplify on top of thus producing mixed signals from what we think is one spot but that spot is actually generated from multiple molecules the pattern flow cell technology with its exclusion amplification chemistry allows for a higher probability of single molecule or
monoclonal clusters to be amplified within that nanowell and greatly reduces the probability of polyclonal or mixed signals although that certainly can happen at very high loading concentrations and that's something that also needs to be optimized by the user thank you so much and we have um another question that's come in and this is we're jumping topics a little bit here but um follow up to the four channel versus two channel versus one if considering data quality is the same across the board what is the advantage um reduced cog speed etc can you speak a little
bit too to the advantages of of each yeah i think the the choice of the sequencing platform is less about the type of chemistry which again we've launched a particular type of chemistry that's you know unique and fixed we don't have say on a hi-seq both four and two-channel chemistries the hi-seq just is a four-channel platform whereas the next zeek is a two channel platform so the choice of platforms is not really about the chemistry or data quality but more about the overall data throughput required given the number of samples and the number of reads
required for the complexity of the data analysis and the depth of coverage and sequencing minor allele frequency detection that is required so if you have more samples or you need more greater depth of coverage you're going to want a higher throughput platform and those could be and are most likely the two channel chemistry systems on the nexiq and novaseq whereas if you need less throughput with fewer samples or less coverage you can go with the four channel chemistry say of the my seek which just produces less data overall but again the data quality is equivalent
across all these platforms great thank you so much um and another last question that's good i know i keep saying that but one more question a lot of interest in this in this topic obviously um cost difference between the four versus two versus one channel chemistry and timing of each i think you maybe talked touched a little bit on that and the high throughput but if you can speak about cost and time yes so the time to acquire the data on a per cycle basis is much shorter on our two channel chemistry systems but the
cost is more about the again cost per base is going to drop as the overall throughput of the device increases so on the smaller throughput say my seek or iseq devices it's a higher cost per base because there's a basic cost to you know producing and validating our reagents and selling those reagents and there's an economy of scale to producing more bases and more clusters with the just slightly more sequencing reagents being run through the instrument so there is a higher upfront cost in acquiring or purchasing say a high seek or a novaseq but the
cost per data per base or per gigabase is much cheaper given the economies of scale and the production of so much more data so if you are cost conscious and you have a high capacity needs it's obviously better to go for the higher throughput platforms great thank you so much and thank you again dr scott westenberger for this fantastic presentation very informative we appreciate your time and thank you everyone for joining us just to um talk about a little bit about our next presentation on may 1st this is going to be a rebroadcast of new
directions in access to genetic counseling information notification and engagement for precision medicine that will take place again on may 1st at 12 o'clock pacific time that will be uh nine o'clock eastern time three o'clock sorry three o'clock eastern time um and thank you again for joining us and hopefully you'll be able to join us again on may 1st
Related Videos

57:36
Genomic Technologies and Bioinformatics 10...
Ambry Genetics
15,003 views

59:01
Bioinformatics for the 3D Genome: An Intro...
Arima Genomics
11,753 views

55:32
Homologous Recombination Deficient Diagnos...
Ambry Genetics
5,051 views

🔴 Deep Focus 24/7 - Ambient Music For Stu...
4K Video Nature - Focus Music

25:05
Next Generation Sequencing 2: Illumina NGS...
iBiology Techniques
171,875 views

January Jazz: Sweet Jazz & Elegant Bossa N...
Cozy Jazz Music

43:34
Using Structural Biology to Support Varian...
Ambry Genetics
612 views

32:51
Learn More About the Illumina NextSeq 1000...
Illumina
16,951 views
31:26
Next Generation Sequencing 1: Overview - E...
iBiology Techniques
480,498 views

57:42
The Intricacies of Splicing & RNA Data in ...
Ambry Genetics
1,179 views

36:37
QIAGEN Seminar: QIAcuity, the Next-Generat...
UF ICBR
5,199 views

47:47
Integrating 10x Genomics single cell and s...
Oxford Nanopore Technologies
1,169 views

Work Jazz ☕ Smooth Instrumental Jazz Piano...
Cozy Jazz Vibes
41:35
Learn about Illumina's Next-Generation Seq...
Illumina
85,059 views

41:04
Improvements in Clinical Interpretation of...
Ambry Genetics
1,842 views

48:12
Introduction to Illumina DNA Prep (formerl...
Illumina
13,902 views

1:02:18
How to Read a Cancer Genome | Part 1: The ...
Genomics Education Programme
11,403 views

57:13
Next Generation Sequencing NGS A beginner'...
Novogene
15,109 views

50:52
Integrating Functional Studies into Varian...
Ambry Genetics
1,095 views

52:51
Preparation of DNA libraries for sequencin...
Latvijas Biomedicīnas pētījumu un studiju centrs
10,325 views