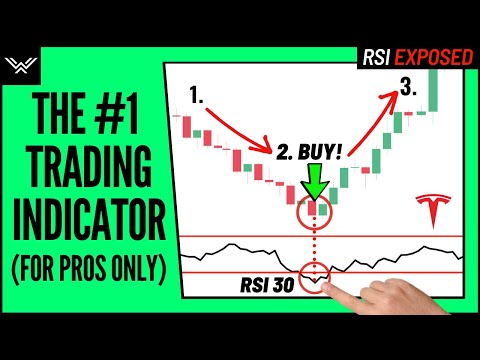
Best RSI Indicator Trading Strategy - Wysetrade Method
2.95M views7161 WordsCopy TextShare
Wysetrade
📈 FREE CHARTING PLATFORM: https://www.tradingview.com/chart?offer_id=10&aff_id=7016
💰 EXPERT CONT...
Video Transcript:
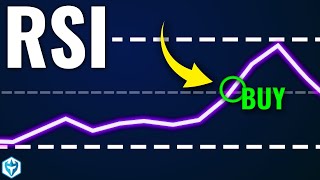
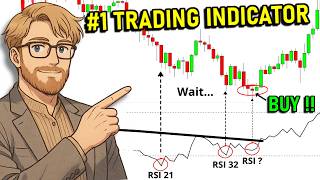
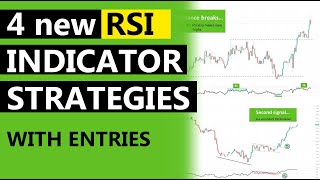
hey guys welcome back to another episode in this video we will be going through our rsi indicator trading strategy in depth and how we use it in combination with price action we also want to take the time to thank you all for your continued support and helping us get our youtube award so let's start the road to 1 million if you want more videos more often please smash the like button subscribe and turn on the notifications bell so that you know exactly when new content is released so two very important points before we start first indicators are not magic and we never use indicators on their own for trade entries we use indicators to support what we have already established with price action and second everything we discuss in this video can be used for currency trading stock trading and crypto because price action stays relatively consistent across different assets so we're going to go very in-depth in this video so here's a quick breakdown of what we will be covering first we'll go through all the core concepts to get everyone on the same page then we're going to go through the strategies section and finally we will show you how we used all these concepts to take trade entries on tesla and apple during the big market pullback so strap in as we have a lot to cover today so let's get into it so what is the rsi indicator rsi stands for relative strength index and it's an indicator that you apply to your charts that is often used for identifying bought or oversold markets so let's apply the rsi to our charts at the top here click indicators type in r and it'll show up right here click relative strength index and then it will be applied to your charts along the bottom now this line here is 70 on the rsi and this line here is 30 on the rsi everything at or above the 70 line is what we call the overbought region everything at or below the 30 line is what we call the oversold region so in relative terms when the rsi line touches the 30 just like it is right here it indicates that the price of the asset you are looking at is cheap when the rsi line touches the 70 just like it is right here it indicates that the price of the asset you are looking at is expensive again this is in relative terms so how is the rsi indicator traditionally used now this is what most traders do when the rsi enters oversold they'll start buying and entering long positions expecting price to go up when the rsi enters overbought they'll start selling and entering short positions expecting price to go down now here's the problem with using the rsi indicator like this notice how at this level here on price the rsi has already entered oversold so if you started to buy and enter long positions price would have continued to go against you for quite some time before it finally reversed what this means is in heavily trending markets the rsi indicator can stay inside of the overbought or oversold region for a long long time and if you keep taking trades solely based on the rsi indicator expecting price to reverse you will most likely rack up a significant amount of losses so this then leads us to a question we often get asked which is how do we use the rsi indicator where it actually helps our overall analysis also right now comment below and tell us what video topics you want us to cover as we always look at the comments to decide what to create next now we use the rsi indicator in one way and one way only which is combining rsi with divergences or rsi divergence so what is divergence divergence occurs when price is moving in the opposite direction of the rsi indicator which can then be used as an early indication of a possible keyword possible trend change so in this uptrend here price made a higher high but on the rsi it made a lower high which created a divergence and resulted in a reversal of price again to the left price made a higher high whereas the rsi made a lower high which created a divergence and resulted in a reversal of price so going in the opposite direction in this downtrend price made a lower low whereas the rsi made a higher low which created a divergence and resulted in a reversal of price now divergence can be used in many other indicators as well one of which is macd which is popular amongst many traders so this then leads us to another question we often get asked which is why do we prefer to use the rsi indicator over macd don't forget to comment your questions below now the reason is simple and it's because the rsi indicator gives us a more precise and clear divergence formation which results in higher quality trade entries here is the exact same chart on both sides on the left and below is the macd indicator applied on the right and below is the rsi indicator applied notice how on the rsi here it gives us a very crisp and crystal clear divergence formation but now if you look at the macd there isn't a divergence signal at all and this is an issue we often experience with the macd which is a lack of or low quality divergence signals now let me be clear there is no right or wrong choice both work perfectly fine we just prefer the rsi because it works best with our overall strategy and macd might work best with your overall strategy neither is better than the other because above all indicators are not magic and we do not use them on their own for trade entries we use them to support what we have already established with price action now that being said if you know how to use divergences correctly it is one of the most powerful tools for spotting and confirming high quality reversal trades and you'll soon find out why so let's cover the types of divergences we look for now there are many kinds of divergences people use but here are the main two types that we look for as part of our rsi strategy first is wide divergence and second is tight divergence and under each type there are two subtypes subtype 1 is when the divergence occurs at or inside of the overbought or oversold region and subtype 2 is when the divergence occurs close to the overbought or oversold region but does not touch so let's go to the first type which is wide divergence why divergence is exactly what the name states it is it is divergence where its swings are very wide and very obvious to spot on the charts here is an uptrend we had our divergence which then triggered a reversal notice how wide these swings are hence the name y divergence same thing in a downtrend we had our divergence which then triggered a reversal and again notice the clear wide swings and wide divergence so how do wide swings relate to price action why divergence is also what we call high quality divergence because we like to see wide swings and price moving sideways before looking for any kind of reversal trade because it tells us that the side in control of the dominant trend before the reversal is no longer in complete control hence causing the wide swings in both directions now again there are the two subtypes of y divergence which is one when the divergence occurs at or inside of the overbought or oversold region notice how it's clearly occurring in the oversold region or two when the divergence occurs close to the overbought or oversold region notice how it's close but not touching so moving on to the second type of divergence which is tight divergence which is exactly that it's divergence where the swings are tight or very close together here's your downtrend we had our divergence before the reversal occurred but notice how the swings are very tight hence the name tight divergence now in this example of type divergence you can still see the swings of price but sometimes with tight divergence it isn't as easy to see especially to the untrained eye so here's an example this here is tight divergence at first glance it might not look like it but this is what price is doing run small pullback run meaning this here is your lower low while the rsi indicator made a higher low which is clear tight divergence again this might have been harder to spot for some traders so here's an easy trick at the top of your charts if you click this button right here it will turn your chart into a line chart so let's do exactly that let's turn this exact chart into a line chart now notice how you can clearly see price making the lower low and the rsi making a higher low showing a clear tight divergence and then once you identify this on the line chart jump back to candlesticks so here's another example this here is where your divergence occurred and here is the movement that price made run pull back run price made a higher high while the rsi made a lower high hence your divergence again let's switch to the line chart to show this more clear here you can now clearly see the swings of price higher high lower high clear divergence and again when you're done just switch back to your candlesticks so when we get to the strategies section you'll understand why tight divergence is just as important as y divergence so again we have the two subtypes of tight divergence which is one when the divergence occurs at or inside of the overbought or oversold region this is clearly occurring in the region or two when the divergence occurs close to the overbought or oversold region notice how it's close but not touching so let's put both wide divergence and tight divergence on one chart as a quick recap why divergence reversal why divergence reversal why divergence reversal and then tight divergence here reversal so as a quick recap here is our divergence hierarchy now all divergence is good but just use this hierarchy to rank the quality of the divergence in the trade you are looking at so let's keep building on this and move on to the next section which is combining divergence with confirmation so divergence combined with confirmation means you look for price action after the divergence occurs to confirm that the reversal is real and not a fake out so let's break this down this is a clear moving uptrend as price is making higher highs and higher lows run pull back run pull back run you then spot this clear wide divergence formation now this is what we call divergence unconfirmed because it can start as a divergence pull back slightly and then still continue on and then you would have been faked out and took a loss don't forget that you are trading counter trend so just an rsi divergence alone isn't enough because that would be guessing based off an indicator so what you need to do is combine rsi divergence with price action after it occurs in order to confirm that the reversal is real now there are many price action strategies we use in combination with divergence but to keep things simple for this video one great way to do this is to apply a dynamic trend line onto the immediate trend then you wait for the breakthrough the trend line to occur which then confirms the divergence and confirms the reversal as a bonus this breakdown also made a lower low and at this point is when you go to the lower time frames and start looking for short entries so let's show this again this is a clear moving downtrend as prices making lower highs and lower lows you then spotted your clear y divergence this again is your divergence unconfirmed so what you do is you put a trend line onto the immediate trend and wait for a break to occur as price came up there would still be no trade for us as price failed to break the trend line it's not until you finally had your break here that we would consider long trade entries so you are probably thinking why not just jump right into a trade at the second head of divergence here well you don't know this move would occur meaning price could have pulled back slightly and then continued down again you are going counter trend and counter trend trades need extra confirmation as they hold more risk so this works the same with stocks here's the disney stock you again had your moving uptrend as price was making higher highs and higher lows you had your clear y divergence you then had your trend line applied and once you had price break through the trend line the divergence is confirmed which presented a possible short trade opportunity so let's go through the same concept but with tight divergence here's your clear moving downtrend you then spotted your tight divergence so let's switch this chart to a line chart to show this more clearly again as you can clearly see higher low on the rsi lower low on price which is divergence so jumping back to candlesticks after this divergence was identified we put a trend line over the immediate trend and once price broke through is when the divergence is confirmed which presented possible long trade opportunities so this works the same with stocks here's the pinterest stock clear moving downtrend you then spotted your tight divergence let's again switch to the line chart to show this more clearly again as you can clearly see higher low on the rsi and lower low on price which is divergence so back to candlesticks so again we put a trend line over the immediate trend and once price broke through is when the divergence is confirmed which presented possible long trade now here's a great example as to why you need confirmation and why to not enter trades solely based off of divergences here's the walmart stock price was clearly in an uptrend as you had your run pull back run pull back now you would have then spotted this great wide divergence here and you thought to yourself this is a great short opportunity what you are forgetting is that this is a very strong uptrend as you should already know by now you would only start considering short entries after the divergence if you had the trendline break a break through the key support and price making a lower low without that the divergence was unconfirmed and there was no trade to make matters worse a lot of traders went long at this access point here where the trend line and key support level both lined up perfectly this is actually a concept we discuss with our members about knowing where price is coming from but we will cover that in a future video so divergence combined with confirmation is only the base concept we do not enter trades simply off of these two factors now let's take this up a notch and move on to the actual strategy section of this video in this section we will be building on all concepts we have discussed in past videos so if there's something you don't understand make sure to go back and watch all our older videos after you watch this one so let's get into it so the foundation of this strategy is combining divergences with key levels or areas of confluence for high quality trade entries as a quick recap key levels or areas of confluence are areas where many schools of traders are watching for possible trade entries which increases the chances of a possible reversal again if you need a refresher check out our past videos now there are three variations to the divergence plus key area rsi strategy type one is divergence at a key level this uses only one time frame type 2 is candlestick price action at a key level and divergence inside of those candlesticks on the lower timeframe this type uses two time frames and type three which is divergence at a key level and then looking for a trend change inside of the leg2 head this type uses two time frames as well so let's start with type one which is divergence forming at a key level or area again type one involves using only one time frame also you can find these setups on any time frame you choose to trade with so you look left and noticed that when price came up to this area it hit and reversed drastically making this a key level of resistance so you had it drawn in now as price came back up for candlestick and resistance traders there were multiple entry points for short trades but now as a divergence trader once you noticed this wide divergence form right at key resistance you would apply your trend line like this and once price broke it with this bearish momentum candle is when you would start looking for trade entries short this also shows why you should never chase trades as there's always another trade opportunity coming up so let's show this again going the other way you look left and spotted this key area here where price reversed from drastically and it is also the lowest point that price has reached in recent time so you had it drawn in now as price came back down not only did you have a reaction to this level through the candle with the wick sticking out you also had a great wide divergence form again a reaction does not equal a trade so you put a trend line onto the immediate trend like this and once price broke through the trend line it shows that buyers actually stepped in at this level then you would go to the lower time frames and start looking for trade entries long so let's do the same thing except with tight divergence again key support level because price hit and reverse from here drastically as price came back down you had tight divergence form right at this key level of support so switching to the line chart again price made a lower low while the rsi made a higher low showing a clear tight divergence so let's jump back you then place your trend line on top of the current trend and when price breaks the trend line the support level and tight divergence are confirmed meaning buyers actually stepped in at this level and this is when you would look for trade entries long so again you add your drastic reversal which gave you your key support price came down and formed a tight divergence key trendline applied through these multiple touch points and once price broke through the divergence and support level is confirmed and you would then look for long entries so right now in the market the euro kiwi is creating one of these patterns you add your key resistance and swing high level here through these multiple reversals tight divergence has formed so we put a trendline onto the immediate trend like this but there is no trade unless price breaks through this trendline because again price can continue up now type 1 of the rsi divergence strategy is a great foundational strategy but we personally do not trade using only one time frame because it doesn't give us enough data and insight so let's take this up a notch and move on to type 2 of the rsi divergence strategy which is identifying candlestick patterns at a key level or area and looking for divergence inside of those candlesticks on the lower time frame so before we continue a question we often get asked is how do we create and edit our youtube videos and how did we grow our channel so fast if you want to learn exactly how we do it all head on over to our website at wisetrade. com and we'll show you how to do this step by step now type 2 uses two time frames and you can use any combination of time frames you want as it all depends on your style and we'll discuss this further so first we're going to break down the premise of this strategy and then we'll go through it more in depth this here is the 12 hour time frame which we really like using for medium term trades so we notice these two points here where price reversed from drastically which gave us support and we had it drawn in now as price came back down to this level of support you had no idea what would form you were waiting to see if there would be candlesticks forming when price got to this area you had multiple candlesticks with long wicks sticking out showing that price is indeed reacting to this level so most people would enter long right away but again that would be guessing because price can react and stall at a key level and still break right through so what do we do we need to look inside of these candlesticks on the lower time frame to see if there is price action that shows us that a trend change is occurring this is very key before you look inside of these candlesticks you have no idea what you will find that is what price action is in a nutshell which is reacting to what you see and not guessing the direction of a trade so let's bring up the four hour time frame and put it beside this one again here on your left is the 12 hour time frame we just looked at and here on the right is the same asset we are looking at but using the lower time frame specifically the four hour time frame meaning each candlestick represents four hours of time this support level is the same support level here this downtrend here is the same downtrend here now here's the key you identified your long wick candlesticks add key support here but it wasn't enough data for a trade entry so you looked inside of those candlesticks on the lower time frame to see what you had and this is what you found great divergence that formed inside of the longwood candlesticks this is a high quality trade now also notice how on the 12 hour time frame you couldn't put a trend line onto the immediate trend because the swings weren't wide enough but here on the four hour time frame you can easily place a trendline onto the immediate trend again you were waiting for a breakout which you got through the momentum candle that then confirms the divergence and the candlesticks and the level of support and that is when you would start looking for trade entries long using the lower intraday time frames so let's show this again before we continue we want to answer a question you probably have which is what time frame combinations to use again don't forget to leave your questions and comments below so the answer to this question is simple any combination of time frames works as it all depends on your style and speed of trade and this is why we are going to show you all the different time frame combinations now for our members and us we follow very specific time frame combinations but that's because it suits our strategy the best but for you as a trader choose a time frame combination that best suits your strategy and your speed of trade so let's get back into it so this is the daily time frame you again spotted these two reversal points giving you your key level of resistance so as price came back up you had this candle here with the wick sticking out showing a reaction to the level it's at this point that you would look inside of this candle and start watching the lower time frames and wait to see if you would get a trend change so let's put the four hour time frame beside this one same resistance level same uptrend and the area here we were looking at on the daily it's the same area here on the four hour time frame you had your clear divergence here and a great wedge pattern forming so you had it drawn in then once you had your break out of the wedge on the bottom side and price making a lower low the divergence is confirmed and you would start looking for short trade entries on the lower intraday time frames so we'll cover all the trading patterns in depth in a future video so let's show this again this is the eight hour time frame you identified your key reversal point here where price shot up from so you had your support level drawn in as price came back down you had your inside bar candle with the wick sticking out the top showing a reaction to the level of support so after you spotted this you would then want to look inside of these candlesticks and inside of this area so let's pull up the four hour time frame and put it side by side same support level same downtrend and these candlesticks and area here is the same area right here now notice how inside of your candlesticks you had this great tight divergence forming let's pull up the line chart so you can see it more clearly again price made a lower low while the rsi made a higher low so it's clear divergence so jumping back you then again put your trend line on to the immediate trend and once you had your breakthrough as confirmation you would then start looking for trade entries long using the lower intraday time frames so let's show type 2 but with trend trades this here is on crypto and the 12 hour time frame you had a clear moving uptrend here reversal point here that gave you your key level now as price reached this area you had multiple candlesticks reacting to the level the 50 ema also lines up perfectly with this level so again we want to look inside of this area so let's bring up the four hour time frame same key level same downtrend and this area here is this area here again clear divergence at the key level trend line placed above and once you had your break you would start looking for trade entries long as your directional bias is confirmed so one more here's the daily time frame this was your clear moving uptrend key level here because of these two reversal points so after we had these two perfect long wig candles reacting to the level we wanted to look inside of them to see if we had price action that signaled a possible trend change so let's pull up the four hour same key level same pullback we had perfect y divergence right at the key level and then you would place your trend line above and once you had price break through you would then look for trade entries long on the lower intraday time frames so right now in the market the pound dollar is creating one of these setups this here is the weekly time frame we have our key level drawn in because of these reversal points where price tanked down from showing how key this level is it is also a swing high meaning the highest point that price has reached we had a reaction to the level through this candlestick with the wick sticking out but again a reaction doesn't equal a trade so let's look into this candlestick here and pull up the daily so on the left is the weekly time frame and on the right is the daily time frame same resistance level same uptrend and this area here on the weekly is the same area here on the daily now notice that you have great divergence that has formed right at this key level of resistance we then placed a trendline below so you should already know where we go from here we do not start looking for short trade entries unless we have a break of this key trend line so let's take this even further and move on to type 3 of the rsi divergence strategy this concept is more advanced and we usually reserve it only for our members but since it'll help you all and adds on top of everything that we have previously discussed we're going to reveal it to you now so type 3 of the rsi divergence strategy is finding divergence at a key level and then looking inside of the leg 2 head of that divergence for price action that signals a trend change now before we continue if you're enjoying this video make sure to hit the thumbs up button and leave a comment below with your questions thoughts or topics you want us to cover that just goes a long way so when would you use type 3 there are two reasons why reason number one and type 3a is when you don't have good price action on the main time frame you found the divergence on so you need to look inside of the leg 2 head and reason number 2 and type 3b you want to get in with an earlier entry right at the leg 2 divergence instead of waiting for the larger trendline break so again you would need to look into the leg 2 head so let's start with type 3a which is when you don't have good price action this is the daily time frame you had your key level of resistance here you then had a great wide divergence form now here's the problem you didn't have a good candlestick form at the key level all you had was a green bullish candle also you are unable to put a trend line onto this trend if you put it here it's too low and if you put it like this it's too tight so again the two problems no candlesticks for type 2 and no trend line for type 1 great level no entry so to get around this you used type 3 which is to look inside of the divergence leg 2 head right here and see if we could find price action that showed a trend change so that you could find the end of the second head so let's bring up the four hour time frame so again on the left was the daily time frame we just looked at and on the right is the 4-hour timeframe same resistance level same uptrend and this level here that we were just looking at is this same level here now notice on this time frame we had perfect y divergence at the key level what this means is you have divergence inside of the leg 2 head of the wider divergence so this allows you to see when the leg 2 is possibly ending now to confirm it all you again are able to place a trend line onto the immediate trend on this time frame and then once you add your trend line break everything is confirmed and you would start looking for trade entries short on the lower intraday time frames so let's move on to type 3b which is when you want an earlier entry so this is the 12 hour time frame and you had your clear reversal point here giving you key resistance so you had great wide divergence form right at the key resistance level now the issue is that your trend line was placed at these swing lows here meaning that you would have to wait for price to break it down here before you could enter the market now you already had good candlesticks forming at the key level so how do you get in with an earlier entry right at this leg two head of divergence again you need to look inside of it for a possible trend change so that you could find the end of the second head so let's bring up the four hour time frame same resistance level same uptrend and the leg two head here is the same area here now on this time frame you had a wedge pattern that is also divergence and then once you had your break this confirmed the end of the leg two head of the wider divergence then you can get in with an earlier entry here but for more secure traders you can still wait for the larger trendline break and enter down here again it all comes down to your style and how aggressive you want to take entries but now we want to show you something very interesting which also brings us to the final section of this video we're going to show you how our members and us used divergence combined with correlations to enter trades on tesla and apple during the deep s p 500 market pullback now first what are correlations in trading in simplified terms correlations means how different assets move in relation to each other so knowing that a positive correlation means when one asset moves in a specific direction a positively correlated asset will move in relative sync and in the same direction an example of this is the s p 500 and its positive correlation to u. s stocks when the s p 500 shows strength and moves up often times u.
s stocks will move in sync and in the same direction which again is a positive correlation again this is not the law we are stating this in relative terms so just use it as guidance this also means an inverse correlation is when one asset moves in a specific direction an inversely correlated asset will go in the opposite direction an example of this is the vix index being inversely correlated with the s p 500 the vix index is the volatility index also called the fear index meaning when the vix rises it represents an increase of fear or uncertainty in the market and since the vix is inversely correlated to the s p 500 when the vix rises and fear increases the s p 500 falls this is not the law we are stating this in relative terms so just use it as guidance now that you understand correlations let's break down how our members and us used correlations in combination with divergence for trade entries on tesla and apple during the recent market pullback so let's first start with step one which was tracking the s p 500 when you look at the monthly time frame this is a very clear long term uptrend you then had your very long term trend line that started all the way back to the great recession and has been respected every time price has reached it which shows how key this trend line is you then had this very key support level here because of this reversal point now this then gave us our access point or area of confluence here where the trend line and support level crossed which we covered in our last video you then had a perfect long wick candle right at this access point showing that it was respected this time around now this is very key even though this was a deep pullback without price breaking this long-term trend line and making a lower low the long-term uptrend is still intact so after we had this very long wick candle react to the access point this gave us a bullish bias but unconfirmed because it is the monthly time frame and we don't enter trades on it so what we needed to do is go to the daily and look for price action that showed a trend change inside of this downtrend and confirm the monthly price action and the reason we need to do this is because even though your long-term trend is an uptrend your short-term trend is still a downtrend so we need the trend change from a downtrend to an uptrend to be confirmed aka time frame confluence so let's pull up the daily again same support level same trend line same pullback and downtrend and this access point here is this same area here first you had a tight divergence right at the access point let's pop the line chart to show this price made a lower low and the rsi made a higher low showing clear divergence so back to candlesticks you then place your trend line above and once price broke through it you had your higher high which again confirms the trend change and showing that the downtrend is over and that the larger uptrend can continue so the monthly is now confirmed by the daily trend change which then gave us a bullish and long bias now this is where correlations comes in again we first found price action on the s p 500 that gave us our bullish long bias then since the s p 500 has a positive correlation with u. s stocks this again gave us a bullish long bias on u. s stocks we were watching this then brings us to the tesla stock which is a u.
s company and again gave us a bullish long bias on it now this doesn't mean we jump in blindly we still need to find a high quality entry so let's pull up the tesla stock so here's the tesla monthly time frame we first identified this key monthly level through the four clear reversal points showing how key this level is if you watched our past videos you would know that what you find on the higher time frames or what is visually obvious on the higher time frames such as the weekly and monthly are very very key levels so price then finally broke through and old resistance becomes new support so let's pull up the weekly which is where we found price action on so same key level this key area here is this same area here now on the weekly we had a perfect long wick candle form right at the key level and exactly where the 50 ema crosses making this an access point an area of high confluence this again gave us a bullish bias but unconfirmed so we then needed to look inside of this trend here for our trend change on the daily so let's bring up the daily so on the left is the weekly we just looked at and on the right is the daily same key level same pullback and this area here is this same area here trendline placed onto the immediate trend and once it broke and made a higher high and the previous higher low the trend change was confirmed it was at this point that we went to the intraday time frames and took long entries using our entry strategy now this was already a great long trade entry but to add even more strength and increase the trade quality we used the correlation to the s p 500 so let's pull it up and put it beside so again the s p 500 had a reversal and fresh bullish momentum and the tesla also had a bullish bias through its fresh breakout so knowing this we used the correlation from the s p 500 to the tesla stock to increase the trade quality making this an a plus trade entry and if you have watched our past videos this trade setup would have been crystal clear to you as we used every concept we have previously discussed so let's go through the same concept but through the apple trade we took so again here on the apple stock on the monthly time frame we had our key level here because of this reversal and we had it drawn in so let's confirm this on the weekly time frame again same support level same pullback but here on the weekly you also had a perfect trend line placed below this then gave you your access point here where the trend line and key support level crossed you then had a great longwick candle react to the access point and area of confluence so both the weekly and monthly are confluent but we need to look inside of this downtrend for a trend change in order to confirm it is over so let's pull up the daily same key level same pullback this area here is this same area here now on the daily you also had great divergence right at this key level trendline placed above and once you had your breakthrough you would look for trade entries long through the lower time frames using our entry strategy now let's again bring up the s p 500 to show the correlating price action so on the left the s p 500 had a fresh breakout and bullish momentum and since it is correlated to the apple stock which also had a fresh breakout and bullish momentum this made the trade a plus now if you want to learn our exact intraday entry strategy head on over to our website at wisetrade. com also if you want to learn how we design and edit our videos go to wisetrade.
Related Videos
20:22
ULTIMATE Bollinger Bands Trading Course (I...
Wysetrade
785,985 views

14:55
Best Moving Average Trading Strategy (MUST...
Wysetrade
3,311,030 views

2:52:21
Work Music for Deep Focus and Efficiency
Chill Flow
69,149 views
21:28
RSI Indicator Secrets: Powerful Trading St...
Rayner Teo
1,043,530 views
19:08
You are Using the RSI Indicator WRONG! (RS...
Bybit Learn Official
1,053,341 views

3:12:13
432 Hz +741 Hz+ 963 Hz ~ Receive Wealth, H...
Healing Soul Frequencies
1,086,553 views

8:50
Bernie Sanders WALKS OUT of interview
Brian Tyler Cohen
1,465,166 views
27:45
The Ultimate Relative Strength Index (RSI)...
Ross Cameron - Warrior Trading
70,396 views
53:55
The UNFAIR Fibonacci Trading Strategy (THE...
Wysetrade
2,496,079 views

39:19
Support And Resistance Didn't Work Till I ...
Rayner Teo
2,109,866 views

28:55
Best Trend Lines Trading Strategy (Advanced)
Wysetrade
4,857,612 views

528Hz + 741Hz + 432Hz - The DEEPEST Healin...
Healing Melody for Soul
47:46
Master the RSI Indicator (ULTIMATE In-Dept...
Mind Math Money
93,234 views

1:29:35
Music for Work — Deep Focus Mix for Progra...
Chill Music Lab
3,530,613 views

3:32:01
FREQUENCY OF GOD 963 Hz | ATTRACT MIRACLES...
Frequency Harmony
1,619,378 views

1:41:30
The ONLY Technical Analysis Guide You'll E...
Ross Cameron - Warrior Trading
297,439 views

30:54
Ultimate MACD Indicator Trading Course (EX...
Wysetrade
387,738 views
16:24
My 4 favorite RSI strategies + secrets tha...
Tradeciety.com
167,459 views

9:06
Beginner Guide to the RSI Indicator
Trading 212
1,821,078 views

Healing Forest Ambience | 528Hz + 741Hz + ...
Healing Energy Frequency