Imbalance tells you everything
142.98k views2583 WordsCopy TextShare
JeaFx
🎓 '7 Steps to Profitable Trades' (Free Video Course) 👉 https://jeafx.com/7-steps-optin/
Imbalance...
Video Transcript:
imbalances tell you pretty much everything you need to know about where the market is now and where it's likely to go it's an incredible concept for understanding clear targets and areas where you might want to get into the market so in today's class I'm going to run you through the full concepts of market efficiency and show you what an imbalance is and how to start using this concept in your trading to get better results and have more clarity behind the work you do so with that said let's get to the learning so what exactly is
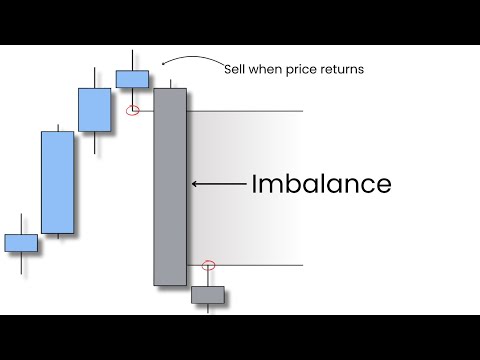
an imbalance first of all well an imbalance simply refers to an open price range so in this example we have two imbalances marked out the first imbalance would be this price capap between this Wick and this Wick this is an open price area now if you are an ICT Trader you might have seen over the past couple of years a concept called fvg or fair value gaps come up you could visualize an imbalance as an fvg if you're familiar with that concept but I trade it differently and have done for absolutely years but fvg seems
to be a newer concept than the imbalance that I've been trading for years so you will see that although identifying them looks the same the way it's traded is totally different so down here this imbalance would be between this Wick and this Wick here so it's an open price gap which is simply a large candle or a collection of large candles with no Wicks pulling back through them which leaves an open space in the market now when we see these imbalances the concept is that we are expecting the imbalances to be filled so at some
point in the future I would expect the market to not trade into this area but but fill this area entirely and trade to the demand Zone that's below it and the same concept again down here I would anticipate the market to not trade into this imbalance but trade through the imbalance and retest the demand below and once the demand zones have been retested and the imbalances have been filled that is where New Opportunities can arise now before I show you the different ways to use imbalances to read markets and find trades I'm going to explain
the concept of market efficiency so that you understand why this happens the market efficiency Theory suggest that the market moves in two ways it moves efficiently and inefficiently now what you can see here is an example of a trending Movement we have continual higher highs and higher lows and this actually shows two phases the efficient phase and the inefficient phase that the market can go through so this area here would be the efficient range so that is from the very beginning through to this point here now this leading point from there onwards is an inefficient
range and let me explain why so an efficient market is a market that is pushing away and pulling back to retest every open area and the reason that this happens is because there aren't significant orders in the middle of a range so we get a push away and then the market will pull back to trade into an area where significant orders are located such as a demand Zone before new institutional buying takes place and the market makes a new high so this is simply a phase where the market is respecting the orders buying until the
momentum slows down pulling back to another point where Mass buying is taking place buying WIS again and that continues now when we have a push away though and we don't pull back here this actually leaves that imbalance that we spoke about so this is that large open price Gap that we covered just briefly so this is known as an inefficient Market because what we have here is a demand Zone that has left a large open price Gap and hasn't yet been retested so we would expect at some point that the market is going to fill
into this region to create efficient in the market so it can continue with the efficient order flow so we are always looking for the market to create efficiency in the end but sometimes those inefficiencies or imbalances will be left open and these can provide trading opportunities in multiple ways and help us massively with our Market reading skills now when we have multiple imbalances such as imbalance here and imbalance here the extreme imbalance which is the furthest away from price is going to be the higher probability imbalance so we would anticipate by looking at this Market
that the market could potentially react from here but the highest probability reaction is once we reach this area now this can be used in two ways first of all if we know that this is a high probability area for the market to trade into then we could follow price action down on a short trade towards this area providing we have additional confluences to do so and once we meet that area we would then look for a buying opportunity out of this Zone because then the imbalance would be fill so we can continue moving with this
current trending Direction as a reminder of where the imbalances are I've just marked them on the chart now let's see how this Market reacts to the information that it's giving us with these imbalances now as you can see the market drives down and doesn't respect the first area because there's further imbalance and deeper imbalance below but now you can see that once we traded into this point we got new opportunity to buy because the imbalance has been filled so markets will continually trade back and forth yes they will follow Trends but at a minimum they
will generally retrace back and forth to fill imbalance price areas now when we look at AU here we can see there was a small imbalance leading us into this efficient price area or Supply Zone which would be this indecision candle before the large moved down so this is a small imbalance but you can see that this was recently retested so I would anticipate generally from an area like this we are likely to see some form of reversal whether we trade a bit higher first of all or we just come lower we could generally expect to
see reversals occurring from these imbalanced price points given that there's other confluences that provide enough weight to make this a valid area to trade from so in this example we had had multiple breaks of structure driving us into this upside move so when we return to it we can look for a buying opportunity now at this point we may be due for a reaction to trade down towards some of these previous points so you can see these imbalances form in pretty much every single price move if the market is efficient we needn't worry about reactions
taking place in that area and if the market breaks into an efficient range we generally expect that it's going to reverse through it but when we have these inefficiencies we can use them as very clear targets for positions and we also set up our larger swing trades by identifying where those imbalances are now this concept is not just for daily time frames or weekly time frames you can use this on whatever time frame you want it could be the 30 minute the 5 minute the 1 minute imbalances are once again a fractal concept like everything
else trade so now we're going to take a look at this example on EUR USD now for context the market has shifted direction from bearish to bullish changing from lower lows and lower highs into higher highs and now we are looking to see if it will form a higher low now if we wanted to buy into this new trend following this new confirmation and this new shift in the trend where would we look to do that well we would look to do that from the imbalanced extreme so as you can see here we have an
imbalance leading us down into to this 30 minute demand Zone the 30-minute demand zone is this area just here so we would expect that the market can draw into this point and if it does that would be a really good place to buy from so a position may look something like this where we can buy from this area with stops below the zone and we can look to take the market higher into its trending move and guess what for targets we can use imbalances too so for simplicity's sake the next imbalance within this price range
leads us into the Supply Zone just here so we could use this as a target for our position because we know if this imbalance is filled to the downside we are then likely to start tackling an imbalance higher up given the fact that we've now just shifted into a new bullish Trend now following on with this you can see that this imbalanced demand was retested followed by a nice push away in the direction of the trade that we are trying to take now what's happened here is that we've actually broken some internal structure as well
so we've actually shifted here from lower lows and lower highs into higher highs and higher lows so this confirms the trend in another layer we have now confirmed it from the low time frame perspective as well but what have we done well you can see that in doing this we've actually left open a new imbalance down here into the extreme and below that lays another demand zone so if you'd missed this first initial entry and you wanted to get into a trade or you were looking for a confirmed trade where the low time frame agrees
with the high time frame what could you do well now you could use this as your buy point with stop losses below the low and you could work with the same exact target because the market should continue flowing and if it does fill this imbalance that will give you a pinpoint entry a lot of the time to capture the movement up and as you can see in this second example as well the retest was perfect it retested that imbalance point and then pushed away to the upside and filled the target so you can see that
identifying imbalances practically gave us every portion of this trade yes I used the mark Market structure and the trend structure to determine which way I wanted to take the trade but it's those imbalances leading into imbalanced demand zones that provided the opportunity here and guess what imbalance provided the Target too we just went for the next imbalance Point within the range on the way down we know with the market shifting here from bearish to bullish we are likely to Trend up so where can we target well this becomes a very simple easy and clear Target
with a high likelihood of being filled because the market will want to return to this area to fill those orders remember what we said before there are minimal orders happening within a range which is why we get these ranges and choppy price action but when we come into the lows and the highs of different movements this is where the significant buying selling and profit taking is happening which is why once these imbalances are retested we start to see reactions and reversals from the market so let's take a run through one more example when you look
at this chart what do you see well the first thing I see is a market that has shifted into a fresh bearish Trend we had breaks of structure and we've started pulling down lower now we retested lightly this imbalance demander which means there is no imbalance left within this price range however when we look below we can see that this area has left open and imbalance itself so this is actually an inefficiency between this low and this demand now above we can see we have an imbalance just here and we also have a smaller imbalance
just above which we can keep an eye on so now we've got some potential ideas we could potentially look to sell from here if the market told us to or we could wait for a fill of this region and place sell orders there because we can then anticipate the market is likely to come down trade lower and fill the imbalance range that we have left open so we can actually get rid of this because this has already been retested leaving our imbalance ranges as these three here but here's one more thing and this is how
you can use imbalances to identify many many setups within a larger picture now we can see after retesting this first demand we have had a shift up in the structure and this is leading us through this imbalance range towards one of these inefficient areas now what can we see below within this range we have this dogee candle this dogee candle is leaving an imbalance open into this demand so at this point we could place a long position here following this bullish Trend and if the market can fill that imbalance that would provide us with an
opportunity to buy towards one of these Supply zones and then from there we can assess if the shorts are going to come through so as you can see we found a 3% profitable position by using the imbalances that were left open down here and targeting the imbalances up here now from this point onward we would need to see a shift in the trend to validate this zone or we would simply need to see the market trade into this zone for a selling order and updating on this we reacted from this Zone and we've sold and
we've broken lower but we've still failed to retest this area so this indicates to us that we could sell if we had had a clear imbalance point to do so and well look at this just here we have the extreme Supply this is the extreme because this previous Supply was retested by this Wick so now we could take this sell position and if the market retests this imbalance range which it's highly likely to do that should lead us through to our Target at this open imbalance demand and as you can now see that is exactly
what happens so there you go a full explanation on the use case of market efficiency hit the link in the description and watch my master class which which is going to show you how to approach trading in the best way in 2024 with that said that's it from me if you've enjoyed the video drop a like and make sure you subscribe I make these videos every single week thank you for watching and I'll see you in the next one
Related Videos

23:44
Master These 3 Concepts to Trade Profitably
JeaFx
243,647 views

15:08
FVG vs IMB - The Best Trading Strategy?!
JeaFx
298,665 views

19:46
5 Tips to Master Technical Analysis (STOP ...
JeaFx
183,498 views

2:32:10
AI AGENTS EMERGENCY DEBATE: These Jobs Won...
The Diary Of A CEO
702,332 views

26:59
Make Money Trading With Candlestick Patter...
JeaFx
26,756 views

21:17
This trick will help you win more $$$ (and...
JeaFx
43,972 views

14:47
This Day Trading Tip Will 10x Your Results...
JeaFx
257,091 views

26:29
If Your Win Rate Sucks, Watch This Before ...
JeaFx
91,354 views

27:58
Every Candlestick Tells a Story... Here's ...
JeaFx
630,168 views

23:06
Liquidity Trading SIMPLIFIED (Step by Step...
JeaFx
351,648 views

29:52
Cheating Expert Answers Casino Cheating Qu...
WIRED
1,465,783 views
15:55
Always Wait For THIS Before Entering Trade...
JeaFx
914,631 views

22:20
Complete Guide to Market Structure (Mastery)
JeaFx
181,156 views

11:25
Trump Gets A Free Plane | China Tariffs Pa...
The Late Show with Stephen Colbert
682,913 views

20:08
Liquidity + Structure = Profit
JeaFx
870,030 views

27:35
Brokers Will Hate You For Using This PROVE...
The Trading Geek
207,842 views

32:44
How To Accurately Read Market Structure (S...
Lewis Kelly
158,127 views

8:00
I Found A Secret To Fair Value Gaps
TradingLab
808,426 views

12:20
'The president got pantsed': Where's the '...
MSNBC
87,372 views

29:55
Trump: Only 'stupid person' would turn dow...
CNN
119,352 views