The Only Day Trading Strategy You Will Ever Need (Full Tutorial: Beginner To Advanced)
5.04M views8864 WordsCopy TextShare
The Trading Channel
I am currently looking for 500 new or struggling traders to mentor and help accomplish their trading...
Video Transcript:
by far one of the most important factors to you making money from day trading is having a strategy you can stay consistent to and that makes money over time the biggest reason that day traders fail is because they either don't have a strategy they can stay consistent to therefore they switch strategies all the time or just place random trades while they lose money in their account or they have a strategy but it doesn't make money so they place trades with a losing strategy until they get too frustrated to continue so i thought why not shoot
a video that can fix that and that is why in today's video i'm gonna be showing you my favorite and what i consider to be the best day trading strategy that i've found over my 10-year trading career and this tutorial is going to be from beginning to end that way no matter where you are in your trading journey by the end of this video you have a complete understanding of this strategy and hopefully that will get you one step closer to accomplishing your trading goals so if that sounds good go ahead and smash that like
button for me go ahead and hit subscribe if you are new because we come out with content like this each and every week if you're already subscribed welcome back i'll see you on the other side of the intro and disclaimer [Music] in order for you to make money trading this strategy you must understand how to identify trends on a price chart for that reason throughout a majority of the beginning of this video it is going to be focused on teaching you how to identify trends correctly on a price chart but we are also at the
beginning of the video going over a live trade i had using this strategy yesterday so you can see that i use it in real markets with my real account and also you can see how i use it in real time then we're gonna dive into that trend identification lesson then we're going deep in the entire strategy itself there's a time stamp beside me on one of these sides if you already know how to identify trends after watching the live trade feel free to jump ahead to the actual strategy itself but with that said let's go
ahead and dive into the live trade and i'll be right back to ensure that you understand how to identify trending markets see you in a second so here we are on the aussie canada five-minute chart looking at a trend continuation trade that's based on the strategy that you're going to be learning throughout this video now i'm going to have to wait to see this market either hit my stop loss or hit my target as you can see i'm already in the trade but with the power of editing you're going to see that right about now
so as you can see here on the aussie canada five minute chart this trade ended up working out perfectly pushing down and hitting our targets for about a 2.4 to one reward to risk ratio and banking in over a couple of thousand dollars over a very short amount of time this was just a couple of hours here using the day trading strategy you're about to learn throughout this video and we are going to completely break down this trade and the entire strategy a little later in the video but right now as i said earlier the
only way for you to be able to make money using this strategy is by understanding how to identify a trending market so let's dive deep into identifying trends on a price chart right now just to be clear i do not only use this strategy for day trading and i also do not only use it in the forex market this is a strategy i use across all time frames and across the stock forex and crypto market that i trade in so now that that's cleared up let's get started by explaining the difference between major and minor
swing levels because that is something that is absolutely necessary for you to be able to identify trends in the forex market correctly so first off for major swing levels they are the top and the bottom of our impulsive moves let me explain that an impulsive move would look like this here's the bottom of our impulsive move this is the move that breaks through previous structure that would be our impulsive move so the bottom of this would be a major swing level the top of this move would also be a major swing level now as we
get this pullback the bottom of the pullback would be a major swing level and then we push up as we break through previous resistance and we get the top of an impulsive move this is a major swing level then we pull back the bottom of the pullback major swing level and the new structure high as we push up here and break into new highs is another major swing level so there's not really any way to make this completely objective and i know that sucks i know it's a lot easier with completely objective rules but i've
not found a way to make this completely objective yet but this is the way i identify major swing levels it's the top and the bottom of my impulsive move remember in a trending market a trending market can look like this and do this and then go up and then do this and then go up and the levels we're paying attention to are major swing levels during a trending market what i mean by that is we have a high here once we break through that high what's our rule once we break through that high we can't
see the market come down and break through the lowest low of the pullback if it does then we don't we do not consider this market still in an uptrend but as long as we stay above it like we have here then we are considered to be still in an uptrend especially when we come up and start breaking into new highs that confirms the continuation of that uptrend so the major swing levels in this case would be our initial starting point our new structure high our pullback our new structure high and our pullback now the thing
is you're not going to know this is a major structure level or a major string level string level excuse me a major swing level until we break into new highs and that's just that's just because this is the level we don't want to see broken by the trend so that's totally fine we need to see the market break into new highs before we know that our pullback levels are the bottom of a pullback there's no way to know that this is the bottom of a pullback until we break into new highs because the pullback could
continue continue continue right so with that being said hopefully now you understand what major swing levels are in terms of minor swing levels it would be everything you see in between so this would be considered a minor swing level this minor swing level minor swing level minor swing level in terms of a trending market we do not pay attention to those we do not use those for anything we'll do a bearish example now though and what i want you to do while we're looking at this chart is try to point out the major and minor
swing levels for yourself i'll give you about five seconds pause the video if you need to and try to point those out before i do hopefully you pause the video and have those pointed out now but this is how drawing out major swing levels in this bearish example would look we would have a starting point up here as a major swing level the market would pull down what are we waiting on an impulsive move must break previous structure so now that we have this big move down we can see that it actually broke a previous
level of structure so now we know this is an impulsive move then we get a pullback and we don't know that this is the top of the pullback until what until we actually break through this support level once we do we can now count this as a major swing level as well this is another major swing level and we know that now this is a major swing level once we break through that we continue pushing down and here would be our next major swing level where this heavy pullback starts now what our next swing level
would be is the top of that pullback which is right here after that the next impulsive move we have remember an impulsive move must break our previous level our previous major swing level so if we draw a line right here you can tell that this would be our next drawing point this would be our next major swing level i know a lot of you probably said this was a major swing level but we don't have a break of our previous major swing level right over here so with that being the case there's no way that
we can count this as a major swing level so this would be the way we would draw out this trend than the top of the pullback another major swing level pushing down we have to break and close below structure we do that right there so now we have a push down and this is our next major swing level what's the next thing we need to see if this market's going to reverse and we're going to find another major swing level we need to wait for the break of what this level here after we get a
break of that level we can find our next swing level before the market pulls back and then continue looking for major swing levels in order to determine trends in a specific market now again there's no way to have this completely objective and it's something that you will just have to spend time learning and understanding let me show you an example of what i mean though one of the things that i was talking about is this right we have a situation where we have what a major swing level here because it's the bottom of an impulsive
move as we push down from our pullback bottom of impulsive move pull back break this is our impulsive move so the bottom of that is determined once we get this big push up and we break above this resistance with that being the case this is definitely a major swing level this is definitely a major swing level and in terms of this now being a reversal we're considering this market to be in a possible reversal until we break and close below here and this being a major swing level what's our next major swing level the bottom
of the pullback right but we can't call this the bottom of the pullback yet why because we don't know if it's going to be the bottom of a pullback to show you an example of that if we move this market forward you'll see that we start to get another lower low right here than the previous low so now is that the bottom of the pullback no we don't actually know the bottom of the pullback until this level is broken so we have to hit play just kidding apparently market replay doesn't want to play right now
we have to hit play still not working okay i guess you'll just have to hear a bunch of clicks as you can see we eventually drop down even lower at this point so now we still can't consider this the bottom of a pullback the reason being we haven't broken above this level so we still have to wait and see if we can eventually break through this previous resistance level once we get a break through that previous resistance level then we know we have a major swing level and this being the case this only being known
after the break of this resistance level is totally fine because the only reason we're using this major swing level is to identify that the trend is still intact at this point since we have identified this as a major swing level we have our low to high our major swing level after we see the break through this we now know that we are still in an uptrend no matter what happens in between consolidation-wise unless we break through our previous major swing level that's why it's okay that we have to wait for a break of this high
in order to identify this as a major swing level because the reason we're using this major swing level is just to give us an idea that this trend is still intact so we need to make sure that the market and price in general stays above this swing level so that we can clearly identify that this trend is still intact no matter what happens in between as long as we stay above 1.2144 then we are still considered to be in an uptrend and that's the way we're using these major swing highs and lows hopefully that made
sense now what i want to do is walk you through trending markets and kind of give you a lot of examples of trending markets to help you more clearly identify trend in your own trading so let's do that right now okay so here we are on the euro aussie for our chart and as you can see in a normal situation this would be kind of difficult to determine the overall trend of this market in certain situations right i mean as you can tell yeah we're going in a slight uptrend i guess you could say but
there's a lot of choppiness in between here and this is the reality of markets it's not what you see on youtube when people are cherry picking stuff i do it too there's nothing wrong with that when you're trying to show an example but what helps traders more in my experience is showing examples that look like normal market situations that are choppy like this so let's draw this out with the rules that we have from a starting point right down here so this was our starting point we're going up impulsive leg to a swing high we
have a swing low to a major swing high at this point what are we waiting on we're waiting on the bottom of the pullback to be our major swing low this would be the bottom of our pullback the only reason we know that is because it breaks resistance here so at this point the way we would draw this out is to our next major swing low which is right here and then the next major swing high remember we have to break and close above this high we actually don't do that until right up here so
this would be our new major swing high at this point in terms of uptrend we know that we are still in an uptrend unless the market breaks below this level of support so if it helps out while you're practicing this and drawing it do a horizontal line at all your major swing lows during an uptrend and all your major swing highs during a downtrend in order to be sure that you're still in line with the trend while you're practicing so at this point everything that happens in between our new structure high as we start pulling
back this would be our major swing level just because we've started to pull back now by more than a few candles and if that's the case after breaking here when we start pulling back by a few candles we know this is our next swing high so we have that as our swing high now we're pulling back everything in between here is just consolidation there's nothing that i personally am going to be trying to trade at this point in this consolidation if i get a deep pullback maybe i try to trade that but this isn't a
lesson on actual trades this is just me showing you trends so in this case why don't you try to point out what our next level would be since we can see price right here what would our next level be our next level will be the bottom of the pullback right all of this in between is consolidation but essentially it's just the pullback of price it's just relief from our new structure high after we have that relief we then push higher where do we break and close right here on these candles do we start pulling back
by a few candles afterwards we do so now this is our new structure high new swing high and this would be our major swing low hopefully you're seeing that at the point that we break and close right here we now have our new swing highs we're drawing out our major swing levels major swing major swing major swing major swing already circled major swing major swing this we know is a major swing once we get a push up and a break and close above our previous level so the way we would draw that out is like
this swing low up to swing high at the point that we close above this right here we know that this pullback comes to here and this is our new swing high we now need to break and close above this once we do right here we know that the lowest low of this is our pullback level and the breaking close of that is our new swing high hopefully this is becoming easier and easier pointing out swing highs and lows major swing highs and lows so at this point we've been continuing in this trend from our starting
point and although it looks choppy if you were to trade with this trend you would have won one two three four possibly five different trades before eventually the trend ends and that's something we'll discuss now trends do not last forever they will end at some point and our first hint the first hint we have that a trend is likely to end is this right here here was our previous major swing low how do we classify this as a major swing low well we had our pullback to our swing high the only way we can classify
this as a major swing level is after we break and close above this swing high so once we have that move you can put a horizontal line here or circle it do whatever you have to do to understand where an uptrend unless this level is broke and closed below as soon as that happens as it has just now here on the euro aussie excuse me here on the euro aussie just as this happens you know that this is a market telling you that it's likely to reverse this is a possible reversal situation and after this
happens we're no longer looking for a bullish trade because we're no longer in a bullish trend if we're trading with the trend now what we need to see is the market either come up and break this resistance again like so i'll move the chart like this in order to show us we're back in an uptrend and then we can start buying pullbacks again or the market to come down and break below this support level because at that point we have what i call a one two three reversal move and if we break this major support
level or major swing then at that point this would be considered a downtrend so that was the bullish examples of this what we'll do now is go to a different chart and i'll walk you guys through a bearish example of all this to be sure that you have a complete comprehension of how to read major swing levels and how to read trending markets in the bullish and bearish direction so let's head to a bearish example of all this right now all right so again with a bearish trend it's really easy to spot markets that are
doing this and say okay that's a bearish trend but a lot of times markets look more choppy than this right this is what a real bearish situation will look like and it's choppy you can't really point out easily point out major swing levels unless you have some type of rule which is what i've been explaining throughout this entire video is my rules for major swing levels so what we're going to do is start right here with this being our starting point our first major swing level with this being a major swing level and this being
our previous level of support where's our impulsive move end so what we have is a market pushing down right swing high major swing high to a major swing low and once we start pulling back by a few candles i don't have an objective rule for this again i normally want to see more than two candles and a decent pullback but again this is just something that will come with experience there's no real objective way to identify a pullback again one of the better rules i have is at least two candles and i want to see
some movement i'm not talking about two candles like this this is not this isn't really a pullback this is just two really little candles before i break out to the downside i want to see an actual pullback and i will see it consist of at least two candles would be one of the better ways i have of identifying a pullback objectively so if this was our impulsive move this is our pullback what are we waiting for next we're waiting to see this level of support broken and closed below because at that point one it solidifies
that we are in a downtrend right if we have that break then that is a guaranteed downtrend if this was a reversal move this would be our one two three move we are now in a downtrend we know that for a fact awesome we're in a downtrend and we also need this level to break so that we can classify this as the level that can't break for us to continue in a downtrend because once we have a break of this major swing low we know that this is the top of our pullback and the top
of our pullback our major swing level at the top of the pullback is a level that cannot break if we're going to continue in the downtrend and if it does break then that's showing us a possible reversal so in our case that we have on the chart that does not break and instead we get a continuation down with the market pulling back making another swing high major swing high and the only reason we know that's a major swing high is because we get a push and break below this level right here our previous major swing
low so at this point what we know is that we cannot come up and close above our previous major swing high and we need to close below at some point this level but if the market was let's say if i can actually get market replay to work right here the way we are looking at this in terms of actually placing trades is that we are looking for opportunities to go short or sell the market in anticipation that it goes further down as long as we stay below this level at 1.0851 as long as we stay
below that then we are consistently looking for possible short trades to ride continuation to the downside on this particular bearish trend let's see if the play button works now not so lucky so i'll with the power of editing show you what happens in just a second so as this pullback comes up what we get is opportunities to go short and to ride this trend down and we will continue to do so again unless this level ends up being broken which is something that has not happened at this point and instead of that happening what happens
we get a breaking close below this level again keeping us in the bearish trend showing us that this market still has momentum to the downside we also can now point out our lower high that should not be broken if we're going to continue in this downtrend there's our lower high here and this level cannot be broken if we're going to continue in this downtrend but here is when something a little bit different happens at this point what do we have we have a push down to a major swing low and then we have a break
and close above our previous swing high what is this telling us what this essentially means and we've talked about the mass psychology that charts show us what this means is indecision the market no longer wants to go lower because we broke above the previous pullback so that's telling us that all market participants are showing bullish pressure are saying that the value of this asset is undervalued we think the price should be higher but at the same time we have a ton of market participants market participants that think the value should be lower by this big
move down all this shows us is indecision in trading we call this consolidation and this is the first sign that we are about to see consolidation and indecision and also it's our first indication to not trade if we're going to be trained continuation traders this is exactly what we do not want to trade during this is when all of our losses will occur so spotting the first step of spotting consolidation is understanding trend continuation because if you understand that this is a level that can't be broken if we're going to continue in this downtrend then
you also understand that it means the market is having a lot of indecision if this level is broken because we just went from being in a downtrend to being undecided if we want to continue that downtrend so at the point that we create this move what we do then is we have a level here that is now our new high we have a level here that is our previous low before i can trade again in this specific instance i need to see one of these levels break and everything in between these two levels is just
consolidation it's just minor swing levels until the market shows me that it wants to con continue in one direction or the other like it does right here so that's showing me now we have defined bearish pressure because we broke below this low and i can look for possible bearish traits there was an in-depth tutorial on how to spot major swing levels and use those major swing levels in order to identify trends in any particular market and on any particular time frame and i know that was a very long section but you're going to understand why
it was so important as we start to get into the strategy itself right now so let's dive in for the strategy you're learning today we're going to align ourselves on the correct side of the market based around trend which is why that last section was so important but the specific way we are going to do that is by utilizing two time frames our first time frame needs to be one time frame up from the time frame we plan to trade on and we're gonna dive into that in just a second and our second time frame
is gonna be the time frame we actually place the trade on so here on the aussie canada the trade was placed on a five-minute chart so what i mean by what i just said is that the where we find the trend of this market in order to be on the right side of the market when we place our trade we want to be in line with the higher time frame trend in order to find that if we're trading the five minute chart then i'm going to look one time frame up to the 15 minute chart
now as you can see right here this is all the time frames that i use so i always go up one time frame with this strategy if i'm trading on the 15 minute chart then i'm going up to the one hour if i'm trading on the one hour i'm going up to the four hour if i'm trading on the four hour i'm going up to the daily now i rarely go up any higher than that but that is the exact difference in time frames that i personally use so again on this chart what trend are
we in you can tell because i already have it drawn out for you but this is an obvious downtrend because we have a starting point right here which is one of our major swing levels we then have a major swing level here a major swing level here and a major swing level here followed by a lower high major swing level and a lower low major swing level this tells me that i'm definitely in and downtrend i know for a fact i'm in a downtrend at this point so if i want to align myself on the
right side of the market based on my higher time frame trend then i want to be looking for short trades so the first step in this strategy is we are aligning ourselves on the right side of the market using higher time frame trend after we have our higher time frame trend another reason that it was extremely important for you to understand the concept of major swing levels is because once a major swing level is broken that is the level you want to look at for trend continuation so as this market pulls back up to this
area that's where i want to look for possible opportunities to hop on that trend and ride it to the downside as you can see this works out very often if we go back right here to our previous major swing level yeah i know i widened that area a bit but these are zones not just lines on a chart you can see that this is exactly where the market pulled back to before pushing down and breaking another major swing level so we're expecting that to continuously happen until the market shows us it doesn't want to do
that anymore by breaking through this major swing level our resistance level and creating a possible reversal so with all that being the case after identifying my trend and identifying the previous major swing level that was broken on my higher time frame and in this case that is the 15 minute chart because i'm planning to trade on the five-minute chart the next thing i do is extremely simple i just drop down to that five-minute chart i wait on the market asset whatever it is i'm trading i wait on it to come back up into this area
and then i want to see rejection and i have very specific rules for that rejection too i'm not going to leave you hanging on the entry reason don't worry the whole point of all this by the way is to make sure we have what do we say at the beginning if you're going to be a successful day trader if you want to make money from day trading you need a strategy that's rules based so you can stay consistent to it and it's proven to make money over time this is a strategy i've used for nearly
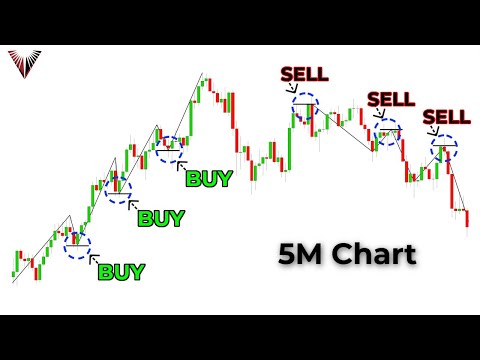
a decade and it's proven to make money for me during that time and it's also so rules-based that you can stay consistent to it one rule is higher time frame trend let's align ourselves with that second rule look for the last major swing level that was broken you know how to do all that if you paid attention throughout the video already the third rule is rejection and the way we're looking for rejection is by looking for the market to create a high come to that high and then be rejected from it by pushing lower this
is known as a double top and it's extremely simple price pattern that i use for entry reasons now one small caveat i do have is that after this double top i want to see a red candle so we have a test we have our second test of a resistance level and then i want to see a red candle here for the push down you will see that on the chart for this trade right now okay so here we have the market exactly where it was whenever i entered this trade everything's lining up about the rules
we just discussed we're in line with our higher time frame trend where at the previous major swing level that was broken what did i say i was looking for well as you can see as we push up here we get a high but then the market's not ready to continue lower because why we break through that high and make a higher high so at this point i'm not interested in going short and trying to ride this trend down until i get actual confirmation and do we get it here as we push back up no we
get a move up that ends up closing above our previous high we get no rejection at this level so what i'm waiting for is when this market is pushed down we get a push back up to that same level and then we see rejection rejection being this red candle right here and my exact rules for this i'll go ahead and share them with you is that for a double top i am looking for the market to push up and get between the high of the wick and the highest bodies of this entire little area and
i'll explain that in just a second whenever i get this a little bit darker for you so this is my area it's between the highest bodies of this previous swing high and the highest wick of this previous swing high what i want to see is wicks of candles touching this area bodies of candles can close in this area the only thing that cannot happen is i do not want to see a close above here because that's exactly what's been happening right that's not showing rejection close above close above what i want to see is rejection
so a wick needs to get into this zone or a body needs to get into this zone of a candle and then i want to see a red candle showing me that sellers are trying to take control when you combine all of that and you have your alignment with a higher time frame trend you have the market inside of a major swing level the previous one that was broken that is major structure and that's one of the most likely places for a market to continue in trend and you add all of that to an objective
entry reason as powerful as a double top with selling pressure afterwards that being that red candle then what it creates is a consistent way of trading because there's rules for every bit of it so that that equals consistence right and it creates a money making edge played out over a large sample size at least from my own point of view and my own trading that i have done with this strategy it has been one of the best i've discovered in the past 10 years of my own trading career we all know already how this bad
boy played out but we'll hit play and watch it one more time because it was a beautiful trade and earlier i said it took two hours i think it took like an hour or so for this whole trade to play out and hit about a 2.4 to 1 reward to risk ratio but this is a bearish version of the strategy hopefully that was extremely clear but just to clear things up a little bit further and to give you an example of a bullish version of this what we're going to do now is go to a
different chart and take a look at a bullish version of this strategy i'll see you there so remember when i was saying that this works on all different markets and in all different time frames right now we're going to be looking for a trade on the 15-minute chart so what time frame will i be looking at if that's the case for my trend identification to make sure i'm on the right side of the market with this trade if i'm trading on the 15 minute i want to look up at the one hour chart for my
trend identification and that major swing level that was broken last just to be sure that you understand this because it is a pivotal part of your trading career to understand major swing levels and how to draw out a trend it will play a vital part in nearly any strategy that you try to trade or if you're just someone that is going to trade with a discretionary approach you need to understand how to identify trends so from this being our starting point we have a push up to a major swing high pull back to a major
swing low push up to a major swing high pull back to a major swing low push up where do we break this level and remember feel free no way that's going to work remember feel free to put horizontal lines at your major swing levels so at this point we know that this would be our major swing level if we had more of a pullback really it's right here again no way to make this completely objective it just depends on how you see the market from here i would go to here then move my horizontal line
up we have a major swing level that's broken here so now we would have this move to a major swing level back down to an equal low for our major swing level back up now where do we break here right over here right since we broke right here that means that i'm now looking at this as my next major swing level this is my next major swing low major swing high if we move the chart forward now and i click the button one time you'll see that we have this pullback so what what are we
doing we're in an uptrend which direction do we want to trade to the upside right what do we need to point out we need to point out and draw a zone near our last level of resistance our last major swing level which is these two right here i'm combining them here because they are so close together height wise since they're both really really close to around the 278 dollar mark i'm just putting that in the middle of the zone this is just how you'll have to draw out zones they're not lines on a chart support
and resistance are a lot more like zones so in this case we have our area that we're looking at the previously broken major swing level again we're just splitting the difference between these two because they're so close together and we have the market in this area what's the next step at this point we want to drop down to our actual trading time frame which is going to be the 15-minute chart in this case and now we can actually look for what are we looking for if we're looking for a bullish trade it's not gonna be
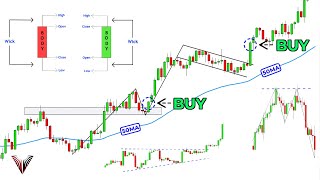
a double top right we're gonna be looking for a double bottom in this case so there we have a push up what we need to see is the market come down and now reject this area here somehow some way it needs to come down and show us rejection of that and the way we do that is just by candles getting into that zone whether that be by wicks or by candle bodies themselves and then a green candle to show us buying pressure out of it so we keep pushing forward we're in the zone and now
we're still in the zone and boom we now have a green candle this would be our actual entry the close of that candle slash the open of the next candle would be the entry for me and the way i trade this after that i would just have a stop loss below the lowest low of the rejection of the double bottom after i had my stop loss placed my target would be back up at the previous resistance level right over here and i would probably pick this one just because it's slightly lower than the other so
let's do that still set up with a 2.3 to 1 reward to risk ratio here on litecoin and let's see how this plays out as you can see the market takes off to the upside easily hitting our targets so that's a bullish version of this strategy so now let's dive into a recap of everything here on the chart of microsoft as i said works in all different markets and on all different time frames we're looking at the four-hour chart after this i have something extremely important to share with those of you who are actually serious
about starting a day trading career so look forward to that after we go through this recap right now let's recap what we've already learned let's use every bit of that strategy here on microsoft so on microsoft we start from a starting point that is right down here we have a push up to a major swing high a pullback to a major swing low a push up a pullback we're just drawing it out again as a recap and to make sure you completely understand this pull back to here when do we break above this high right
here okay so we break above the high we have another pullback and this pullback then creates a new high for another major swing level at this point what's the trend on our four hour chart we're going to be trading on the one hour so we just went up one time frame on our four hour chart we are in an uptrend while we're in this uptrend what is the latest major swing level that we broke it is right here this is the latest major swing level according to the rules of our trading strategy that we've broken
now we have a pull back into that level let's drop down to a smaller time frame if we're looking for the higher time frame trend and structure on the four hour that means we're trading on the one hour again as i explained earlier and since this is a recap i'll go over everything so if you're on the five minute looking for trades you look for structure and trend on 15. if you're on the one hour looking for trades you look for structure and trend on the four hour and if you're on the four hour looking
for trades you look at the daily for your trend and structure now let's drop down to our trading time frame what are we looking for here well in the case of a bullish trade we'd be looking for a double bottom does this meet the rules for our double bottom yes it does we have a push down we have a bottom we then have a neckline we're looking for a retest of this area without closing below it that gives us buying pressure we then get a green candle followed by an even bigger green candle which is
where our entry would be on that buying pressure candle for stop loss we would go below this low and i use something called an atr indicator i have a full video for that it's up in the left hand side of your screen right inside of your wherever it's at it's in the cards you'll be able to see it it should pop up right now atr is right up here and what it shows me is that we currently have a 2.31 cents atr it gives you the average movement of the last 14 candles that's pretty much
what the atr does to keep you in line with the volatility of the market so below our swing low i want to go down two dollars and 31 cents if our swing low is at 185 20 then i want to be at somewhere around 182.89 for my stop loss so 182 89 that's going to be close enough even though it says 92 i want my target to be back up at previous resistance right up here the previous major swing high then i hit play we'll see how this plays out and as you can see eventually
coming up and hitting those targets we did have a little gap down here but it didn't even come close to the stop loss so there is a recap of every part of the strategy hopefully that was good enough to get you to a point of completely understanding the strategy but the strategy is not all you need look on my neck right now this is a triangle and there is a reason that i'm wearing triangle jewelry today and it's because i want to share something extremely important for those of you who are serious about your trading
this is something you must master and that is the triangle of trading success so the triangle of trading success if you have not heard of it is three skills that you must have in order to make money in any financial market if you're a day trader swing trader long-term investor does not matter everyone that makes money trading in financial markets has these three skills mastered the first one is exactly what we went over today they have a strategy that they can stay consistent to and that makes money over time this is a huge part of
trading success but it's not everything in any way shape or form you also must have a risk management plan that keeps you out of your emotions and initially keeps you from blowing your account the strategy we just looked at is a strategy that wins somewhere around it's a little bit less than 50 but somewhere around 50 of the time and has a two to one reward to risk ratio this provides me with an edge this provides me with a money making strategy over long periods of time but if i risk my entire account value on
my first trade then i have a 50 gambling i have a 50 50 chance of losing that's why we need a risk management plan in place that keeps us in the market long enough gives us chips and a chair at a poker table in order to let this edge play out because otherwise we're just gambling so the important part of this is to be sure that initially our risk management plan keeps us from really having the chance to blow an account there's always a chance but it reduces that chance by 99 and the second part
of a risk management plan is to keep you out of your emotions to keep fear and greed from controlling your decisions while you're placing trades in any financial market the way we keep that fear and greed from controlling us is by making the amount we lose per trade being small enough for us to be able to handle because you will lose trades i have losing trades you will have losing trades but the important part is not to let them affect you emotionally because if they affect you emotionally you might make mistakes that ruin your edge
that ruin your statistic advantage and that ruin your money-making strategy and all of this is irrelevant if you can't find a way to have good trading psychology or discipline is what this is also known as trading psychology it allows you to stick to that strategy does not have fomo not switch strategies to not just place trades because you just got stopped out of one and now you're going to go super aggressive and you're going to risk more than normal because you just lost a trade you want to try to make that money back all of
that is emotional mistakes due to having bad trading psychology so this is something you must absolutely master in order to create a profitable trading career that was a little bonus on the other things you need outside of a strategy and if you're struggling with any of this and you want a sped up version of getting from wherever you are to creating a professional trading career then we do have some space available in the eap training program it's the first link in the description it's our mentorship program and throughout that course we take you step by
step through each of these what we do first is teach you the basics of whatever market you're trading in the case of the eap it's for forex but that's just the basics everything else applies to any market that you trade and what we do after that is teach one strategy that has been proven to make money over time for me and that is so rules based you can have a checklist beside your desk once all of your rules are checked off you can then enter the trade we have set in stone rules for stops for
targets with these strategies the full training course goes through strategies goes through risk management directly after that goes through back testing and then teaches you how to build a solid trading plan included with the program as well is what we call the best setups of the week video every monday i'll be shooting a video telling you about what i'm seeing in the market for the week ahead in terms of the best setups i see i'll also be sending you three to five trade alerts per week and on top of all of that it is a
mentor program so it comes with what's called priority email meaning any trading related questions you have it will be me answering those questions personally and the best part of all is that the eap training program comes with a 60-day money-back guarantee so if you are for any reason not satisfied or feel as though the money you have spent has not been worth it for the knowledge you're gaining email us and i'll have my support staff send you a refund asap kind of a no risk offer if you're interested in that again it's the top link
in the description if not that's totally fine too just make sure you keep it locked here by subscribing clicking that notification bell to be alerted about the free content we come out with each and every week with that said i'm gonna let you guys go i hope you trade green and i'll talk to you in the next video see you soon
Related Videos

23:23
The Ultimate Crypto Trading Strategy (This...
The Trading Channel
172,749 views

38:33
Perfect Beginner Trading Strategy (A Brand...
The Trading Channel
352,367 views
1:17:35
The Only Technical Analysis Video You Will...
The Trading Channel
22,788,829 views

20:38
Ultimate Candlestick Pattern Trading Strat...
The Trading Channel
22,122 views
47:17
The Only Price Action Trading Video You Wi...
The Trading Channel
204,631 views

55:11
The ONLY Candlestick Pattern You'll EVER N...
Ross Cameron - Warrior Trading
641,895 views

40:44
The Only Market Structure Trading Video Yo...
The Trading Channel
84,348 views
1:17:20
Support & Resistance Trading Was Hard, Unt...
The Trading Channel
1,056,418 views

39:19
Support And Resistance Didn't Work Till I ...
Rayner Teo
1,623,856 views

36:32
How to Read Candlestick Charts
Trading Academy
3,295,056 views
20:02
The Only Day Trading Strategy I Would Use ...
The Trading Channel
638,195 views
44:00
Best RSI Indicator Trading Strategy - Wyse...
Wysetrade
2,819,327 views

2:53:42
Options Trading for Beginners (The ULTIMAT...
projectfinance
16,995,211 views
55:18
How to Read Candlestick Charts (with ZERO ...
Ross Cameron - Warrior Trading
1,860,551 views

40:10
Trading Psychology - Dr David Paul
FinPort
3,362,045 views

32:21
15 Best Price Action Strategies After 15 Y...
Wysetrade
1,429,986 views

17:45
Investing For Beginners - How I Make $17K ...
Mark Tilbury
2,087,008 views
36:44
Master The Support and Resistance Trading ...
The Trading Channel
1,665,017 views
1:12:34
Forex Trading For Beginners (Full Course)
The Trading Channel
6,635,619 views

24:16
Price Action Entries For Beginner and Stru...
The Trading Channel
197,770 views