Beginner to Millionaire Trader in 2025 (10 hours)
242.34k views125788 WordsCopy TextShare

The Trading Geek
Want to become a profitable trader in 2025? This full beginner-to-advanced trading course covers eve...
Video Transcript:
in the last 5 years I've gone from makinging $0 a month to making over six figures from trading in just one month just last month alone I withdraw this amount of money from my multi6 figures trading account and for the past 5 years I've documented every single lesson I've learned along the way on YouTube and this video contains my best and most effective knowledge that can help you become a consistently profitable millionaire Trader don't worry I'm not here to ask you to buy my trading C or join my webinar there is no trading signal group
they can join for $50 a month I'm just someone who has put in the work learned from experience and figure out what it takes to succeed in the markets and today I want to share that knowledge with you as you can see this isn't just a typical trading video it's an in-depth comprehensive resource that contains everything you need to know about trading and it's going to take you some time to get through it but if you watch this video from the start to the end you will learn the most important lessons that have helped me
achieve my trading success and I'm giving it to you for completely free with that said these are my best trading strategies and tips that are handpicked by me personally with specific intentions to provide maximum value happy [Music] learning before you learn what is Forex Trading you need to understand what is Forex first so the term Forex basically stands for foreign exchange the Foreign Exchange Market is the global marketplace where the world's currencies exchange hands at a mutually agreed rate which is what we call an exchange rate these exchange rates change every single second so the
market is constantly fluctuating so what we are essentially doing as Forex Traders is that we are speculating on this exchange rate on whether it will go up or go down now the Forex Market is actually the largest financial Market in the world with a tra daily trading volume of $6.6 trillion not a million not a billion but trillion with a te it is also 200 times bigger than the largest Stock Exchange called the New York Stock Exchange right so based on this graph you can just see how huge the Forex Market is and it's basically
the market where there's the most amount of trading volume and the most amount of people you know exchanging currencies every single day right so large Financial Market lots of liquidity and lots of volume now the Forex Market is open 24 hours a day and 5 days a week from Monday to Friday and it is only closed on the weekends therefore unlike the stock or the bond markets the Forex Market does not actually close at end of each business day now Forex Trading is basically the conversion of one currency into another example you are converting the
Great Britain pound to the US dollar right so we all have probably seen this right at the airport or what not it's basically like a currency exchange boo so let's say today you go from UK you go from London and then you travel to the United States maybe you go to New York or something and in that case you cannot be using the currency they use in UK which is pounds in US right you have to convert the pounds into US dollar so you would usually go to this currency exchange Boo and tell them hey
I want to convert my pounds to US dollar and then they will give you a certain exchange rate and then that is when you are able to convert however much pounds that you have into US dollar now when you do that when you convert your pounds into US dollar you are essentially participating in the Forex market right so yeah you probably have been trading Forex without even realizing it as long as you have traveled to any other countries other than your own one then you have participated in the Forex market so Forex markets are always
quoted in currency pairs the base currency is on the left of a currency pair while the quote currency is on the right the base currency is always equal to one and the quot currency is is always equal to the current quote price of the pair so this means that the price of the pair in this case EUR USD the price of the pair is this one right here it's basically stands for how much of the quote currency it costs to buy one unit of the base currency so when you trade Forex you are essentially buying
one currency while selling another let's look at this example that we have right here for example EUR USD equal to 1.35 361 so in this exact scenario euro is the base currency right because it's on the left USD is the quote currency because it's on the right and what it means here is that it will take 1. 35361 USD to purchase one Euro okay so once again if you go Google and search let's say you want to conver Euro to USD so you search Euro to USD in Google and it will probably come up with
like a graph that looks something like this and what we have over here this is a graph that actually displays the fluctuations of the exchange rate so you can see 13 May uh on the third may it was probably only 1.08 and then right now it's like 1.09 right so it actually increased over the past few days or so so in this case when you see this right here this basically means what the Euro USD is equal to 1.09 so it takes $1.09 us in order to purchase one Euro now when you buy EUR EUR
sorry when you buy euro USD you expect the price of Euro to rise so you buy euro which is the base currency and you sell USD which is the Cote currency now if the Euro strengthens against the US dollar which means the Euro goes up right guess what you make money now when you sell EUR USD that means you are expecting or rather you're forecasting that the price of euro is going to fall so in that case you will sell Euro which is the base currency and you buy USD which is the quote currency so
if the Euro actually weakens against the Euro USD right it actually goes down then guess what you make money so this is essentially how forx trading actually works now for one currency to go up there will be another weakening against it the rule of time is that all currencies cannot go up at the same time just think about it this basically the economy of a country right the currency basically stands for the strength of the economy of a particular country so it does not make sense for all currencies to go up at the same time
that is always going to be a winner and a loser that is just trading in general trading is a zero sum game that means if one country is going up the other one the quot currency is most likely going to go down right so same thing in trading if you win that means someone out there is losing if you lose money that means you're essentially transferring your money to someone out there the winner right so Forex Traders actually weigh up whether a currency looks like Le to strengthen or weaken against another then they trade that
pair accordingly now let's talk about who actually trads for right there's a few groups of people the first one is what we have the big Banks you know the investment Banks basically the big Financial Banks and we also have your large financial institutions like your hedge funds you know your JP Morgan um basically all the big Banks out there as well as you know your hitge funds like the Soros fund even Wars Buffett booksh Hardway basically all of these large financial institutions and big Banks they trade from Forex right they actually manage like Pension funds
or investment funds and in that case they're going to use Forex to kind of hatch it right and trade with it and then we got central banks and government these people are very important when it comes to Forex because they are the ones that actually come up with the policies right to actually determine the supply and demand of a currency and when they do that that determines the price of where the market is going to go or where the currency PA is going to go in the longterm and then we got large commercial companies right
just think about it large commercial companies they might have employees overseas in that case when they pay the employees they need to convert the salary to the employees country's currency right so yeah another example could be you know when you purchase something from the large commercial company so let's say right now example I'm in Singapore and I want to purchase something from Amazon in the US in that case I go to uh I saw this book that says that is $20 us right $20 book on Amazon so I purchase it when I do that once
again Forex comes into play because my currency is SGD Singapore dollars so I have to in order to purchase that my the bank or rather Amazon will automatically convert the 20 USD into SGD so that I can pay them with SGD and then they will convert the SGD back to USD right in that case guess what I've just essentially participated in the Forex Market as well right so large commercial companies they participate and trade Forex as well and then there's the small fishes in the ocean which is us which is retail Traders which makes up
like the smallest trading volume among these other groups that we have right here so based on this big Banks large financial markets these are what we call Smart money and they are the one that actually controls the market and they are the ones that's actually able to manipulate the market so to speak right so that is why as retail Traders we understand that we have no buying or selling power that is big enough to actually move the markets so what we can do as retail Traders is that we can only try to trade with them
rather than against them that's the only way to actually make money in the markets now how do you determine whether a currency pair is going up or down how do you know when to buy or when to sell how do you know that the Market is going up or down you know how do you like predict where the market is going to go the truth is as retail Traders we can't predict where the market is going to go and we don't have to do so in order to make money because trading is simply a probability
game which means that every trade outcome is random no matter how confident you are on a trade it's always a 50% chance that you're going to win the trade and a 50% chance you're going to lose the trade however what we can do is that we can increase the probability of us winning a trade by developing what I call an edge an edge is what separates winning Traders from losing Traders you see the thing about beginner Traders is that most beginner Traders they don't have an edge and as a result they are not able to
make consistent profits yes they might make some money here and there but they will always find it incredibly difficult to profit consistently but as they Master the tree M which I'm going to go through soon and start to focus on the process rather than the outcome that is when they will transcend from the randomness of the market and start to make consistent profits so your Edge is basically your trading strategy that helps you make more profits than losses as simple as that so in order to develop your Edge you need to master what I call
is the three Ms right so the first m is Method you need to have a profit ual trading strategy that works in every Market condition the second m is Money Management right you need to know how to preserve your Capital so that you can actually grow your trading account rather than blow it and lose your money that means you need to learn how to take trades with high risk to drop ratio while keeping your risk consistent and then lastly you got your mindset which is where you need to learn how to actually control or rather
manage your emotions when you are trading your life account right especially when you have your Hoten money on the line you know all your emotions will start coming into play your fear your greed your fomo all these emotions are going to cause you to take stupid traits and make stupid decisions and it's the same goes if you play stupid games you win stupid prizes right so you need to learn how to execute trades based on mechanical rules rather than your emotions when it comes to Forex Trading we are essentially trading currency pairs so these are
essentially like your best friend now let's talk about what are the different types of currency PS and which one should you trade firstly you must understand what are currency PS currency PS is basically a price code of the exchange rate for two different currencies traded in the Forex markets all currencies are identified by their own ISO currency code here's what I mean when you see currency P like GP GBP GB stands for the great bran and P stands for pound which is the currency for the great bran so you can see all these currency pirs
right if you look at their name their ISO currency code it shows you the country and the currency and once again another example JPY the Japanese Yen and you can see the first two letters is the country which is Japan and then the third letter is currency which is Yen pair and then lastly once again the standard best friend of every Forex Trader the US dollar you can see us United States the first two letters followed by the United States dollar dollar which is the currency that is why it's called USD so basically all currency
PS are identified by this personal ISO currency code so that every single Trader when they look at a currency pair they know exactly what they are trading what country is this this currency PA from and what is the currency that this guy is tra actually trading now let's talk about the different types of currency pairs firstly you got the major currency pairs major currency PS are basically pads that include the US dollar things like your Euro USD gpusd nzdusd USD JPY USD CHF now if you're not familiar with this this is basically the Euro USD
Great Britain pound against the USD New Zealand Dollars against the USD and then the US dollar against Japanese Yen and then US dollar over the Swiss FR so these are basically the main currency pads inside the Forex Market what this means is that this major currency pairs they have the most amount of liquidity right that means most people are trading this major currency PS they are like the most commonly traded PS this means that the market tends to present us more trading opportunities when it comes to the major P USD C I almost forgot this
the USD against the Canada Canadian dollar now let's talk about Minor currency PS minor currency passs are basically PS that include any two of the major currencies except the USD so basically minor currency pass is basically all the major any of the major currencies like your Euro Great Britain pound nzd JPY CHF Canadian dollar any one of these any two of these major currencies you combine them together you get your minor currency pair and every single minor currency pair that is no USD inside it does it excludes US dollar so example Euro JPY Euro a
main currency pair JPY and also a main currency another major currency and then you got Euro CHF Euro s FR and then you got GP aod the Great Britain power against the Australia dollar and then got GP JPY Great Britain power against the Japanese Yen and then you got Australia dollar against the Canada dollar and then once again a against the Swiss front the Australian dollar against the Swiss front lastly you got the Exotic pair these are the pairs that is dangerous this is the one that we don't trade all right because why nobody trades
them first of all nobody trades them and second of all there's extremely low liquidity and low volatility since nobody is trading them which means price tends to go crazy where like a news event come out or whatsoever so these are basically the pairs that include one major currency pair and another currency from Emerging Markets like Africa Thailand um what else Mexico yeah basically from emerging markets so it's example like USD SGD the United States dollar against the Singapore dollar or the United States dollar against the thabs and then you roll against the Hungarian dollar I
think I think that's the Hungarian currency I don't know what's that and then you got the Australian dollar against the Mexican peso and then there Canadian dollar against SGD so all of these are examples of Exotics as much as possible we try to stay away from Exotics because let's be honest you're not going to make any money from Trading Exotics and if you're not going to make any money from Trading Exotics what's the point of actually going through them right this is just for you guys to understand that these things exist this exotic currency pass
exist right but for you just stick to what's work which is either the major currency pass or the minor currency pass which will present you much more trading opportunities next which currency pass should you be trading that's the million dooll question I will advise you if you are a complete beginner which I believe you are since you're watching this lesson stick to the major currency PS major currency PS like what Euro USD gpusd nzdusd USD JPY USD Swiss Fran and USD Canadian dollar the reason why I ask you guys to stick to this major currency
pass is because this currency pass have a lot of daily trading volume right and they are the most commonly traded currency p in the world which means that they're going to give you sufficient trading opportunities right especially if you are a beginner you will start to see a lot more trading opportunities as you begin to level up in trading right and this anom currency PS they can go to now the good rule of Thum that I always tell my students and what I do myself is that I will always stick to one to four currency
pairs right here you can see this is my watch list right now and this is what you should not do at the start of your trading Journey right at the start of trading Journey I will absolutely just ask you to focus on mastering one to four currency pass Max right for four is like the maximum number that's like you should not go more than four if you are a beginner right and it's always going to be better if you become a ma master of one rather than a jack of all traits and master of none
right so I'll advise you if possible focus on mastering one currency pair and maybe the reason why I want you guys to have at least like three currency PA inside your watch list is because if that one currency pair does not provide you with trading opportunity on that day you can look at trading opportunity from the other two currency pairs right so yeah stick to one to four currency Pairs and the reason why I have like three like seven currency pairs right now on my watch list is because I'm an advanced Trader right I've been
trading for four years now I know exactly what I'm doing and it's much more easier for me to analyze the charts and actually uh come up with my buyers and stuff and right now the thing is I don't even like really trade all of them you see what I do is that I put like a red flag beside the currency that I believe that there's going to be an upcoming trading opportunity and that's the one that I'm concentrating on so if you look at this I'm only concentrating on like two currency PS which is GP
and nzdusd currently because I believe that there's going to be upcoming trading opportunity so like I said focus on maximum four currency PS and you'll be good to go now in order to become a Forex Trader you have to understand the way we speak you have you have to understand the terms inside Forex Trading and that is when I want to teach you guys the Forex language and lingo this is like somewhat like a dictionary for you guys to understand the terms that is commonly used inside Forex Trading or rather used by Forex Traders firstly
what we have is Pips Pips is basically what I call or what know not what I C but what is called percentage in point it's basically stands for the amount of change in the exchange rate of a curent pair a pip is the fourth number after the decimal point so one pip is equal to 0.00001 so if you look at this currency right here EUR USD right now it's quote price is 1.92 6 in this case the PIP will be the fourth number after the decimal point so this is the decimal point 1 2 3
4 there we have that is your pip right so over here right now this is the PIP so it's basically the fourth number after the decimal point so if one this goes from 1.0 1926 to 1.0 1927 that means it increase by one pip on the other hand if this goes from 1.0 926 to 1.025 that means it decreased by one pit now let's go to a few examples so in this example right here price went from 1. 12468 for Euro USD to 1.24 70 in that case you can see price just increased by two
Pips okay and then another example right here price went from 1.25 76 to 1. 12566 price just went down and fell by 10 Pips remember how you get this 10 Pips is you take this 76 minus 66 you got 10 Pips over here 68 70 70 - 68 you got your plus two Pips and then last example right here 1 . 2176 and it increased to 1. 12276 in that case you can see this right here went from 176 to 276 so it's basically plus 100 Pips right so as time passes you will start to
familiarize yourself with this concept of Pips right this is essentially like how we used to measure the change in the exchange rate of a currency pair and it also allow us to measure our profits or loss now for Japanese yen is a bit different because Japanese YN pass only go up to two decimal places right so EUR USD or the major currency P or the minor currency P they have like a string of numbers like this right but Japanese yen currency P they only go up to two decimal places so you look something like this
1 1700 170. 67 in that case one pip is the second decimal PL the the number in this after the yeah how do I say this the number the second number after the decimal point so in this case the second number after the decimal point is this one right here so this one right here is your pip for Japanese y p so if price of Euro JPY go from 17.67% to 17.65 price just decreased by two Pips now there's also this thing called your pipets pipet is basically micro Pips it's one tenth of a pip
so a pip is like the fourth number after the decimal point a pipet is basically the fifth number right so in this case usually if you go to trading view or your broker you will see that the currency quote price looks something like this right the string of number that we have right here and then is like this small little number right here on top of like basically the PIP yeah on top of the PIP count this small little number in that case that is the pipet so right here this is the pipet and if
price goes from 1.0 19263 to 1.09 265 you can see the pet change right so 3 to 5 this means it just increased by 0.2 Pips right so one pip is basically 10 pipets so it's like 0.1 pip is this number right here right so if price goes from 1.09 263 to 1.09 265 that is plus 0.2 Pips now lot size lot size is basically the size of your position or rather how many units are you buying or selling of a particular currency pair because Forex is traded based on Lots now there's a three types
of lot size first one is the standard lot the biggest one and that is when it's what is called one lot right it's like a volume one lot in that case that means you are either buying or selling 100,000 units of that currency pair so if you are buying one lot of Euro USD that means you are buying 100,000 units of Euro USD and that means every time price increase by one pip you are making or losing $10 and every time price move by one pip that is $10 okay then next that's the mini lot
which is your 0.1 Lots in this case you are buying or selling either 10,000 units of Eur USD or gpusd right in that case every time price move by one pip is only a $1 increase or decrease and then lastly you got your micr lot that is your 0.01 lot that is the smallest lot size that your broker will allow you to trade with in this case you are buying or selling 1,000 units of Euro USD or whatever currency pair that you're trading once again and this time around whenever price move by one pip is
only moving 10 cents which is $0.1 right so that is your lot size now I want you to make sure that you really familiarize yourself with these terms firstly bullish bullish means that you are expecting price to increase bearish means that you're expecting price to fall so if I say that I'm bullish on EUR USD that means I'm expecting Euro to go up in price if I'm saying that I'm bearish on bitcoin that means I'm expecting Bitcoin to go down in the near future long means buy short means sell right as simple as that so
if I say that I'm longing Euro Euro USD that means I'm buying Euro USD if I say that I'm shorting Tesla stock that means I'm selling Tesla stock and then stop- loss stop- loss is basically a preset price where your broker will automatically close your open trade your open position if the trade does not go as planned right so when this happens it protects your capital and it prevents you from losing more money than you want to lose and then take profit is the profit goal that closes the trade if the trade do go as
plan right so if you manage to win the trade that means that price has most like slightly hit your take profit right price price most slightly hit your take profit and you got out at the goal that you set out for yourself for this trade to play out in that case the trade went as plann it hit your take profit you make a profit right then stop loss is basically the opposite so if the trade does not go as plann the broker will automatically close the trade at a preset price and prevents further losses so
now I'm going to show you your new best friend for the next 5 years or 10 years however long you plan to trade and is this beautiful software called trading view so go Google search trading view right and click on the first link right here trading View track on markets this is basically your analysis platform this is where you actually do your analysis when it comes to your charts or whatever you're trading with crypto stocks Forex Futures you know whatever you're trading you're going to be analyzing your charts here so like I said this is
going to be your wife your new wife or new husband for the next few years or so right so make yourself comfortable so first thing first when it come to this website it probably looks something like this don't know if the same guy or not but it looks something like this so just go to products and then yeah you probably see something like this or maybe you can just explore around here that's even like the community that they have right here and then you can see the different sort of stuff that you can trade you
got stocks you got ETF you got crypto Forex indices Futures bonds even about the economy some stuff about the economy there's news as well and these are the Brokers that's integrated with trading View and then yeah there small stuff right here so just go to products and just go to super charts this is basically where you can actually get the charts and then if you press this search button right here you can search anything that you want to trade and it will appear so let's say you want to trade Tesla stock Tesla right there just
click on it and then you can just launch the chart of Tesla but in this case we are trading Forex so let's just search Euro USD so I just click Euro USD and Bam I will have the chart of Euro USD right so when you look at this all of this stuff right here this is basically your Japanese candlesticks charts right so Japanese Candis charts I'm not going to talk too much about Japanese Candis in this lesson this just a walk troof on how to use trading view Japanese Candis lesson is the next one I
believe so yeah but basically right here this basically shows you price right all of these Japanese candas stics help you understand who is actually in control of price whether it's the Bears the sellers or the boo the buyers right so that is basically the chart section just go through Section with Section section by section with you guys so maybe we start with the right hand side so the right hand side we have your watch list right at this watch list you can just add whatever you want inside a watch list you know you want trade
your USD and then you want to add all your major currency pads GP USD and then USD JPY uh USD cat and then maybe even AUD USD right just add add all of these currency pads whatever you want onto your watch list so they can just focus on this few currency pads and if you want to remove any just press this x button right here bam it's gone right and if you want to add just press this plus button no rocket signs right here right right so once again uh you can actually put like whether
you on description to show or just want the logo the ther which most of you guys just select the thicker so it looks more clean and then over here you got alerts right so alerts is basically where if you press this plus button right here you can set an alert at a specific price point right so let's try it out press alert button right here and then let's say you want a alert that trading view notify you when price crosses maybe 1.10 right so 1.10 I want to alert right so you can choose whether you
want it only once or every time price actually crosses 1.10 and you can choose what alert name you want maybe you want to put uh analyze Euro USD right so put it on once you created the alert guess what trading view will personally send you a notification when price eventually reaches this 1.10 level it will send you something like either a message or an email telling you that okay bro you SD is at 1.10 you can start analyzing it or whatever you want to do with it so let me just remove that and then next
right here this is the data window it basically shows you all the data about the thing that you're trading be currency pair or stocks or whatnot it shows you all the data right here you can see the high the low everything it just adjust depending on your cursor yeah so and then you got this window right here which shows you all the different sort of stars all yeah basically everything like us Changers all sort of stuff I don't really use this honestly so we can just ignore that and you can see this is where you
can even create your own ideas when it comes to the charts you know never really use this once again but yeah this is where you can actually publish your trade idea right and then this is a chat function where you can actually chat with other people be in the Forex Community or the cryptocurrency community or even the stocks Community or whatnot right or even gold right can just have a chat with people see what other people are doing you know yeah I wouldn't really recommend you guys to use this chat function because our goal is
to help you become a independently consistently profitable Trader who's able to think on his own feed and trade independently without relying on other people so I wouldn't really recommend you to use this but if you're bought you know why not right and then this is other people's ideas ideas stream other people ideas right once again wouldn't recommend you to use this I don't use this myself and just yep and then yeah so yeah that's basically for the right side now let's go to the left side right no actually let's go to the top right so
top right here once again this is a search button right here it's the same thing you search for whatever currency pair that you want to trade just search right there and then yeah you can just you know whatever you trade just search right there and then right here we have your time frames right so over here these are basically the time frames that actually you want to trade on right so whatever time frame that you're on right now each Candlestick represent that time frame so if you're on the daily time frame what this means is
that each one of this Candlestick represent one day so this is one day this is two day this is 3 Day 4 day 5 days ago 6 days ago 7 days ago right so basically this is how the time frames work right so whatever time frame that you're on the Candlestick literally represent that time frame so right here this is the fall time frame you can see the time below or the bottom AIS you can see this is at 9 a.m. and then this is at 5:00 a.m. which is 4 hours ago and then this
was at 1:00 a.m. which is 4 hours ago right so basically that's how the time frames work if you're on a 15 minute same stuff right each one of these Candlestick represent 15 minute and you can see right now this is 12 p.m. and then this was 15 minutes ago which is at 11:45 this Candlestick was formed and then this is at 11:30 which actually created this Candlestick right here and you can see right now is actually creating a Candlestick it's creating the 15minute Candlestick and you have the timer right here which shows you how
many minutes remaining up to this 15 minutes is up and then the entire Candlestick will be formed right so we don't know whether it's going to be like something like this or something small or what not right we still know what's going to happen right we have to wait until this timer is up wait for this Candlestick to fully form and that will be your new 15 minute candles stick right and then yeah you can see these are basically all the time frames right whatever time frames that you want to have on like your favorites
right here have it on display just press the start button beside it yeah and you will have it and then next right here this is basically your different sort of charts right so there's bar chart there is hollow candles chart there's volume candles okay this is a free version right this is basically another of my account I have like the premium version like the most expensive one because trading you was kind enough to sponsor me right but basically if you're on a free one yeah you are limited to certain stuff right so yeah you liit
certain features yeah but you can see basically this where you can switch all the different charts that you want and some is like paid like the volume one right here yeah like this one right here which is really really cool but it's paid yeah and you need to upgrade and stuff right so certain features are unlocked but overall this entire platform is free for you but if you want additional features then you can consider getting the paid one right so if you're just starting out I'll just recommend you to just stick the free one that's
what I did right just stick the free one is enough for you and then uh indicator step right here actually you can get whatever indicator you want you can just search Okay I want RSI then RSI boom rative strength index boom indicator right here maybe I want a moving average and boom moving average right here moving yep you can see right there but at one at 1% club we don't teach you how to use indicator so just remove all that right so next this is your templates right you can actually save the indicator template and
it will just appear right here so like this um this you know it's like different templates basically and then once again alert window same stuff and then there's a bar play Tool which allows you to you know go back in time right you can see you just go back in time and boom you are literally back on April 1st and then you can actually you know you can see price moving which is really really cool you can change the replay speed make it a little faster you know and then boom boom boom it's basically like
a time machine where it allows you to go back in time and then jump to present bam there you go so that's basically a b replay but the free version only allows you to B replay on The Daily time frame so if you're going to go down to like the 4our time frame and B replay it will require you to get a paid version well you see right there yep so yeah that's basically for the top bar and then before I move on to the left side I want to talk about how you can actually
change your your how your chart look like so you press right click on the charts and then you press the settings and this is where you can actually change your candlesticks color right maybe it to be blue and then uh maybe you want the other color to be light blue right and then you can change the Border color as well to blue and light blue so that you know it matches itself and then boom yep so you can see you just change your entire candlestick's color and then you can also change like the grid like
the background right so if you don't really like the grid not a fan of it you want to keep your charts as clean as possible you can just go here you know you can change the great lines to none and you can even change the background color it may be on black or I don't know gray or yeah whatever or you can even choose like a green color which is quite cool choose two colors and you look like a gradient thing yeah so for me I just stick with white most of the time and then
you can never add a watermark if you want of like the currency pair you can see you just stay there forever yeah and the rest of the stuff you can just go explore on your own but basically that's how you actually customize your charts and really make it clean and make it really personalized once you're done with that make sure you save it as a template right so just press template right here save as maybe I want put like the C waves color right they just save it right this you do this because like next
time you know for some reason your charts look like this again then you can just press like right click go to color theme and you can actually change to the template that you actually save at which is like this yeah so that's basically how you do it you can see that I have like different template right here the red and blue one and YouTube one and yeah this is the normal one right so yeah that's basically how you customize your charts to make it your own once again you must make yourself comfortable because like I
said this is going to be your best friend from now on so might as well make yourself feel comfortable make yourself home right and then let's go to the left side this is where you you will spend the most time on right this is where you actually get all your tools so you got the trend line two right here which allows you to draw a line which is cool and then you got like uh I'm just going to show you like the ones that I use the most and you got horizontal Ray to right there
and then you got a horizontal line to right just put that in horizontal line and just goes like just like an extended line like this and it just drags all the way across the charts and then you got your Fibonacci right here and then yeah once again I'm just going to show you the ones that I use cuz I don't really touch all of this stuff actually like most of this I don't have never literally reuse it before right and then yeah all this stuff don't really use it before but I can just explore I
don't even know what this is yeah some stupid pattern ABCD pattern right yeah so so and then you can have your long position too which actually like kind of forecast you know what price is going to do place your stop loss place your take profit if you're entering for buy this will be a long position to which will be very useful to actually forecast your risk throughout Ratio or your short position to if you enter for sell place that there set a stop loss set a take profit find out what's your you know your risk
to reward ratio right there in the middle so yeah that's the tools and then um there's another very useful tool price range which allows you to calculate the Pips right so let's say I want to calculate what's the PIP from here to here I just drag it from this all the way up here and then this last number right here 125 Pips it basically tells me like how many Pips move is this right so just 125.638 double click on it you can customize the color that you want right make it bold or whatever wide or
whatnot you want to increase the size yeah can you don't background boom change your text color boom you know yeah I can just go and play on your own right you can add text and then you can add a color as well that says Okay I want to mark this part and say this is a bearish Candlestick or something like this right something cool like this yep and then the rest of the stuff don't use it once again yeah then this is where you can just remove all your drawings at once so if you have
like multiple drawings you just press remove drawings or you can remove all the indicators and then this is where you can actually hide your drawing so let's say like you know you marked up a bunch of stuff here right Mark a bunch of stuff here like let's say you got this and then you got this all this stuff right here you press this it just Heights everything right just your candles sticks alone and then once again you want remove all the drawing just press remove drawings right and then and yeah the rest of the stuff
you can stay in drawing mode right here which allows you to keepy one using the tool that you are stuck with right so which is really cool and yeah that's basically it and then at the bottom panel this allows you to connect to your trading broker right only these Brokers that you have right here you see right here these are the Brokers they can actually connect to right so yeah and then this is the strategy tester which I don't really use P editor don't really use this as well yeah so the rest of stuff I
don't really use it but you can explore on your own but this is basically how I personally use trading view right these are the tools that I have and once again before I forgot uh this is the favorite tools bar and if you want to add like your favorite tools into like this little two bar thing so that it appear like this you can just like easily access it like this right whatever two they one just easily access it right you need to go to the tool that you like and then just press the start
button beside it and then it will appear on this tool bar right there hey guys so this is a tutorial on how to actually use metal Trader for to actually execute your traes first things first you need to go to your app store or Play Store whatever you have on your phone and search metat Trader 4 right this is the one that I use meta Trader 4 that's also metat Trader 5 which is the more updated version the software the interface is a little bit different but essentially the same thing right so I just like
this met Trader for cuz I've been using for so long and yeah there's not much difference between metat Trader 4 and metat Trader 4 just that metat Trader 5 is just more updated it just looks much more updated right so metat Trader for once you download it open it and you look something like this right so first things first you need to go and set up your account so press settings right here and then press this button right here this actually allows you to add your life account or even create a demo account if you
want right so just press this plus button right here so two option either you log into to your broker like a live account or like a open the demo account so if you're practicing you can open a demo account that would be trading with virtual money it' be like a fake money that can actually play with and actually practice your trads now on the other hand if you are ready to actually you know connect your broker right just press this button right here and then you search your broker right here let's say you're trading forex.com
maybe like let's try orenda right here you can see then you basically choose the live broker basically if you sign up like a live account if your broker it will show you the exact details on which one to choose and all that stuff so yeah choose one yeah and then basically the instructions will be inside the email that you actually sign up the broker with right so I'm not going to show you how to do it but this is basically how you actually set up your life account just press this and then just go set
up your life account and then this is where you actually open a demo account so right now I already have an account in place this is like a live account right here so just going to walk through with you what we have right here by the way this is like a old life account I don't realize that I have like $1,000 in this account this is from like two years ago yeah this like a spare phone you can see this shitty phone anyways so let's go through this so first things first when you go to
quotes this is basically where you get all your currency pairs right so all your currency pairs if you it's like a watch list on trading view if you want to add currency pair just press add button and you can add like Forex currency pad just press this green plus button and it will go to your watch list right so whatever you want to add let say you want to add some Euro JPY or something just search and then yeah just add Euro JPY add right there and then it will appear here inside your watch list
once again this is something like a watch list there's an advanced Tab and there also a simple tab like this if you're beginner just the simple one so if you want to trade right just press the currency pad that you want to trade let's say to trade Euro USD press trade right and the other one is it shows the chart if you press chart it will show you the chart of Eur USD uh let's go to the trade first and then if you press details it shows you the details of you know the spread and
the margin and other stuff the Swap and all that other stuff right so let's say EUR USD as best trade okay so when it comes to here this is basically what you actually execute your trades right this is where you actually P the buy or sell order right so this is the price that you'll be buying at and this is the price that you'll be selling at and then this is basically where you input your lot size however much lot size you want to use you want to use a one lot a standard lot or
you want to use a micro lot or 0.5 lot or 0.26 lot 0 whatever lot that you want to use this is where actually imputed even the smallest lot that we have right there right by micro lot so that is basically how you choose the lot size right you can just you can even do this like just adjust like lot size based on these buttons right here so this is where you put the position size and this is the currency pad that you are trading and this right here it shows you what type of order
you want to actually enter for Market execution means the moment you press the buy or sell button you will automatically get into the trade right you will literally your trade will be executed on the spot however if you want to have like a buy limits sell limit of buy stop sell stop order this is what it means right I just show you on the computer so buy stop sell stop is something like this right something like this so a buy stop is basically a order place above price and price keeps going up so if price
is right here and you place a buy stop at this area right here when price eventually get all the way up there your buy stop will be triggered and then your broker will automatically get you into the trade and then a buy limit is basically you want to place an order below where price currently is so once price get below to that price your broker will automatically get you into a buy position and yeah that's basically a buy limit and a sell stop and sell limit is the same thing it's just that in this time
instead of buying you are selling so sell stop is basically an order place below price and price keeps going down and sell limit is order place above price and price then goes down right so back to the meta Trader for tutorial that we have right here so that's basically what it means to have buy limit sell limit buy stop sell stop order yeah and then this is basically where I place your stop loss whatever price that you want to place your stop loss you know you can just put it right there 1.8 1.8 uh 085
or what not 1. 782 and then you can place your take profit whatever you want to put here and stuff and then once you're ready place a stop loss place a take profit they will press either the buy or the sell order I'm just going to maybe try out give you like an example so let's use like uh let's just put like a random s loot stop loss 1.08 9 1.08 and then put like a take profit at like 1.09 and I press buy yep so that is basically how you actually execute a trade and
Bam you're inside the trade you know and then this is where it will show you this screen right here this is your basically where you actually monitor your trades after you execute your trades right here go here then this is where you actually monitor your trades to see whether your trade is hitting your take profit or stop loss how much money you are winning right now how much money you are losing right now so right now you can see this is like negative 0.05 this is a draw down because of the spread fees right so
if you click on the position you can see the details of the position the stop loss that you place take profit and yeah the S taxes other stuff and then if you want to modify the position because maybe you place your stop loss wrongly or maybe you place your take profit wrongly or you want to take partial profits right and close half of the trade and let the other half run just swipe and press this pen button right here this allows you to actually modify your trade right modify your stop loss you know maybe you
place your stop loss only modify and boom modify update it and then if you want to close the trade press this sck button right here you can see this sck button press on it and you can see you can close the trade right here right you can close uh with floss yeah basically if you press the button you will close the trade right before we do that let me just show some other stuff yeah you can also add on to your existing position just press this plus button and you can actually enter for another trade
on Euro USD as well and once again this is the chart button and this is the next thing that you want to look at before that just a quick run through on this balance is basically how much money you have in your trading account right now Equity is basically how much money you have in your trading account your balance plus your floating loss or profit right and then margin free margin and margin level all this other stuff right I will get through it inside the another lesson but basically this uh additional stuff that I personally
don't really really look I mean you don't really need to look at it right uh basically this is more on Leverage and stuff right which will run through soon but these are all on Leverage and stuff but right now you just need to understand that balance is basically how much money in you have in your trading account and Equity is basically your balance plus your floating loss or profit whatever that you have right here and over here this is basically shows your floating loss and profit right so right now we are negative 0.08 so chart
here once again chart I believe there's nothing much to say about chart is pretty much quite similar to trading view you can also add your tools right here you can have a cursor here you can add indicators here you can uh add freaking lines here yeah basically whatever you want to do it's like quite similar to trading view yeah you can see add a vertical line right and boom yeah you can just just have fun with this and you can adjust a time frame 5 minute time frame 4 Hour uh 1 hour so on and
so forth yeah so this is something like trading view I personally don't like to look at the charts here because I don't really like the way that it looks that is why I prefer to actually you know execute or analyze my charts on trading view itself and then once I'm ready to place a trade like a buy or sell order then I go on to meta Trader for and actually manually come in here and actually place that buy or sell order that's it I'm just going to be using this to execute my trads and monitor
my trads and I'm just going to be using my trading view to actually analyze my charts so yeah that's how you actually use metat Trader 4 and that's the full tutorial on metat Trader 4 and then once you close the trade I forgot to mention once to close this trade whatever trade I close you will come to this page history right here and you can see uh the trade that you Clos today the trade that you Clos in the past one week and the trade that you close in the past one month or so yeah
so yeah this is basically trade I just close you can see close negative 0.04 and you can see the profit you can see the if you withraw money you can see the withdrawal right here and other stuff that you can see right here right so balance everything so that's how use met Trad four very simple to use today I'm going to teach you how to become a successful Trader who can Bank consistent profits my name is Brett go and if you're wondering who the hell is this guy and why the hell should you trust this
guy here's what I've accomplished so far I've been trading for 5 years and I've documented my entire trading Journey on YouTube for you guys to see or at least the past three years so if you saw my videos back to the oldest you'll be able to see me live trading with less than $100 in my bank account and just basically documenting my entire trading journey and my wife when I started trading 5 years ago was that I wanted to retire my father right who was 65 year old and still working very hard to put foot
on the table and I'm glad to say that I've accomplished that goal that big why strong compelling why that allowed me to kept going this year right at the start of this year I managed to retire him so that's my that will always be my proudest movement as a son and then uh yeah like I said I lost money for two three years so yeah I'm going to be honest and transparent with you and tell you that I lost money right I didn't came out of my mom's womb and just became a profitable Trader who
is smart and intelligent I was a dumbass I made a bunch of mistakes I lost over $10,000 in one day I lost the school fees that my my dad actually paid me and I lost my life savings okay I'm a dumbass all right so yeah it might help for you to actually gain some like a relatability to me like you can relate to me that you're dumbass I'm a dumbass as well so I've been losing money for 2 three years and that's before I finally got like my breakthrough movement my urea movement where I made
over $100,000 six figures annual income right so this happened about in my third year third and fourth year right 100K so uh it also I made $1 million at age of 21 right this might seems like somewhat of like a proof or some of like a flex to you guys but by no means and I flexing to you guys for me I have to get matur and become successful at a young age so that I could really provide my family with a better quality of life now my dad is traveling anywhere you want my mom
is sitting at the back of mercedesbenz S-Class so $1 million at the age of 21 pretty impressive and then most thing like I feel like one thing that I'm genuinely proud and passionate about is this 2,000 plus happy students right so I've coached over 2,000 plus students by now right and every single one of them are happy they are successful or rather they are making progress towards success and they have achieved results recently I've interviewed some of my top students Aria who made over $25,000 samin who made over $10,000 and car who made another $20,000
from his funded account right so yeah it's crazy these students are really crazy their success is my success and I buil the fastest growing trading brand in the industry right so if you look at my YouTube channel just scroll down you'll see that I have about I'm near a million subscribers right now something that I'm very proud of because I built that Breck by Brick and that's only because I was able to comp uh I was able to simplify a complicated Concepts complicated trading Concepts is so complex and stuff so difficult to understand I'm able
to simplify them into a way that a 5-year-old can understand right that is the main thing that's the main reason why my channel blew up right and it's not because I'm the funnest guy I'm not going to lie I'm a boringest guy and it's not because I have the fleshes lifestyle it's all because of the fact that I'm able to provide tremendous amount of value which is what I hope to do in this video last but not least if you helps I've got nothing to sell you all right I've got nothing to sell you here
right by the way I hate those people who Flex the lifestyle you know they Flex their cars their chains their mansion in order to bit you into buying a cost right I'm not the type of Guru what I am is a guy who's able to do everything he can to provide value for free and also to make sure that you guys learn what you need in order to become successful so I've got nothing to tell you here right I do have like an education company 1% Club but like I said I'm not here to promote
it whatsoever right in fact I'm going to close the enrollment soon because yeah we just don't want too many customers we have to focus on our current students all right next here's basically proof that you know I know what I'm talking about I know something about making money right or I know something about trading right and I've made this amount of money from Trading so at least I'm probably like one step ahead of you I wouldn't say that I'm like 10 steps ahead of you I'm a milliona air trade TR no because that's not the
truth the truth is I'm probably just one step ahead of you I've pretty much just like figured some things out that you haven't figured it out yet so yeah I just hope to shorten your learning curve inside this video right so what is the big promise for this video the big promise for this video is that I'm going to show you how I went from0 to making my first $100,000 I'm going to tell you everything a step-by-step blueprint on how I went from $0 to making my first $100 okay from Trading as long as you
have the patience you have the attention spent to watch this entire video this journey that you're going to go through I can shorten it from 3 years to say one year right if you genuinely learn everything inside this video and you apply what you have learned and you go out there and practice with enough time you're going to reach this amount trust me it's 100% possible if such a dumbass Asian guy where this ugli spectacles can do it you can do it too right you can do it so I'm going to dissect this this entire
process into three core components right Three core components the first one is strategy right so strategy if you have a good and successful strategy this journey is going to be much more easier for you second thing is funding right obviously you need money in order to make money in trading right so you need to learn how to raise enough capital in order to reach this level because it's very hard to reach 100K if you only have $100 in your bank account right just the what I did when I started and then last thing is something
that is kind of cringe heart or mindset right A lot of people don't like this stuff but this stuff is the most important stuff ever right if you have this this can pretty much outweigh all of this stuff right here all right so yeah without further Ado let's just dive straight into it so let's talk about the first stuff which is the strategy I believe that you guys love this part right strategy and in this video there won't be any charts whatsoever if you go to my YouTube channel you see there's a ton of chart
videos so the truth is you don't need any more chart videos what you need is some real cold H pure wisdom from the trading himself right so first let's talk about strategy okay strategy now what do you know about strategy you probably know that there's a ton of trading strategies out there right and just to name some right off the top of my head you got price action you got smart money concept CS you got ICT Concepts uh you got I don't know indicators right RSI Ballinger bands MD lots of strategy out there the question
becomes which one is the best and which one do you pick my advice is always going to be so simple pick one it doesn't matter which one you pick you can become successful using any of this strategy here we got successful price action Traders right you got billionaire trading price action you got smart money Concepts traders who are banking a lot of money taking high risk to trades you got ICT concept traders who is absolutely killing the markets right and then you got people using indicators oh look at my face I hate indicators I'll always
judge you if you use indicators but we got people using indicators and still making money yeah so even though I hate indicators people are still making money using this stuff thing so my advice would be stick one and go and master them the last thing you want to do is to become a jack of all trades and a master of none right what you want to do is to be extremely good extremely proficient at one thing and one strategy only so pick one and go and master them now if you're wondering which one is the
one that I trade before I erase this what I trade is what I call Market mechanics okay Market mechanics now this is a combination of the most profitable parts of smart money Concepts ICT Concepts and price action so for me I trade all of this but what I did was that I dissected or whether I researched and I did a lot of testing on this to find out what is like the most profitable part of these strategies and I combined them together for Market mechanics and this is something that's un aod dox and has never
been done before but yeah so that's what I did and right now Market mechanics is a trading strategy is that is going to get me to making seven figures from Trading yeah cuz right now I'm only six figures from Trading tring in order for me to get the seven figures I needed to deploy Market mechanics so let's talk a little bit about Market mechanics on why so profitable and why is so useful all right so let's say you do decide to go to the market mechanics route there's an entire playlist of free causes on Market
mechanics on my YouTube channel you can just go to my YouTube channel go to market mechanics playlist you can see the entire playlist of free courses right so before you do that let me just quickly explain to you what is market mechanics and why is it so good right so now what the heck is Market mechanics right this is something that's of the Box Market mechanics this is essentially how the market operates if you can really understand how the market operates how and why price move on a deep fundamental level you can bring money I'm
not even joking right now you can bring money imagine you are able to trade alongside a smart money who move the market imagine you are able to go on a blank chart and know exactly where the market is doing what the market is doing right now who is in control of price Supply or demand and where is it going to go next that is the power of Market mechanics and what does it constitute of right so a strategy like Market mechanics it constitute of a few core components firstly is your supply and demand right supply
and demand this is where we identify certain point of Interest okay that institutions have trade or rather enter large amount of orders right like example this is the demand AAL and now we expecting price to come back down to this demand a right because this is the price that they enter a large amount of order right here right they enter a lot of buy order and now we expecting price to pull back to this a and that's when we can get our entry again because this is the price point where they are going to enter
again so supply and demand and then next is order blocks right so UT blocks is a little bit like supply and demand except that rather than just large boock of orders we are identifying like large amount of candlesticks like this right a lot of imbalance in Price Right a lot of orders being filled up at a short period of time and that we have our aut block right which is like right here right this is the Candlestick before the imbalance and now same thing as supply and demand you're just waiting for price to pull back
fill up all the imbalance right here fill up all the orders right here and then watch price move up so this are two things this is basically how we actually identify the point of interest that we want to trade from using this maret mechanic strategy and the next is liquidity right it is extremely important to understand liquidity because liquidity is essentially how and why price move right if you can understand liquidity you will not get stopped out so often that means you will not lose money and that means you you will not get your trades
you know sitting your stop loss getting kit every single time that's because you understand liquidity because if you can understand liquidity then you will not become the liquidity itself so yeah liquidity is available above every swing high and Below every swing low and obviously there's a lot of like things about liquidity I'm not going to talk about in this video like I said I've made an entire course on each one of these Concepts right here which you can find inside the free market mechanics playlist and then next it's also I believe the one last thing
is liquidity supply and demand Auto blocks is it inducements no is this is this it induc ments yeah inducement is actually part of liquidity it's basically like traps set by institutional Traders right traps set by institutional traders to actually bit retail traders to enter for the the sellup example when you see this double top right a lot of R Traders think that okay this means that they should enter for a sell and then next thing you know they enter for a sell here smart money push the price up stop up all the retail Traders and
then push price down inducements and I just realized inducement just a part of liquidity whoa Market structure how can I forget about this Market structure is King guys yeah Market structure is King Market structure is basically essentially how the price move right in an uptrend or in a downtrend or in a consolidation the ability to identify what phase of the market is it in is it the push phase or is it the pullback phase is it the consolidation phase is it the trending phase this allow us to know exactly which phase of the market the
market is in right now and then we can trade accordingly and the last thing is order flow now the last thing is order flow this is basically where we dive deep into looking at how or rather who is in control of price whether the buyers or the sellers and we do that by looking at foodprint charts and we do that by looking at what price is doing is it in the demand range Supply Range yeah and who is really in control of price that's the main thing of autoflow right so these are the one two
three four five five core components of Market mechanics and this Bas is basically how I trade right like I said I've already made a video on each one of these Concepts which you can find the free playlist yeah so anyways Market mechanics and then okay inducement is part liquidity I'm a dumbass but I think it's down yeah right now I'm experiencing a little bit of brain FX so uh yeah just h a havest gym workout you know so yeah that's for strategy right so now that you have figure out okay what strategy you want to
trade and you have picked one to actually go and master what is the next step right okay the next step is obviously to learn everything you can about that strategy example if you want to learn about marketing mechanics go and watch the market mechanics playlist that I have on my YouTube channel like this entire playlist of like around uh in-depth like I think eight videos indepth video on each one of this concept yeah you will definitely Master trading and you don't even need to buy a cost whatsoever you can learn it for free on my
YouTube channel and that is for Market mechanics oh yeah yeah basically after you done with learning all that stuff right next step is to practice obviously right you know you have learned you have practiced but how do you actually know that this strategy actually works that's the main thing that you need to do and that is what I call testing right so after you have formed a trading strategy you know you need to make sure that you can prove that the trading strategy actually works because if you don't you will always be doubting yourself and
your trading ability when you go on the market you will not be able to enter for the buy or sell button because you don't build that confidence yet you don't have confidence in your trading strategy yet and where do you build this confidence confidence comes from competence right and you're only able to build confidence in your trading plan if you have tested it out right so this is the key thing here you got to test your trading strategy out there's three types of testing that you can do and that's what I called back testing okay
back testing and then another thing is what I called forward testing and then the last thing is what I call chart exercises now this allows you to know whether your trading plan actually have an edge or not so back that's a trading strategy by the way you should do all of this for at least one month before you trade on a live account okay at least one month go and back test the trading strategy so how you back test is that you basically go to trading view you buy replay right you test out your trading
strategy on historical price data right and then how you forward test is basically every single day you mark up your charts right you mark up your charts with the trading strategy and then you basically trade on the demo account or you just see whether your markups actually work you know you mark up your chart and you think that okay price is going to go up now so the next day you check your charts again see if price actually did go up if it go up then yeah that's one win for you right so that's how
you forward test and then for back test is basically you test out your trading strategy based on historical price data and chart exercises is pretty much you testing or whether you marking up your charts on trading view itself and then just seeing whether it's correct or not so that's for testing right you need to spend at least one month doing this I don't want you guys to go and trade your your trading strategy on a life account right very very important here a lot of you what happen is that you come into trading with this
mindset where you want to get rich as fast as possible so what you do is that okay you have find a trading strategy right you have watched a bunch of trading videos be my videos or some other trading Guru videos and found that okay this guy is driving a Lamborghini and his trading strategy is obviously going to work and it's free on YouTube so I'm going to copy it and I'm going to put it on my life account I'm going to test it out on my hard earned money guys how stupid is that how stupid
is that yeah so you must test out the strategy first right to see whether it works and if it does then use it on lifeon if not switch to another strategy or rather refine your strategy until it works so that's a very important thing and I believe that's a process that most beginners skip right because all of them they just want to go straight from Z to making what 10K per month right and they just skip the process between and don't get me wrong you can easily skip the process and still get to 10K per
month which means you don't have to test out your trading strategy you can use the trading strategy and immediately you can get to 10K per month trust me this is possible but the thing is are you able to maintain this 10K per month are you able to keep the profits that you have made because in trading is not about how much money you can make it's about how much money you can keep that's the main thing right so yeah please go and test it out and yeah by the way when I talk about trading strategy
I mean things like you need to take into account your risk management right your risk management right how you actually manage your capital and then I'm so also talking about things like your entries okay where do you enter for the trade right where do you enter so that you can get like the lowest risk and the highest reward and then where do you get out of the trades right and also things like uh your trading session what time are you trading um and also what currency pirs are you trading all of this stuff needs to
be inside your trading plan needs to be part of your trading strategy for it to actually works so just just quickly just think of all this once again I already did a video on how to actually do all of this right how to actually map out your mechanical trading plan but yeah that's for strategy right so like I said the first thing you want to actually have is a profitable trading strategy because when you have a profitable trading strategy guess what your trading journey is going to be so much more easier because you already have
a strategy that is proven to work that has already been back tested and forward tested and now you have confidence in your trading strategy because you actually have trading data to back it up right so obviously you're got to be confident next is what I want to talk about and is that is funding now in order to make 100K in order to make 10K per month even in order to make let's say $5,000 per month you need funding okay you need funding buddy what this means is that right now if you're a beginner you probably
only have like less than $1,000 in your bank account or something yeah and you cannot afford to trade more than 10K right let's say right now you only you can only trade 10 K okay so oh my God Is Magic button magic pocket right here wrong color magic pocket so let's say right now you have 10K in your bank account or your trading account know that you can only make let's say $1,000 per month from Trading with 10K $11,000 per month that's the most that you can make if you are following proper risk management rules
like you know risking 1% and all that stuff the max is $1,000 per month right you cannot make more than that so in order to make 100K right oh no right here in order to make 100K per year right let's just let's just do the math a little bit 100K per year that's at least like 10K per month okay let's be a little bit conservative and just set it at 10K per month so in order to make 100K per year you need to make 10K per month how do you make 10K per month if you
are only trading with $10,000 that means you have to flip your 10K to 10K and and to 20K I mean and that's going to be very hard to sustain I can guarantee you that if you try to flip your 10K to 20K you cannot do that consistently you cannot do that every single month you cannot flip 20K to 40K and then 40K to 80k 100K it's not that simple right even though you have like a profitable trading strategy and by right you know you are just going to win every trade no that's not how it
works because trading is a probability game right it is a probability game where there's going to be a random distribution of wins and losses so even though you have a profitable trading strategy you are not going to win every single trade you will still lose some trads and you need to take into account of the losses right so in order to make 10K per month I'll say a minimum amount of trading Capital that you need to have is 100k you need at least 100K to make 10K per month and $110,000 of 100K is just 10
is 10% right so in order to make 10K per month you need to make a return of 10% every single month and I can tell you that is also quite difficult already right this is actually quite difficult so to be even more conservative by right you should have 200k in trading capital in order to make 10K per month right but let's say you know you are a genius or rather you are better than rest you able to make 10K per month so let's let's talk about how to get this in funding how do you get
100K even though you only have less than $1,000 in a bank account less than 10K you do that through PL Firs right so PL Firs are basically companies which offers you funding and if you make a profit they make they take a certain amount of profit right so there's a lot of platforms out there right so there's a lot of platforms out there that is things like your ftmo uh Alpha Capital group and then there's funded next there's a lot of platforms out there I'm not going to tell you which platform to use because I'm
not uh I'm not going to promote them or whatsoever but what I would advise you to do is to just stick fdmo because this is the one that is the most trusted the most reliable and most reputable the others I mean I wouldn't say much about them because yeah this is just the most the best one so if you had to choose one I advise you to stick with fdmo but fdmo is harder than the rest because you need to have like a you need to reach it's going to be harder to pass the evaluation
phase and the verification phase because you have like a higher Target to actually INF for right but anyways most trusted most reputable always go to fdmo now now that you have you know like know exactly which platform that you want to use and you want to purchase like a 100K account right but like I said do not do this straight away you should have tested out your trading plan you know you should have tested out your trading strategy and has some sort of proof that you have an edge because the last thing you want to
do is to go immediately get a 100K account and you don't really know how to manage risk properly and you end up breaking the rules and you lose the account and you lose the fee that you had to pay in order to get this account right so that's not the mindset to have so like I said I will advise you to only even get fund account like after six months of trading at least six months and it's very important that you actually test out your trading strategy so 100K let's say you want to make 100k
from Trading oh oh no let's say you to make 10K per month right so we are getting 100K to make 10K per month so that we can actually take we can actually make 100K a year now from this 100K in order to even get this 100K you have to pass through phase one and then phase two and then eventually then you get that 100K right after you pass through this two phases right and I'm not going to talk too much about the details on like the phases you know the maximum draw down the profit Target
that you need to actually INF in order to to pass each of these phases you can find them on the website itself but what I'm going to do is that I'm just going to quickly give you like a quick strategy on how to manage your risk using this 100K how do you manage this trading Capital very simple okay very very simple so let's off let's say start off with 100K okay let erase all that now it's time to do some math ladies and gents right because like I said what you need is a very clear-cut
plan in order to get to 10K per month okay so let's say right now today you have 100K in your trading Capital this is your initial account balance this is the money that you start with and your profit Target is let's say 110k because you go to ftmo so you need to make 10% okay you need to make 10% in order to pass phase one okay that's for phase one right so yeah so your job is to make this 10% how do you make 10% in one month this is where my funding blueprint come in
right this is the blueprint that I've actually discussed with my coach and my coach has already given it to me or no not my coach one of my colleagues inside 1% club and he's also coaching the students right so yeah so this is a plan that key has been using to BU funding challenges and it's also the plan that is really useful right I found that is really useful so I'm just going to share it with you guys for absolutely free so start 100K so let's say you win a trade and you grow it to
100 okay let's assume that every single time you take a trade you are risking one % on each trade right you risking 1% on each trade that means you are risking $1,000 on each trade and assuming that your minimum risk through R ratio is 1 is three because that's the one that you should aim for right one is to three risk through R ratio that means if you RIS 1% you will make back 3% in return all right a standard RIS through ratio that is all in for so if you are able to win the
first trade this 100K just became 103k and then let's say you win the next trade this 103k just become 106k and then let's say you're still so lucky you win another trade and you just done this into 109k and right now you're just $1,000 away from that goal right which you can easily attain this is if you are lucky enough to win three trades in a row right but obviously this is not going to happen all the time right you must either be have like a really good trading strategy like a really high rate or
yeah somewhat lucky let's be honest luck is going to play a part right here right because like I said trading is random okay now let's say if you lose what happen if you lose this is if you win this is the best case scenario what is the worst case scenario okay this is where the strategy come in the worst case scenario is that you lose 1% okay you lose 1% and now you're back to 99k you lose another 1% okay you lose two trades already now you're back to 98k now after you lose after your
account dropped to 98k right and you already lose 2% what I want you to do is to change this risk per trade this 1% per trade change it to 0.5% per trade so instead of risking 1% on each trade you only going to risk 0.5% on each trade right now until you able to get your account balance back to 100K and then from 100K onwards you can continue risking 1% but until you reach 110k so that is the key strategy here in terms of busing of funding challenges right so let's say you lose another okay
so no so you already 98k right then you you start to reach 0.5% per trade so you lose another trade and you are down to 97.5k and then you lose another trade and then you are down to 97k now obviously you're not going to lose like so many trades in a row at some of time you're going to start winning and when you start winning what happens you make Z 0.5 time three that's about 1.5% so that is when if you continue your one is three R ratio you make 1.5% you're able to bump up
from here to 98.5k and then slowly get back to this break even once you're back to your initial account balance just continue doing the 1% change this back to risking 1% on each trade and you do this until you know you reach 110k you just reach 1% per trade and you get a one is three so you just need to win about three trades right so in this case in this strategy right you can see how you lost like four trades in a row and then you win three trades I know three trades three trades
minimum because you still have one more percent right so I'll say three to four trades you win three trades you lose three to four trades and you just complete your phase one you just make 10% and that is how you make 10K per month from Trading right by using this strategy and I understand that it might get a little bit confusing so what I want need to do is that if you're unclear on this strategy go and rewatch this part right rewatch over and over again take down notes and just test it out right because
trust me this is a strategy that has gotten a lot of our students at 1% Club funded and yeah it's a strategy that my uh one of the coach inside the 1% Club used to actually got multiple five figure payouts so yeah I can tell you that this actually works so that's for funding right so that is basically how you achieve the funds in order to make 10K per month and in order to make 100K per year like I said that is 10% per month right that is actually quite difficult to actually make so the
the more amount of money that you have in your trading Capital the easier it will be for you to make say 10K per month or 100K per year right so I advise you to go for like 200k account right that's more conservative when it comes to making 10K per year I 10K per month because in that case you only need to make about 5% per month instead of 10% right so that is for funding last thing I want to talk about let me just find my green freaking marker freaking hell I the colors isself a
green okay the last thing I talk about is the most important thing ever and I know you're about to fall asleep right now so get out on your feet and shake your hands and shake your belly or something and just slap yourself in the face and pay attention to what I'm about to say for the next few minutes or so right like I said I'm going to wrap it up very very fast this is about the end soon so please don't fall asleep and listen to this this is the most important thing ever and that
is your mindset now Brad why you talking about mindset mindset is a trading video Roo this is what separates the bottom 99% of Traders from the top 1% if you can Master this one thing you will not just be able to bank consistent profits you will be able to sustain in this game for the long term right that means that you are able to actually trade for the long term three years five years however long you want to trade you can do that if you have a solid trading mindset so let's talk about it how
do you develop a proper trading mindset said or rather how do you achieve your goals first things first first thing I to talk about okay in in in this mindset training I'm not going to talk about things like a trading psychology lesson that you probably heard over and over again like oh uh if you are greedy do this if you are feeling foro do this uh take some time off the charts you know learn about trading psychology I'm not going to talk about all those basic trading psychology advice I'm going to talk about something that
works something that will actually allow you to open your eyes and that is belief belief belief is the most important thing when it comes to achieving success if you don't believe that you can succeed what you will do is that you will not take the actions that will actually allow you to become successful if you believe that you can become successful you are automatically going to be taking the actions that is aligned with your goals that's going to push you closer towards your goals and Achieve success so believe is the most important thing and if
you don't believe me here's why belief is so important belief when you believe something you're going to do things that is in accordance with the belief right so that is going to lead to actions okay so example I believe that trading is difficult so things that I'll do is that okay uh since trading is so difficult I'm not going to bother study trading or even if I do start study trading I'm just going to half as it because it's difficult and it's literally designed for me to fail so why bother working so hard on trading
believe actions or I believe that risk management is pointless right risk management is pointless is useless why would you need to manage risk if you can just have a good trading strategy you just need a good trading strategy as a result what happen next is that you don't use a position size calculator you don't manage your Capital properly and you end up taking a bunch of stupid traes take big losses and you quit trading because you just lost your entire life savings belief lead to action you can see how important this is and your actions
actually leads to your reality right so understand that your current situation in life right now or in trading is the result of all the decision all the actions that you have take so you are 100% responsible of your life your current situation right now that means if you can change your belief you can change your thoughts you can change your actions you can change your reality this is something that not a single trading Guru talk about and I can tell you that this is the thing that is going to make my students unmatch this is
the things that is going to take my students who learn this become millionair I know for a fact that this will actually create millionair if you can really understand this Loop right but I think about changing your belief it's hard because how was how was formed in the first place it's based on your experiences right so imagine there's a scale right here okay there's a scale and then there's a bucket right here and this is a green bucket and this is let's say a red bucket right so this is the bucket of positive experiences and
this is the bucket of negative experiences okay so positive experience bucket and negative experience bucket every time you encounter a negative experience about something you're adding more weight into the negative bucket so this scale will start dipping to the negative experience and when this happens what you are doing is that you are forming a weak belief on that thing right so example let's say this is the scale on Bel on how trading how difficult trading is right this is a skill on that is your belief on how difficult trading is so example would be you
start hearing your friends telling you that H bread you can't do it man like trading is difficult you know only 1% of the people become successful or trading is a scam it's only for those uh people who graduate from Finance with fancy Finance degrees and they work on Wall Street only they can become successful you can't do it so you hear a friend saying this what happens is that you are adding water adding weight into the negative experience market and when you do that what happens the skill tip towards negativity and you start thinking that
trading is difficult it is difficult and what happen is that your mind it will seek evidence to reaffirm that belief it's going to do everything it can to reaffirm this belief that trading is difficult so that's the first experience that you encounter the first negative experience and now when you believe that trading is difficult next thing you know you pull up to the charts you end up for a trade anyhow right you don't have a plan whatsoever just anyhow just press the buy yourself button and you lose the trade when you lose the trade what
happens now you reaffirm this belief and you're adding more negative experience into the market now you really believe that huh I just lost a trade is trading very difficult like what they say maybe I just suck at trading maybe I'm not born for trading as a result more negative experience and you can see this skill just keep on dipping in the negative skill favor and you will always have the belief that trading is difficult and you will eventually lose money and quit trading this is the stuff that nobody talk about I can guarantee you if
you're watching this far it's only 4 minutes in and you're still watching this you deserve to know this because this is something that literally nobody talks about and how you dip this skill back in the favor of the positive experience so that you can actually believe that okay trading is easy it's doable anybody can Master trading as long as they put in the effort they put in the time they show up every single day regardless of how they feel show up to the and C hell or high water they're going to do everything they can
to achieve their trading goals boom that's how you dip the the the skill to your favor so how you dip the skill skill to your favor and really change that belief it's by adding more positive experiences okay here's the here's the here's the cool part right the thing about your mind is that it cannot differentiate what happens in your mind and what happens in reality it cannot differ whatsoever this is the cool part this is the secret here guys so listen up so this means when you have a nightmare just just just uh think about
the times that you have Nightmare and you woke up and then you start feeling your heart bumping very very fast your palms are sweaty this is because your mind perceived that nightmare as a real life event that you have encountered in a physical world it does not know that it's just happening in your mind it thinks that it is a physical real life event what this mean for you is that what you can do is to create positive experiences in your mind right at these positive experiences in your mind in order to shift that belief
about trading and when you do that what you're essentially doing right here is that you're just adding a bunch of positive experiences to strengthen your belief that you can succeed at trading trading is easy risk management is useful right you can really use this to fix any problem that you encounter in trading be the false belief that you have of trading psychology is useless uh trading this mindset trading is bunch of you can shift your belief back by doing this and like I said you can add positive experiences by using your mind and what I
can do is to visualize right oh visualization again is a bunch of bull crap no let me tell you why visualization works because like I said earlier your mind cannot tell the the difference between what happens in your mind like a visualization or a memory in the past then compared to something that happened in your life that means you can think of a past memory or you can think about a future thought or a visualization your mind is going to think that that's the same thing as what happened in real life that's why when when
you think about your fear like just close your eyes right now and think about something that you are genuinely scared of is it spiders or ghost or or I don't know like like something random something that you are scared of you'll start to feel your your palms start getting a little bit sweaty and you start to feel a little bit anxious this is why your this so important your mind literally can't differentiate the difference between the past thought visualization or what happened in your life so what I can do is visualize when you visualize your
mind your your mind and body thinks that this is has already happened right this is your current reality and this allows you to add more positive experiences inside the market example you visualize trading is easy you visualize yourself seeing meta Trader for profits on your screen you visualize yourself going to the charts and and just executing a trade without any hesitation whatsoever you visualize yourself marking up the charts within 10 minutes when you do that once again what are you doing you are adding positive experiences inside the the positive Mark bucket and as a result
this skill is going to tip in favor of of the positive experience market so you're going to develop the belief that trading is easy trading is easy right trading is actually simple right and when that happens what what happens next when you have that strong belief that trading is easy it goes to your mind and then it results in you taking actions in accordance with your belief that trading is easy you're going to start that okay trading is easy so I'm just going to uh practice you know shop every single day do my best right
every single day c h a high water I'm going to do everything I can to achieve my goals because it is possible I'm going to create my trading plan I'm going to study the trading videos I'm going to practice on the charts I'm going to do my back testing I'm going to jum my trades and when this happens what you are doing is that you are getting better as a Trader you are improving as a Trader and when you improve as a Trader obviously money come as a byproduct and this results in you having the
reality that you desired or by changing the belief and you do that by having some sort of positive visualization right so this is not to say that oh all you need to do is to sit there and say oh I'm going to become a successful Trader I'm going to become a millionaire and automatically that will happen like your bank account will just have $1 million inside the bank balance the next day after you just visualize no that's not how it works obviously visualize but you need to put in the work you need to do the
actions that is actually required in order to achieve achieve your goals in order to achieve your your desired reality that is why this part is as important as this part you need both in a good belief that result in great actions for you to achieve the goals that you want to achieve be it 100K per year or 10K per month and if you can really Master this formula you can make more than 100K per year you can make more than millions of dollars you can genuinely Bend reality to your will and let me tell you
something this is what most highly successful people do right that's how they achieve so much success that's how they make billions and millions of dollars and it's all through this formula this is the most important lesson you have to watch in the entire course because what separates professional traders who win consistently from beginner amateur traders who lose is the ability to trade based on clear defined rules basically having a mechanical trading plan so in this lesson we're going to go deep dive into building a mechanical trading plan that is not only profitable but is actually
tailored to your trading style your trading personality and basically your trading Journey so quite frankly if you are still losing money as a Trader you either don't have a mechanical trading plan or you have one but you are just not following it consistently or the third reason could be you just have a lousy one so in this lesson like I said I'm going to go through how you guys can actually build a profitable one so that you can actually make money consistently so this is basically how the majority actually trades right they are hesitate you
know to take a good trade set up because you just went through a losing streak you know your confidence is low you're starting to D your trading ability then you end up skipping a good trade setup only to see it go in your way when this happens you start regretting not taking the set up oh I should have entered for this trade I knew it I knew this would happen after he it has already played out successfully now when you do this you are basically what I call a hindsight Trader right oh I should have
done this oh I should have entered for this trade oh my God I knew this would happen but guess what I was too stupid to not actually enter into the trade hindsight trading and then this actually leads you into rushing into a bad trade and you start forcing trades even though there's no trading opportunity because you feel like trading because you just missed a good trade setup and start to think yourself hm you know what let me just go into to the trade the next trade without really like thinking through it because I already miss
a good trade setup I don't really want to miss another good trade setup but then make no mistakes that is actually a bad trade setup because it's low quality it's not based or rather aligned to your plan and then you don't hold a trade to your take profit because you are afraid to lose your current profits and it succumb to emotions when you are trading because once again you do not have clear defined rules and as a result you don't know exactly what you are looking for every single day now this form of trading is
called discretionary trading where you are relying on your subjective judgment or gut feeling and the current market conditions to trade so basically you enter trades based on how you feel right you enter when you feel like it you get out of the trade when you feel like maybe the trade is not going to play out you trade basically based on how you feel and your intuition once again you will not make money consistently if you are always succumbing to your emotions when you are trading because you will always end up missing good trade setups and
just wasting your hard earned money your precious capital on just bad trade ideas now once again this is some characteristics for discretional trading discretionary trading basically you're relying on emotions and your God feeling and this actually allows you to take bad and low quality trade setups which really don't work at all and really not profitable it's not going to make you any money whatsoever and the thing is it's very difficult for you to back test and journal your trades when you are trading based on your emotions and you don't have like a clear find trading
approach because today you are trading this strategy tomorrow you are trading this other strategy and then the next next next day you trading based on what you are feeling on that day oh I feel like lucky today I feel bullish today so I'm going to enter for a buy you know it's very hard to track your data in this way and if you can't track if you can't measure your trading performance how are you going to improve your trading performance how are you going to refine your Edge it's impossible for you to do so because
in the first place you are just trading randomly with 10,000 different trading strategies so once again do not do this do not be a discretionary Trader so the solution to this is another form of trading called your mechanical trading now this is how the top 10% of Traders are able to make money consistently this is where you rely on a trading system to decide which trades to take regardless of the market conditions or your emotions right so in this case you able to identify High property setups because once again you are following or whether you
are trading based on mechanical rules that's on paper so if the market does this you end up for the trade if the market does not do this you don't enter for the trade you stay out of the market once again a very very clear rules based approach and it's much more easier to actually back test and journal and track your data in this way because now you are able to record your trades in a way where okay if a happens I'm going to enter for the trade if B happens I'm not going to enter for
the trade now when this happens you entering and exiting the trade the same way every single time and this really allows you to find out what are your flaws in your trading strategy so they can improve on it and this really like I said it allows that continuous refinement and Improvement where you are able to continuously get better as a tra and as a result make more money now when you go on to the market or rather when the Market opens there's going to be a thousands of decisions that you have to make in order
to execute a trade properly for example where should you buy or sell what price point is ideal for entry where you enter a limit order or a market order how do you manage your open position where are you thring your stop- loss how are you taking your partial profits you see there all sorts of questions flooding your mind at as you see the Candlestick starting to play out and when this happens it's going to be very confusing for you and this increases the chances of you trading based on your emotion based on your gut feeling
alone if you have clear defined rules in place for every single decision you have to make when you are trading it will reduce the chances of you trading based on your emotions in this way the trading system decides which trait that you should take regardless of how you feel or the current market conditions once again just to make this clear mechanical trading strategy will not completely get rid of your losses meaning you will still lose money but now when you trade mechanically you will suffer good losses because you are only taking trades that is aligned
with your plan right and this way you are able to treat these losses as business expenses because you follow your plan and the trade end up still didn't go in your way because trading is a probability game and the market is random it is what it is move on to the next trade once again when you are trading mechanically you accept the fact that trading is a probability game and anything can happen in the markets now this is a puff or rather a very dangerous path a downward spiral that majority of Traders tend to to
fall into right this is somewhat like a TR firstly you trade based on your emotions based on your gut feeling so this is your discretionary trading strategy when this happens right like I said you trade based on emotions you tend to take stupid trads right as the quote says play stupid games Win stupid prizes so you end up losing trades okay when you lose trades guess what your confidence drops you start to D yourself D hm does trading actually works like does can trading actually makes me money can I actually get rich from Trading and
then this actually cause you to miss trade setups because when you're adopting yourself you know your confidence is low you're thinking hm the chart is showing me this I should enter for the trade but guess what n I'm not going to enter for the trade because uh I just went through a losing streak and uh I suck at trading no right right then you end up missing the trade and guess what when you miss the trade the trade tends to go in your way and you sit there thinking holy I should have entered for the
trade now when this happen you become once again a hindsight Trader where you are regretting you know oh my God I should have entered for the trade if only enter for the trade I would have made $500 I would have made $110,000 God damn it I should have and this caus you once again to Revenge trade right because when you miss a good trade setup you tend to want to force trades even though there's no opportunity when this happens you start Revenge trading you start entering into trades even though there's no opportunity whatsoever you are
purely trading based on your emotion and we all know that is a recipe for disaster and this causes you to lose trads lose money and then if you go back to trading a disc discretionary trading strategy which means you're still trading based on your gut feeling and your emotion this cycle will happen over and over again the sooner you become aware of of this entire cycle this entire trap the sooner you can get out of it and then the sooner you can actually become consistently profitable so like I said this is literally how the majority
trade how the 90% the bottom 90% operate once again these are the people that is giving their hearten money into the market and you watching this it's your job to take their heart earned money and that is why I want to present you the path to success right so once again the path to failure is a discretionary trading strategy where you are trading based on emotions guesswork or your gut feeling intuition whatsoever the path to success we are utilizing a mechanical trading strategy because when you have clear defined rules in place that tell you exactly
what you need to look out for on the charts what are the trade setups that you should uh look out for what is your entry criteria how should you exit the trade all of these decisions are answered based on rules inside your mechanical plan and when this happens if like I said if this trade setup fulfills all the criteria in our plan we enter for the trade if it does not we stay off the market as this happen as time passes you record your data and now you have sufficient data in order to back up
your Edge right when you back up your Edge guess what this give you confidence competence leads to confidence when you build up that confidence or whether when you build up that solid data like you know you are winning this amount of Trades your win rate is 60% you know you have cold hard data numbers that tell you that your trading strategy is actually profitable guess what this does to your self image it makes you feel confident it makes you feel like you can actually become profitable and like I said these are all raw data that
allows you to back up your Edge and makes you feel confident and when this happens the market tends to go in your way right or whether luck should be on your side and then you master the mental game of trading you are able to figure out how to control your emotions not really control completely control but rather like how to manage your emotions properly so that you don't let them take control of you and you start trading in a robotic way and this actually leads you to consistent results right consistent results um where you're actually
making money consistently and this is when you can potentially think about scaling your Capital taking your trading to the next level and that is when you become a top 1% Trader outlier now once again this is the fundamental law remember you cannot control what the market is going to do or how much money you are going to make there is only one thing within your control and that is yourself you can control where to enter and exit the trade how much money to risk on each trade how you manage your floating positions and by having
a mechanical trade strategy you will be able to become more consistent with your trading with your actions and as a result get consistent results and make consistent profits now a good trading strategy in my opinion is not 100% mechanical or 100% discretionally discretionary oh God damn it it's so hard to pronounce this thing a profitable trading strategy is 90% mechanical and 10% discretionary which means you will still need to rely on your human judgment and emotions sometimes because the markets are always evolving and this is why majority of the trading robots or algorithms failed because
the markets will always evolve and you need to continuously TW and refine your trading plan to suit the new market conditions right so adapt or die in order to build a mechanical trading plan you need to have these four things in place firstly entry criteria secondly exit rules thirdly trade management and fourthly your risk management when you have all follow of this this is when you are able to get a complete mechanical trading plan that tell you exactly what you should do from the start of the trading day to the end of your trading day
so now let's go through one by one firstly entry criteria as much as possible try to stick to your entry rules that means if the setup checks all the crit or the entry criteria then enter without any hesitation if not stay out of the market and look for other trading opportunity so make sure you enter the same way consistently so that you don't end up missing good trade setups and you actually avoid low quality trade setups so you need to Define these things how do you map your Market structure are you using the 4-Hour time
frame are you using the daily time frame to actually map out your Market structure your bullish B of structure your bearish bck of structure your Market Shi whether price is in a pullback phase or the push phase how are you doing this what time frames are you going to be entering the trade on once again this depends on what type of Trader you are be it a scaler who is entering on the trade on like the 1 minute time frame or the 5 minute time frame and a swing Trader could be entering the trade on
the 1 hour or the 4 Hour time frame completely depends on your trading style and then does the point of interest that you are entering the trade on need to sweep liquidity because by now you should understand that we only enter the trade when price is at a point of Interest we don't enter when price is in the middle of nowhere we ENT when price reach either a supply or demand Zone and when that happens or order block and when that happens you need to ask your does this point of interest that price actually reach
need to sweep liquidity or not is it part of my entry criteria so if it needs to Swip liquidity then I will only enter for the trade at a Swip Zone if it doesn't S liquidity then I'm perfectly fine with entering the trade on a supply demand zone or an aut block that have no liquidity SW whatsoever and where are you actually entering the trade on right you need to be very specific when it comes to this you cannot just base do it based on Guess work or based on uh your your your feeling or
basically what you're feeling at a point of time right you need to think about okay are you entering on the edge of the Zone basically when price touches it or are you entering at the equilibrium the 50% of the zone or the extreme end of the zone and also what other the confluences are you looking out for are you looking out for inducements you know your push and pull inducements are you looking for liquidity price to ship either the buy side liquidity or the sell side liquidity are you waiting for your Market shift to happen
that shift of aut flow that shift of structure what are you looking for what is your entry trigger so make sure you write down every single detail and leave no stone unturn and to make this strategy as mechanical as possible so that you know exactly what you are looking out for when you go on to the charts next is your exit rules for your exit rules you want to Define exactly where you will get out if your trade does not go as planned and also where you will get out if the trade does go in
your way so once again same thing with entries you want to exit the same way consistently so you don't end up cutting your winning trades early and and you maintain consistent risk so there's two types of exits right one if the trade does not go aslain and one if the trade go as planned so your stop loss placement this is where you think about okay you want to be placing your stop loss behind your supply on demand zone or behind a swing or high or low swing high or low right and when that happens how
many Pips are you placing it behind the snd D Zone behind that swing high or low could it be two Pips three Pips five Pips or 10 Pips how many Pips are you actually placing your stop loss distance and then you need to Define how many Pips your stop loss should be right and once again the minimum is two Pips because you have to take into account the spread from your Brokers as well next for your take profit placement you need to decide whether you want to place your take profit based on a fixed R
method which means if price reaches 1 is to 3 r or 1 is to 4 r or one is sixr you get out of the trade no matter where price is or no matter what price is going to do right you just completely get out and respect your R multiple or you are placing your take profit based on technical targets right okay you is is quite subjective right you're you're exiting the trade at the next Supply or demand zone or the next swing high or low Define your exit rules because when you set your exit
rules properly you will not regret when price blows past your Tech profits because you know for a fact that you are following your plan and then if the price does hit your stop loss and end up going in a way guess what you will know that next time you need to make your stop loss wider and give it more breeding room this way you'll be able to continuously twe and optimize your trading plan while maintaining consistency in execution now for trade management once again you want to manage your trades the same way every single time
because when you are consistent in managing your trades your trading account tend to have like a steady growth like a uptrend growth rather than going through constant up down up down up down up down so you need to take into account the following thing what trade management method are you using the set and forget method or the trading stop- loss or partial profits where are you taking pares and if you're taking pares how much volume are you removing from the position and when will you start trading your stop loss how many Pips behind the swing
high or low will you be trolling and what time frames are your stop- loss and take profit on you need to take into account all of these things and think about how do you actually manage your open position properly so that you don't really leave it up all to your emotions oh I feel like taking parure profits today so I'm going to do that oh I feel like U moving my stop loss today today so I should do that so no you are just once again relying on your emotions you need a clear rule based
approach risk management so once again you want to follow strict risk management rules consistently every single time you take a trade because this actually determines how long you are able to stay in this game because remember you cannot play if you run out of chips if you run out of money to trade with guess what you can't trade and you can't make money so Capital preservation is really the most important thing ever which is really it should be one of your main focus this part right here could be one of the most important part of
this mechanical trading plan so you need to include these things how much money are you risking per trade is it 1% or 2% and then your position sizing so for this you usually go to your position size calculator after you were able to determine your risk but trade and your stop- loss distance just go to the calculator and just input everything there and the calculator will do it for you and how much money are you risking if you are planning to scale in because on the first trade you could have scaled or rather on the
first trade you could have entered for 1% you could have rised 1% and then if you want to scale in for another trade the second trade how much are you risking this time is it still 1% or is it 0.5% or is it 2% even right think about this and what's the maximum account exposure you are willing to accept right the maximum amount of draw down you are willing to accept before you decided that this is it and the max daily loss before you stop trading for the day once again this is very important because
this actually prevents you from over trading and actually lose even more money if you are encountering a losing streak so always always just remember this when you execute a mechanical trip plan that is clearly defined consistently you will no longer need to rely on emotion or guess work whatsoever all you have to do right now is to follow the rules laid out and actually execute them in real time if there is a trade setup that fulfills your entry criterial and you actually enter into the trade guess what utilize the exit rules the risk management and
the trade management part to actually think about how to manage that position if there isn't a trading opportunity whatsoever you stay out of the market as simple as that once again if it's difficult for you to stay out the market just always remember Capital preservation is key your focus is not to make money your focus is to protect your capital and then the second Focus then is to make money but once again remember you cannot play if you run out of chips so only when you have a mechanical strategy you will be able to identify
the flaws and shortcomings of your strategy so that you can continuously tweak and refine it and as a result your win rate will increase so ladies and gents just always remember consistent action leads to consistent results if you are consistent in terms of how you trade day in day out the profits will eventually come right it will eventually come I know for a fact that it will the opportunity will it present itself and when it does you execut it without any hesitation and you win you make money and that's how you do it that's how
you do it by having clear mechanical rules in your plan so now that we have established that market structure is the most important thing ever and it lays the foundation for our mechanical trading strategy let's go deep dive into Market structure right but first you have to understand the basics now when you really look at the markets and how it move and you think from the first principles it all comes down to these three ways right the market can only move in these three ways meaning it can either e go up or go down or
go sideways that means it cannot go zigzag or what whatever that that you're thinking of right let's keep things simple right basically the market can only go up down or sideways and when it goes up it's not going to go up in a straight line like this right that's not how the markets work right and when it go down it's not going to go down in a St line like this it's going to go up pull back a little bit go up pull back a little bit go up pull back a little bit before going
up even further why does this happen because it's essentially like a car right let's say you are a car and you are going to your destination at some point of time you're going to run out of fuel and then you need to stop at a gas station to get more fuel that's essentially the same thing as the market right so the buyers when they push the price up there at some point of time there's not going to be enough buyer to continue or rather sustain this upwards momentum and that is when price will pull back
so that you know the price of the asset can get to a much more better price at a discount and then that is when more Buy will jump in and push the price up even further and then this cycle just repeat over and over again right and this is basically just how the market move right if you can really understand this this is it yeah this is basically how you make sense of the market but obviously like I said it's not going to be this easy right right now look at this this looks like just
simple chart diagrams straight out of the textbook this is like the Utopia perfect downtrend uptrend diagram and this is just not what the market looks like here's what the market actually looks like right so this is your expectation and this is your reality now let's SE to understand bullish and bearish Market structure even further first of all let's look at bullish Market structure so like I said earlier price will never just go up in a straight line like this right it it will not just go up like this like in a rocket Style no it
has to go up pull back go up pull back and go up even further and this is what we call Market structure right it's the structure of the market it's the DNA of the market it's basically how and why price move right so how price works is that price will push up like this create an impulse and then start pulling back and then creates another impulse now when it does this right what it does is that it create this swing high and then it create this swing low now this low is only validated after it
led to a break of structure when price actually goes up and break the last swing High okay let me repeat myself this is very important this can only be considered as a valid swing low if it goes up and break the last swing High creating your break of structure so what this means is that after price break structure and creates a new high this high is higher than the previous high and now we are expecting price to pull back again because like I said you cannot expect price to just continuously going up like this after
it just break through the last high right at some point of time it needs to stop and it needs to rest and it needs to pull back so that more buyers will jump in onto this uptrend this bullish Market structure so that is what we are anticipating right so I want you to remember this whenever price creates a break of structure expect a pullback anticipate a pullback to happen soon right and a lot of retail Traders what they do is that after price create this break of structure they continue to buy right they continue to
buy thinking that this upwards momentum is going to continue forever and I hate to break it to you buddy but eventually price is going to start pulling back right and if you I mean there is nothing wrong with buying after price break structure but it's just that you can buy at a much better price point right at all of these higher lows so after price creat this break of structure it forms this new higher high and then that is when we can anticipate price to pull back and pull back it's going to pull back to
create a new low a new swing low that is higher than the previous swing low and then it goes up again creating another break of structure breaking past the last higher high and then create another higher high and higher low so this is basically how a uptrend is formed a uptrend a bullish Market structure whatever you like to call it is formed when price is creating higher highs and higher lows higher highs and higher lows bullish Market structure all right so in a downtrend it looks like this right it's the opposite of a uptrend so
price will goes down pulls back create a new high before price goes down break through the last swing low creating your bearish break of structure and then that is when we are anticipate price to start pulling back again right and then that is when price start pulling back again creating another lower high and then it goes down even further to create another lower low right so in the downtrend price will be making your lower high and lower low and remember guys this lower high can only be considered as a valid lower high after it has
led to a break of structure okay after it has led to a break of structure so the key here is that it needs to break structure right in order for this to be considered as a valid high and in order for this to be considered as a valid low a valid swing low it needs to break structure all right so get that through your hit so by now you should know that a bullish Market structure is price creating higher highs and higher lows and beish Market structure is where price is creating lower highs and lower
lows like I said obviously this is not what the market will actually look like sometimes it will look like that maybe like 5% of the time to be completely honest with you right most of the time the market looks like this right it looks like a gigantic mess right and when you look at this right I always want you to really think about where are the swing highs and where are the swing lows because if you can identify that then you can make sense of the market structure and you can determine whether price is bullish
or bearish right so let's go go through the the real graph right so over here this is when price once again push up and then push back and then push up after price push up and break through the last High it creating a break of structure what it did is that it created a minor pullback okay A minor pullback not a significant pullback yet so after that price just continue going up even higher before price starts creating a major pullback now once this major pullback happen this is the last swing High okay not this one
right here it will be this this one right here because this is the last High the highest point before price starts pulling back okay and then that is when price starts pulling back and it starts creating uh this bearish move a little bit right because price is going to turn bearish after I mean price is going to turn bearish when it's pulling back right in order to facilitate that pullback right and then that is when price goes down here and then it creates a new higher low right here before price goes up even further and
yeah eventually break the last swing High creating a break of structure so in this case bear in mind that the higher low would be the low that led to this break of structure that means it will not be this one right here it will not be this one right here but the lowest point okay the lowest point that led to the break of structure and then that led to price creating another higher high higher low and another higher high right and then in a downtrend this is when price goes down pull back goes down and
then starts pulling back starts pulling back heavily and then when price creates another lower high before price goes down again and creates another break bearish break of structural right breaking past the last lower low leaving us your lower high right here the highest point before price goes down and break structural and then it led to a lower low and lower high again right and then just continue going down continuing this bearish Market structure right so basically right now for now you just need to understand that bullish Market structure higher high higher low bearish Market structure
lower high low low and then we are expecting a pullback whenever price break structural so after price break structural you are anticipating a pullback and the pullback means what that means the market is going to go against the swing trend for a short amount of time in order to facilitate the pullback right so in this case since it's the uptrend that means the market when it's pulling back is going to go into like this minor downtrend right to facilitate the pullback before the uptrend continue again and go up even further same thing of the downtrend
since the overall trend is downtrend right the market is going to turn bullish for a short amount of time to facilitate that pullback before going down even further right so next let's talk about swing highs and swing lows how do you determine which one are the valid swing highs and which one are the valid swing lows okay very simple you always want to look for the highest point that no the lowest point that creates the break of structure and lead to a swing high and that will be your swing low in a bullish Market structure
and then in a bearish market structure you always want to look for the swing High which is the highest point that creates breakout structure and lead to a swing low let me show you some examples right to help you get a better understanding and then this is when once again price push up pull back and then goes up like this all right so this is obviously this is obviously a swing high this is obviously the swing low and then that is when price goes up up make a minor pullback and then goes up even further
right so at this point of time price has not made a significant pullback yet right it has not made a significant pullback to create a new swing low yet so we still wait we wait until price starts giving us a signifant significant pullback like this right price goes bearish to facilitate that pullback right and goes all the way down here now after this look at what happen next price revers and goes up and then led to a break of structureal so you just need to identify the lowest point that creates this break of structure that
led to this swing High being broken right and if you look at the lowest point it will not be this one right here because that's a lower point and it's not this one as well because that is a even lower point and you'll be this one right here this would be the lowest point that actually led to this swing High being broken right and then led to a new High being created right here so this is your swing low okay so if you need help when it comes to identifying this right just use a box
to on trading view right just click right here box to you just mark up the higher high right the one that just got broken drag it out like this and then pull all the way down to the lowest point okay the lowest point of price and you'll be this one right here so there you have it you will be able to find your higher low your swing low right there and then there when price goes up even further right creates a new higher high and it starts pulling back pulls back and create another lower high
right this is to facilitate the pullback right it's going to turn bearish to facilitate the pullback before price goes down even lower creating a new swing low before price goes up and break structural so same thing at this point of time you're asking yourself okay since price just broke this last swing High what is the lowest point that price went to that led to this break of structure so you can use this box two method right drag it out and go all the way down to the lowest point and you will see is this one
right here this will be the swing low that means you must go all the way down to the lowest point not this one right here guys the lowest point that led to the break of structure so that is how you identifying your swing low and swing high in a bullish Market structure now in a bearish market structure it's pretty much the same thing right price goes down led to a break of structure and then it starts pulling back right we anticipating that pull back and then once price starts pulling back pulls back all the way
up here before price goes down even further and then price goes down even further break through the last low right break through the last low low creating a bearish break of structure so at this point of time you're asking yourself what is the highest point that created this break of structure and led to another swing low being formed right here right that led to price breaking past this last low right so you can use the box method this time drag up find the high highest point that led to this break of structure and you'll be
this one right here right be in mind it will not be this one right here because that's the higher point it will not be this one because that's even even higher point and you'll be this one right here so this is the highest point that price went to before it led to a break of structure right so so on and so forth same thing right here this is the highest point before it led to a break of structure now why is it so important for you to actually understand this valid swing highs and swing lows
because more often than not I found that most Traders when they just started out they end up marking the wrong swing lows and the wrong swing highs instead of marking this low right here they think that this is the swing low right and if you mark this as a swing low it's invalid because what happens next is that later on you will learn about Market shift which means after price break through the swing low right that means price is going to reverse to becoming a downtrend in an uptrend like this so if you mark this
as a valid swing low right here now if price goes down and break past this supposedly swing low that you that that you have marked up you're going to think that price is going to reverse when in reality it is just pulling back right so that can go up even higher and it's all because you did not identify your swing low properly right so please make sure you really try and get this trip hit right Mark the lowest point that is the swing low and the highest point is the swing High okay and also bear
in mind that this lows and this highs they'll be somewhat protected right which means in order for price to actually continue this this uptrend right price cannot bridge this higher low right so if price goes all the way down here and it Bridges this higher low most likely this uptrend this bullish Market structure is compromised and it's going to turn bearish soon right like I said don't worry about this because we are going to learn about this later for now just know that it's important for you to identify the correct swing High and the correct
swing lows now let's talk about swing range now swing range is basically the range between your swing high and your swing low now that you have learned how to identify your swing high and how to identify your swing low it's time to understand how to identify a swing range and your swing range is basically the a that is in between your swing high and swing low as simple as that no need to complicate things whatsoever here right so in this case we have your Swing Swing High I mean swing low right here right which we
have validated right this swing low is the lowest point that led to this break of structure and created this new high right there so this is the swing low and then you must ask yourself where is the swing High the swing high is the highest point before price starts pulling back and it'll be this point right here right so this is a swing high and then this is a swing low now this is basically your swing range right after you marked up your swing high and swing low this entire range right here will be your
swing range and be in mind this is the range that we want to be focusing on that means we will not be giving being ass shared about what price is doing all the way back like years ago weeks ago no you want to focus on what price is doing within the swing range itself right what price is doing right now right and then based on this you must understand that as long as price respect this swing range no matter how low it goes as long as it does not break past this swing low it is
still considered as a uptrend it is still considered as a bullish Market structure right so what this means is that price can after creating this break of structure we are expecting or rather anticipating price to start pulling back right so that is when price starts pulling back okay it starts pulling back goes down goes down pulls back that means it can go all the way down all the way down here and is still counted as a uptrend right and it because this is still essentially a pullback as long as it's still within the swing range
right eventually if price breaks out of the Swing range that is when we have a problem that is when price could potentially reverse to becoming a downtrend right so for now you can see price just keep on pulling back and respect this swing range right come back all the way down to this low low before going up even further like this this means this is a continuation and price is just going to continue going up right this bullish Market structure you just got to continue right so in the downtrend same thing right your swing range
will be the swing high and your swing low and that would be the range between the swing High and the swing low is pretty much the same thing right so in this case you can see this is the lower high and then this is the lower low this means that price can pull back after break this break of structure it can pull all the way up here right and is still considered as a bearish market structure unless price break through this last swing high right then there could potentially be a reversal so yeah price can
most likely come all the way up here and then it can still go down and create another branish bre of structure and continue this lower high lower low Dynamic continuing this bearish Market structure all right so yeah please get this through your head guys this is very important like I said this is the basics this is the foundation and bear in mind that within this swing swing range itself right you will notice that that is also your internal structure because this is your swing structure right your swing High swing low this is your swing structure
and within this swing structure there is minor Market structure being formed internal Market structure being formed like example in this case right here price goes down create a lower high lower low lower high and then another low right here so in this case this is not part of the Swing range because this is just what price is doing within the swing range right I mean this is not a swing high or this is not a swing ho swing low right because we have identified that this is a swing high right and this is a swing
low so this is not counted as a swing high and this is not counted as a swing low in that case this would be your internal low and this is your internal swing high so internal swing High internal swing low right and this is basically your internal structure right everything that is contained between this uh swing highs and this swing lows this is your internal structure right same thing right here this is your internal structure for now don't worry about this yet like I said focus on mastering the boring fundamentals right focus on building that
Foundation getting the basics right before we can even talk about internal structure right last but not least before we wrap up this basics of Market structural CA I want to actually go through your string strong and weak highs and lows so earlier on we talk about how to identify valid lows and valid highs and it's actually leading to this part right here this is where we can learn where where exactly to enter right I want you to keep things very simple once again right when it comes to bullish Market structure your there will be strong
lows and there will be weak highs when it comes to bearish Market structure there will be weak lows and strong highs let me explain what I mean when I say weak or strong right because how do you really Define what is weak what is strong so in a bullish Market structure price goes up and then it pulls back and then it goes up and create this break of structure right when you create this break of structure this is basically price breaking past the last swing high right which tell us that that this high is weak
okay it is a weak high and it can be broken and when it create this break of structure this tell us that this low is strong right this strong low is formed after this break of structure happened this means that the buyers pretty much overpowered the sellers and push price up and reach the last high so this is how your weak High the THM weak high is formed and yeah and strong low is formed right so in the uptrend the lows are strong because price is just creating that higher lows right and just respecting and
just going up like this and just continuously breaking past the last high right just breaking past the last high so weak highs strong lows okay and same thing right here right in in this case right here price goes up create a high pulls back and it led to a strong low breaking past the last week high and then starts pulling back creates another high right and then starts pulling back once again and then it creates another strong low before price create the break of structure right breaking past the weak high so in this case right
I want you to take into account this tip that I have for you guys to really keep things simple we want to trade from strong structure trade away from strong structure and we want to Target weak structure this means in a bullish Market structure like this we want to trade from these strong lows that means we want to enter for a Buy on this strong low right there and then when we enter for a buy right there where should we target we want to Target the weak highs right we want to Target right here so
if I enter for a buy right here I'm going to be targeting this a if I enter for a buy right here I'm going to be targeting this a okay same thing right here right I'm trading from strong structure I'm entering for buy here I'm entering for buy here I'm entering for buy here at all these strong lows and then I'm going to be targeting this week highs right there so in a bearish market structure right you pretty much once again be the opposite so this is when price goes down right pulls back and goes
down and led to a break of structure now in this case it's the opposite this case the highs are strong right because it's the highs that actually led to a break of structure and led to price breaking the last low so these are weak lows and these are strong highs okay so continue price continue creating a strong highs weak lows Strong high weak lows right creating that briish b of structure right same thing right here so in this case this varish scenario using this principle where we want to trade from strong structur and Target weak
structure that means we want to enter for a sell at this strong highs right we enter for a sell here at this strong High enter for a sell here at this strong High enter for a sell here at this strong high and Target where our weak lows that we have right here okay so in this case right here there's a low B form there's a high right here right this is a strong high right so if I enter for a sell right there I'm going to be getting out right here at this Weck lows right
and same thing right here right if I'm Ming for sell right here I can easily get out at this week lows right this is basically the principle now for now I don't want you guys to worry about this too much right I don't want you guys to worry about where to enter and where to exit for the trade yet like I said focus on the foundation focus on really making sure that you master all of these basics of Market structure before we move on to bigger things right so just to give you a quick recap
in a uptrend price will be creating your higher highs and higher lows right and when it creates higher highs and higher lows like this is going to let uh this high this high low is going to Le to a break of structure right where price break through the last swing high that is why price is able to create these higher highs and higher lows because it's continuously going up right and just breaking structureal and then that is your strong low being form in a bullish Market structure and then that is your weak highs right strong
low weak highs and you want to trade from these strong lows and you want to Target this weak highs and then we also talk about your swing structure right and your swing range so swing High swing low this will be a swing range right swing High swing low this will be your swing range and then last but not least we also talk about how that is three types of trend right your uptrend downtrend and consolidation and you always want to just be asking yourself is the market going up down or sideways and then based on
that you can trade accordingly right example we have determined price is uptrend then we can look for buys right here right and then if we have determined price is downtrend we can look for sells right here at all of these strong highs right so yeah basically like I said the thing about this basics of Market structure is that you guys must really understand this because this is pretty much what forms the market this is the DNA before of price right so if you can really understand this then you can really make sense of what the
market is doing what is the trend right now who is in control of price and then you can trade accordingly accordingly and make sure that you are on the right side of the market right so yeah go and try to really make sense of this right rewatch each lesson if you need to now when it comes to Market structure it can get confusing because you watch a YouTube video and it shows you something like this and looks very simple on textbook on a video but when you go to the actual charts you are confused by
the different Trend Direction price going up then down then up then down up down up down up down and just going in circles and you are sitting there confused on whether price is actually in uptrend or downtrend and that is when I'm going to give you a secret the secret is a run on a higher time frame is a trend on a lower time frame so what does that mean if you look at this right here it's a uptrend price is creating your higher highs and higher lows higher highs and higher lows and every time
price push up that's a run and retrace that's also a run and then push again run run run run run so this whole thing constitute a trend so that is what I mean when I say that a run on a higher time frame constitute of a trend on a lower time frame So within all these runs you will see your mini Trends right you'll see price getting higher highs higher lows in the smaller time frame the lower time frames and then it starts pulling back and actually revers to becoming a downtrend on the once again
the the lower time frame and then reverse and hit back up creating your uptrend again and then creating your downtrend again so in this case you can see on the higher time frame price is actually making a very nice uptrend right higher highs higher lows higher highs and higher lows but if you go down to the smaller time frame like the lower time frame you will actually see price creating these mini Trends right price is creating this mini uptrend mini downtrend mini uptrend mini downtrend so that is what I mean when I say that this
overall run consists of a trend on a lower time frame same thing right here this run consists of a trend on the lower time frame so a run on a higher time frame is a trend on a lower time frame that is the key remember that because to be honest once I really understood this that is where I just like open my eyes to really the way the market move like I'm able to be in sync with the market right now so if you still don't understand let me explain it and simplify even further now
let's look at the higher time frame structure first so price is going up and then it starts pulling back and then price is going up again creating your break of structure right price break the last High creating your break of structure somewhere right around here so now price has created a new high and a new higher low so higher highs and then price starts pulling back again creating another higher low and then eventually it goes on goes on until price price eventually loses steam right remember nothing goes up forever whatever goes up must come down
So eventually price will lose Steam and then what happens is price will go down break past the last higher low creating what I call the Market shift so the market shift is the first sign that this overall trend is about to end and right now the trend is going to reverse to becoming a downtrend so once a market shift is present price broke through the last higher low we are expecting in price to pull back to create a lower high to confirm to us that price is in bearish order flow right now and price is
about to collapse to becoming a downtrend and that is exactly what price did right price cre a lower high right here and you can see this high is lower than this high right here so this pretty much just confirmed to us that this overall uptrend right here it's over right it's game over now it's downtrend so we should be looking to shorts and then you can start seeing price go down even further and then pulling back again again and then go down even further creating your lower highs and lower lows right simple basic Market structure
and this is what price looks like maybe on the higher time frame on the 4H hour or the daily time frame right very smooth very easy to read but once you do your top down analysis things start to get a little bit more confusing once you start going down to the 4our time frame and then that's the 1 hour time frame and then there's the 15-minute time frame things start to get a little bit confusing so now let's go down to the lower time frame so the lower time frame structure is this gray color line
that you see behind the big bow black big black bow lines okay first of all when you look at the lower time frame structure always remember what I say when I say that a run on a higher time frame is a trend on a lower time frame so this is a run which means within this run itself there's going to be a mini uptrend right price creating your higher highs and higher lows and then eventually when it start pulling back right when price starts pulling back it's going to pull it back first on the lower
time frame so you'll start to see price breaking structure on the lower time frame first so you'll probably see some sort of Market shift happened right here right you can see a market shift happened right here where price broke through the last lower I mean last higher low so this pretty much tell us that this run right here is about to retrace because this bullish uptrend on the lower time frame has just been broken and right now price is about to retrace because price has given up has a market shift so we are expecting a
pullback right here and then when do we know the pullback is going to end when do we know this overall pullback is going to end when that is another Market shift that means price has to break the last lower high so right here price starts creating a lower highs and lower lows and this is the last lower high right here right and then price starts shooting up breaking past the lower high once again indicate to us this retracement is done right so we should be looking for this continuation right here price is going to continue
to become an uptrend and that is exactly what price did and then the same thing happens again once price start pulling back guess what we are waiting for Market shift once again to take price all the way up and so on and so forth right you can see these things don't change this is essentially how price move right it creates the same patterns on a higher time frame on a lower time frame and that is why I say the market is fractal because whatever Market structure that happens on the higher time frame happens on the
lower time frames as well and what happens on the higher time frame must first happen on the lower time frame and now if you really understand this it becomes much more easier to trade so the next time price breaks structur and starts creating another higher high you can wait for price to pull back and then that is when you can look for your buy position at these pullbacks right here but how do you know when to buy when the lower time frame Trend this bearish retracement ends when it ends when you get the market shift
that is when you know the trend is about to continue and that is where you can get in for a buy position right and then same thing right here eventually the trend revers and first things first it revers on the lower time frame right so I want to point your attention to right here where the trend is reversing you can see the higher time frame structure it only starts creating the market shift right here but if you actually go to the lower time frame structure right you actually go down to like the 1 hour time
frame you will see that it already already give you this Market shift somewhere right around here right somewhere right around here you already know for a fact that this overall entire uptrend is about to end right it's about to end so this is where you could have easily got in for a sell position right here at this Market shift ideally when price retrace create this low high right here ENT up for sell there and take it all the way down and this is how you catch this insane reversal trade setups now so this higher time
frame structure you see right here this could be on the daily time frame so what does it actually looks like on the weekly time frame on the weekly time frame it could look something just like this this huge up move and then this huge pullback right here and before price actually creates another up move so on like the weekly time frame or something this could just be a complete retracement so this wasn't really a downtrend but in reality it's just a retracement of the overall higher super duper higher time frame Trend so now that we
are actually on the charts let's apply whatever we have learned so far so right now you can see that price was in an uptrend right because this is on a higher time frame and you can see the 4our trend is very bullish price is creating your higher highs and higher lows right higher highs and higher highs higher lows higher highs higher lows higher highs higher lows higher highs and higher lows right very very clear everything is good so far it's a good day to look at the charts but then like I said if you go
down to the smaller time frame you will start seeing this as something will look something like this like it would just like start declining very very much and they look at this again and they start seeing price creating this downtrend and you start thinking that this is actually a downtrend like I said when in doubt just zoom out right just zoom out to the higher time frame and everything will just mix so much more sense for you So eventually price starts going over here and it starts consolidating losing Steam and then eventually it creates our
Market shift somewhere right around here this was the last higher low right this the last high low and then price breaks through the last high low creating your Market shift now the moment price break through the last high low creating your Market shift we are waiting for price to create the lower high which it did right here right it created a lower high right here this high is lower than this high right here which pretty much confirmed to us that price is about to go down now if you look at this maybe we can go
down to the small time frame and you can start to see that okay that is actually bearish order flow right there's a lot of selling moment momentum selling pressure right here but before this actually came in there was actually this big bull Candlestick right here this B bullish Candlestick right here right so this was the last sign that show us that there was still some sort of bias at this zone right here but after that price just started collapsing you can see price starts collapsing break through this last higher low with such a huge amount
of selling pressure and selling momentum you pretty much know that price is about to go down right here so from this onwards we are looking for sell position right we are looking for sell position so we wait for price to pull back and then we can potentially look for our sell position somewhere right around here and that is when you can see price just starts going down right easy as that right this is somewhat like an order block so if you don't really understand order block there's another video on that I'm not going to dive
deep into it and that was how I managed to like predict this move right here right basically all these order blocks where price actually retest it and then go down even further yeah so I'm not going to dive too deep into entry but you can see this is what the lower time frame structure looks like right price starts pulling back once again and then before going back down even further and then pull back again and go down even further creating your lower highs and lower lows in uh downtrend right basically a downtrend when you identify
your multi-time frame Market structure you need to know exactly where to enter for the trade so that you can get this high risk through your ratio trades and the truth is you want to entle when price is cheap if you're entering for a buy and then if you're entering for a sell you want to sell at the highest point right Buy Low sell High clear as day so ideally in this uptrend right here that we have we want to enter in the lowest point right it could be here right here or it could even be
right here right ideally my entry will be right here let me explain why step by step to get you to my sniper entry strategy whatever you like to call this all right so first of all let's start off with the higher time frames right the higher time frames the 4our time frame right so we see that price has been creating your push phase right price push up and it starts to retracing and then push up again breaking past the last higher low that we have right here now once price broke past the last higher low
right here it created this low right here right this pretty much validate to us that this is the last higher low so this is the last higher high and this is the last higher low and now price is creating your new higher high right and right here price starts going up and it pull back a little bit before go up even further so I wouldn't really consider this one as a valid pullback right because price did not really create like this valid strong low right so this could just be a very weak pullback like a
mini pullback before price goes up right once price goes up right it created this higher high when price starts retracing massively all right so here we have our 4our high and then we have our 4H hour low so these are the two points that we need to take note of right these are the strong points that price will have a very strong Supply or demand so the minute price actually broke through the last higher low right right here your next step is to wait for price to pull back right because you cannot be entering right
here right here right here or right here if you do your stop loss must be all the way down here right you want to get the best entry right and chances are you have already missed this up move then in that scenario you can potentially wait for price to pull back so the minute price starts pulling back how do we know that price is going to enter a pullback phase when price actually break through the last higher low now if you look towards the left where is the last higher low the last higher low is
right here right this is not a very strong low right this is the last higher low of this like push phase so the minute price actually goes down break past the last fractal higher low we know for a fact creating our Market shift that is when we know that price is about to retrace price is about to enter the pullback phase which means we shouldn't be buying anymore right like I said over here yes you can enter for buy right here still but your stop loss must be all the way down here and that is
not what I will personally do right that is when right now price is in a pullback phase the minute price starts entering the pullback phase we are in this downtrend and we don't know exactly when this downtrend will and that is when we should not enter for a buy anywhere here so right here that is where bearish order flow takes place and it starts creating your lower highs and lower lows and lower highs and lower lows right like pulling back like I said right where is it going to pull back it's going to pull back
to a place where price is cheap remember if you think about how smart Money Trade right they're not going to be buying up here they want to buy at a discounted price like I said Buy Low sell high so they're going to buy somewhere down here within this bullish order flow area near this previous last higher low where there's going to be a lot of demand at around this area right here because remember if you look at the higher time frame price is going to create a higher low right here before pushing up even further
so we expecting price to retrace all the way down to somewhere right around here right somewhere right around here you'll probably find like some sort of demand zone right here or some sort of order block a right here for you to actually enter for the trade let me just quickly recap again so over here this is the 15minute time frame Trend right this is the 15minute time frame Trend and right now price has done bearish to facilitate this pullback so right here price is going to retrace to a discounted price what I like to do
is to actually have my premium and discount to right here you can see this is where price is the premium that means that price is expensive and this is when price is in a discount below this 50% level right here and most likely price is going to retrace to the discounted price and I draw it by marking the swing High to the swing low right here so price is going to reach Trace to an ail a strong point of interest within this discounted Zone like I said it could be at a demand Zone within this
discount AEL or some sort of order block a right here right we don't know that is why we play by so let's just assume that there was a demand Zone somewhere right around here and price has managed to get down to this point of Interest right get down to this strong demand zone right here so the minute price gets down to this demand Zone we can look to enter for a buy but we never ever want to assume that price is is going to mitigate this demand Zone because chances are price could go down even
further to touch this 4our swing low to grab liquidity before fueling this up move this continuation move so we never ever want to assume that price is done retracing that is why we want to play by to wait for our Market shift we want to wait for this pullback phase to end to switch to bullish from this bearish order flow to bullish order flow and that is when when price starts to react at this demand Zone we are still patiently waiting to see what price does whether price actually break through the last lower high right
here creating your Market shift which signify to us that this downtrend or whether this retracement is going to end and price going to continue to go up right now or the second option is that price is potentially going to create more lower highs and lower lows until price eventually get down to this 4-Hour swing low so those are the two options and in this case we got the first option where price actually mitigate this demand Zone and then then come up here break through the last lower high right here right there was a lot of
Demand right here a lot of buyers a lot of buying momentum and pressure breaking to the last high right here now giving us our Market shift so the moment this happens we know for a fact that you know what this entire retracement is about to end and that is when we are looking for our opportunity we are looking for our opportunity to enter for the trade and ually you can easily enter for a buy somewhere around here by all means go ahead but what I want to do is to get the best of best entry
the best the tightest stop- loss right so I can minimize my risk and maximize my reward my profit potential so in that case I will go down to the lower time frame right like this could come in the form of either the 5 minute time frame or the 1 minute time frame and if you look at this after price break through the last high right creating this bullish move it pretty much confirmed to us that right now the lower time frame Trend the 15 minute order flow which is which used to be bearish now it
has done bullish and now 15 minute is bullish higher time frame trend is also bullish and now we get this like alignment of the lower time frame structure and the higher time frame structure giving us additional Confluence that price is about to take off and it's going to go up right now so in that case I'm going to be waiting for this swing move right here to actually start pulling back because like I said after price created this Market shift it will pull back it has to pull back to create that higher low before price
goes up even further so where is it going to pull back once again premium and discount right pull back that premium discount right here and price going to come and pull back to somewhere within this discounted Zone and ideally there is probably an order block that created this Market shift right here right and that is when I will wait for price to pull back to that order block right there and that is where I will look for my entry so once again I go down to the 5 minute time frame you can see this is
the once again another small little pullback right here before price mitigate this other block right here break through the last lower high once again the small the smallest bearish out of flow to facilitate that market shift and then right now switch bullish right here right pretty much switch bullish right here and that is where I potentially enter somewhere around here and take profit all the way up at this swing high on the 4our time frame and place my stop loss below this last higher low and this is how you catch those like insane risk to
drop ratio trade setups right because now the 5 minute time frame the lower time frame is bullish the 15-minute time frame is bullish the 4our time frame is bullish all the time frames are aligned towards the same order flow which is all bullish which pretty much give us the confirmation that we need to enter for a buy position so that is essentially how you can trade this Ty of continuation right once you get all the time frames all aligned to bullish right that is when you can enter for a buy and you can start seeing
price will go up here tap into this Supply starts retracing goes up again creating a higher highs higher lows tap into this Supply again and then starts creating higher highs and higher lows and eventually it's going to come up here and break past this next 4our high to create what your higher high on the 4H hour time frame and eventually it will start pulling back again after price break the last high and this whole cycle will repeat over and over again this this is how the market move remember the markets are fractal now let's apply
this Market structure strategy onto the chart itself so right now we are on the higher time frame we on the 4H hour time frame and we see that price is in an uptrend right clear as day uptrend price is creating your higher highs higher lows higher highs and higher lows and just to make things even more clear what you can do is to mark up the highs and this is your bullish break off structure where price broke to the last higher low I mean the last higher high and then create a new higher high and
then same thing right here you break of structure right here and right now this is the last high before price starts pulling back massively to create your new higher low so right now price has just broken past the last High creating your breakout structure and right now we are able to identify our 4our swing low right if you look at this clear as day this will be your 4our swing low so we can put this as our four hour low right our 4our swing low now where is our 4our swing High we don't know yet
because price haven't start pulling back once price starts pulling back and that could confirm to us that this would be the 4H hour swing high so we still wait and see and you can see price starts going up even further go up even further and eventually starts pulling back you can see the minute price starts pulling back we could confirm to us that this is our four hour swing high right here right remember this is when the opportunity starts to arise right chances are like I said if price is all the way up here we
don't want to be entering for a buy we want to wait for the pullback to happen right and that is what price is giving us right now so the fall overall order flow is a uptrend it's bullish and we want to end up for a buy and right now price has started retracing how do we know that we go down to the smaller time frame right we go down to the 1 hour time frame and you can see if you go down to the 1 hour time frame where is the last higher low right this
could be the last higher low you can see price starts creating higher highs higher lows and it starts creating another higher high before price actually start creating this higher low and somewhere right around here there was the market shift right because price failed to create another higher high so over here clear as day this is what I will consider as our Market shift right here so the minute price actually created this Market shift right here pretty much confirmed to us that price has turned bearish in order to facilitate this pullback on the 4-Hour time frame
right so right here yes you can enter for some sell position here and there and take advantage of this pull black until price eventually reach to somewhere like a discounted a well right so yes you can look for your self position right here but I wouldn't necessarily do that I mean it's up to you honestly but we can start seeing price starts pulling back let's go down to the higher time frame actually yeah we can see price starts pulling back massive pullback and in this a like I said we want to wait for price to
actually pull back to a discounted a so what you can do is to draw your premium and discount right here and you can see once you draw a premium discount price is going to retrace to the discounted price which is below this 50% level right here and then I would expect price to actually retrace to either this order block right here or this extreme order block right here right these are the two strong demand zones that I could potentially look out for right my strong demand zones I could potentially look out for to see when
price going to react to it and you can see price right now just created this strong reaction at this order block right here and it's also within this discounted zone so we could potentially look for our entry somewhere around here uh where price is actually switched to bullish order flow right the lower time frame remember the lower time frame structure has to switch to bullish as well before we actually enter for the trade going on the 15 minute time frame you see that price has mitigated this demand Zone that we have right here and right
now price is in the discounted price so chances are there could be a lot of bias within this area right here pushing the price up now where is the last lower high within this overall retracement right here this overall retracement you can start to see price starts pulling back rating lower high low lower low lower high and this will be the last lower high right here so when price break to the last lower high what does this give us this give us your Market shift right so price has the market shift and right now we
could potentially be waiting for price to pull back somewhere around here create this new higher low somewhere right around here before taking off and that is where you can potentially look for your trade setup right so we are still waiting very patiently right and you can start to see price starts pulling back right so once price starts pulling back to create this higher low this could potentially be a point of interest for us to actually enter the trade right let's see how price react to this right can see price starts going down even further okay
it tap into this demand Zone once again so let's see whether this demand Zone will hold okay okay you can see as you can see like I said just now right there's no 100% chance that price will retest to this demand zone right here like I said it could even go down even further to all the way down here before price actually reacted and actually starts reversing and hit back up right we never ever know which zone it is so we are still playing Byer you can start to see okay price seems to be respecting
this one right here and you can see bullish order flow start to take place price created your Market shift somewhere around here where price actually break through the last lower high right here and that is when price actually starts pulling back right price pull back activate this higher low and this is when we can potentially look for our entry somewhere right around here right somewhere right around here this could be our entry and maybe you could enter like somewhere around here when price actually mitigated this trading this higher low right here and right now the
15 minute time frame is bullish right I personally like to enter the trade on the 15minute time frame right for some of you who want to enter on the 5 minute time frame by all means go ahead but I like to end on a 15minute time frame because I'm more of a intraday and swing Trader and then this is when you can place your take profit all the way up at this 4our swing high right here right and you can see right here and I'll say the best entry would have been somewhere right around here
and let's see whether price actually reacts to this right reacts to this Zone and starts going up okay price is looking good so far and you can see once price starts doing this right you can see Market shift happened and this bearish order flow this pullback right here has pretty much ended right and this is when we know that price is back to bullish the 15minute time frame is bullish the 1 hour time frame is is bullish and right now it's aligned with the overall trend this overall uptrend and that is where we got this
like very very nice entry right there and you can see price starts spiking up goes up even further and further and yeah eventually it's going to go up there and smash our take profit as simple as that right this is a very simple strategy like I said if you understand how Market structur how it really all works then that's all you need in order to trade profitably and if you actually look closer at this 4our order block that we have right here or rather this demand Zone price actually created a liquidity sweep somewhere right around
here right where price actually broke past the low right here sweep the liquidity before creating your equal lows right here and just hit all the way up now that is liquidity Concepts which is a little bit more advanced stuff which I'm talking about in another video so just a some of this entire strategy we are looking at this multi-time Frame structure right we are not just focusing on just one time frame we are looking at this old overall different time frames using our top down analysis approach and we are waiting for all types of time
frame the structure to align to either bullish or bearish and remember whatever happens on the higher time frame must happen on the lower time frame first you need to understand what is a range or consolidation ranging markets occurs when price is not trending and actively creating higher highs and higher lows or lower highs and lower lows it's just going sideways just like this in a ranging market price is essentially just moving sideways oscillating from premium to Discount and actively trying to seek fair value at the equilibrium when price is within the premium Zone the asset
is too expensive so as a result there will be Supply driving price down when price is within the discount Zone the asset is too cheap which means there'll be demand driving price up eventually the market will break out of this consolidation either to the upside or the downside what you need to understand is that it requires a lot of money in order for price to break out of this range broky retail Traders like us are not able to move the markets no matter how hard we try even if you are trading with like a few
million dollars now the question becomes who is actually capable of moving the markets and cost price to break out of this range obviously the big boys the banks the financial institutions the hedge funds therefore when price breaks out of a range just like this this indicates that smart money have entered into the market and is causing a significant imbalance between supply and demand so when price breaks out of the consolidation it usually comes back and retest it to fill up the remaining orders before continuing this is based on the concept of orderflow which is split
into four stages range initiation mitigation and continuation therefore a supply zone is being created after price aggressively moved out of the consolidation to the downside so your job is to wait for price to come back and mitigate this Supply Zone to fill up the remaining sell orders and this is when you enter for a sell in order to trade the continuation in price on the other hand demand zone is being created after price aggressively moov out of the consolidation to the upside so your job once again is to wait for price to come back down
here to mitigate the remaining buy orders and trade the continuation that is when you enter for a buy now that you have understood the basics what are supply and demand zones and how are they created let's talk about how to draw them on the charts itself now before we go on the charts I just want to give you a very quick tip on how to actually spot these supply and demand zones and that is to look for inbalance in price remember what we are doing is that we want to see price breaking out of the
consolidation we want to see price move from balance to imbalance which indicates that smart money has entered into the market this means that when you are trying to spot supply and demand zones you just need to identify one of these four scenarios you can see on on the screen right here when you are trying to spot your supply Zone you just need to see price aggressively moving down and then it stops a little bit consolidate here a little bit before going down even further and you can see price broke out of the consolidation to the
downside so this is pretty much your supply zone now you must understand the rationale behind this why does price actually stop it's like a car right a car cannot run forever when it's on its way to its destination price will never just aggressively move down or up for Forever at some point of time it will stop and consolidate just like this so that more sellers or buyers can jump into the market and push price down even further now another type of Supply zone is being created when there is a reversal in price you can see
price move up consolidate and then breaks out of the consolidation once again to the downside right causing a reversal in price which tell us that this is our supply zone right the opposite is true for your demand zones price push up pass a bit consolidate before going up even further demand Zone and then price move down consolidate before going up demand zone right so I just want to keep things very simple as I've always done on this YouTube channel right don't try to over complicate things just look for one of these four scenarios when you
are trying to identify your supply and demand Zone because at the end of the day the market can actually move in three ways up down sideways it cannot do like triangle or back flips all right now when it comes to drawing your supply and demand zones there are two main ways to actually do it the first way is the range method which basically states that you need to mark up the entire consolidation that price has just broken out of so in this case right here you can see price is consolidating and a price break to
the downside so we know that somewhere around here that is your supply zone now we basically find a consolidation which is this entire mess right here and you draw a box from the highest point to the lowest point of the consolidation and you simply drag it out just like this right just Mark out this entire consolidation just like that in this case this is our supply zone so right now we know that price has just broken out of this Supply Zone this means that there is some remaining sell orders yet to be filled within this
entire Supply zone so we can expect price to actually come back up to mitigate this Supply Zone over the next week or so before going down even further and this is when we can look for a sell position just to show you more examples on the Range method you can see right here price is consolidating and then it breaks to the upside which means that is your demand zone right here so we will drag it from the bottom of this entire consolidation to the highest point of this entire consolidation and we'll mark up our demand
zone right there right once again you want to ensure that you already include the low and the high of the entire consolidation so in this case this is the high of the entire consolidation so I just mcky up just like this so you can see this is the demands Zone and look at what price did right price broke out of the demand Zone to the upside and then later on it came down here and mitigate this demand Zone before going up even further once again to activate or whether to fill up the remaining buy orders
before going up and then you can basically see more Supply zones right here you can see Mark up this entire consolidation right here this is your supply zone right there right price broke out to the downside and then look at what price did price came back up mitigate the remaining sell allers before before going down even further so this is your supply Zone and then there is also another Supply zone right here right which cause price to actually go down to the downside okay so you have learned the first method to draw your supply and
demand zones and that is your range method the second method is what I call the pivot method now the pivot method requires you to actually refine your supply and demand zones to a single candle before the breakout itself now hear me out if we want to actually utilize a range method let's say we are waiting for price to come back up here to mitigate this Supply Zone and we enter for a sell right here you can see it's a very large range right you have to place your stop loss above the supply Zone very large
range to play with so in this case we want to actually refine the supply zone so that we can have much better entries by using the pivot method and the pivot method basically requires you to refine this entire Zone to just a single candle so in this case it'll be this candle right here now hear me out if we were to actually utilize the range method what this means is that we are waiting for price to come back up to this range and then we will enter for a sell maybe somewhere right around here but
here's the thing if you actually enter for a sell right here your stop loss will be above the supply Zone and as a result you will have such a wide stop loss because you have a very bad entry so in order for us to get better entries right to minimize our risk we need to refine our supply and demand zones and that is when the second method the pivot method comes in the pivot method allows us to actually refine our supply Zone further right instead of taking this entire consolidation we look for the pivot candle
that causes price to actually reverse or break out of this entire range which will be this candle right here you can see after this candle is formed Supply steep into the market and cause price to move down aggressively to the downside now that we have refined our supply Zone you can see our entries is much better right as a result this give us a high risk reward when we are trading so let's just quickly refine this supply and demand zones that we have drawn on the charts you can see I'll just utilize this entire box
and minimize it to just this Beaver candle itself or even this one right here and this is pretty much your entire Supply Zone you can see price St into the supply Zone and then move down even further same thing to this Supply Zone it can be just refined to this candle right here that led to this huge amount of Supply stepping to the market itself right some people like to call this aut block but at the end of the day it's pretty much quite similar now over here what we have was this demand Zone once
again how do you refine this you can just refine it to the pavot candle that led to the breakout itself so this pretty much becomes the refined pavot Zone and then I can also spot another demand zones right here you can see what happens that price goes up start to consolidate here a little bit before demand one step into the market and push price up right so as a result we can draw another demand zone right here at this pivot candle and you can see there is more demand Zone here as well right price goes
up consolidate go sideways a little bit before demand step into the market and push price up so there we have our another demand zone right there and we can refine it to either this pivot candle or use the first method which requires you to take the entire range just like this so yeah those are the two methods to actually draw your supply and demand zones the range meth and the pivot method and if you want to use the pivot method there is a caveat to this the more refined your zones are the greater your risk
to reward but that also means there is a greater chance of you missing your trade entry so for example we have a refined pivot zone right here but what happened is that price did not actually come down and tap into this pivot zone right you can see price just came down here and I just mve up and in this case you would have missed your trade entry because price has not mitigated your demand zone right so that is just something that you need to take note of compared to if you were to just Mar up
this entire range in the first place you would have been tapped into the trade itself so my advice would be choose what works for you whether the range method or the pivot method and then stick to it consistently don't use the range method sometimes and the pivot method sometimes once you have choose one that works for you stick to it we only want to trade high probability supply and demand zones because supply and demand zones they are everywhere because there's like a constant battle between the Boo and bears every single day if not price would
just be oscillating at fair value and just not going anywhere just going sideways however if you follow the structure that I just taught you you will be able to identify and spot supply and demand zones everywhere but that does not mean that you should trade every single one of those zones because we only want to trade high probability supply and demand zones that are actually backed by financial institutions and smart money itself so in order for a supply and demand Zone to be considered as high probability it has to meet the following requirements firstly it
must lead to a breakoff structure right we know that price will not just move up or down in the straight line price move up pull back before going up even further and when it break the last high in this case it give us a break of structure which tell us that this demand Zone led to this break of structure making a higher probability Zone same thing right here in this case price does not move down straight it moved down pull back a little bit before more sellers come into the market more Supply come to the
market and push price down even further creating your break of structure making this a very solid Supply Zone that's the first criteria the second criteria is that the Zone must cause other zones to fail this is what we call Flip zones what happened right here is that when price is going down it pulls back and then it goes down even further creating a bearish break of structure giving us a supply zone right here so what happens next is that price actually wreck from this Supply Zone coming down here and then it went all the way
up here breaking past the last High the last Strong high right which tell us that price is officially shifted from bearish to bullish and guess what created this a demand Zone right here this demand Zone led to price breaking past the last high so this Zone caused this Supply Zone to fail and this is what we call a flip zone right I've already done like a full video on flip zones which you can find on my channel right but that's basically a very quick crash cost on flip zones flip zones are being created after there
is a f reaction just like this once again if this Supply Zone were to do it job price will go down even further but it failed to do it job creating the fil reaction just like this causing Supply to flip to Demand right and that tell us that this demand zone is a higher property Zone because it costs Supply to flip to demand now these are the additional confirmations that will actually increase the probability of a Zone working your Market structure your multi- time frame Concepts your premium and discount your mitigation whether the zone is
fresh or is it mitigated already and also liquidity and orderflow once again of already done like a full cost on liquidity order flow multi-time frame and Market structure all this stuff which is on my YouTube channel and you can find them all for free now you must understand that the more confluences that we have the more confirmation that we have right here the more boxes this particular supply and demand Zone checks off the higher the probability of the Zone working which means the higher the chance of price actually respecting that zone itself now that you
have understood the basics of supply and demand it is time for me to show you everything about my proven trading strategy I'm going to leave no Stones unturned whatsoever just going to give you guys the secret source for free all right so what happens right here is that first things first you have to identify the market direction right so we have price moving up pull back and then goes up even further right so this tell us that price is in the uptrend right we got a bullish break of structure to the upside right here all
right so this is your break of structure right there so I Mark that up as well so after break of structure what are we expecting price to do we're expecting price to pull back and where is Price going to pull back to most likely to a demand zone so that more buyers can step into the market and push price up even further so in this case let's mark up our demand zones right so we know that okay that is a demand zone right here because price goes up started consolidating before going up even further so
if want to use the range method you can mark up the entire consolidation from the high to the low of the entire consolidation just like this and then just drag it up like that and then I'll drag it all the way to the left hand side so this is the range method but I personally prefer to use the pivot method so that I can get a much more refined entry so in that case I'll most likely put like refine it to like just this pivot candle right here okay cool so right now we got this
demand Zone that led to this break of structure right so this is considered as a highper The Zone and if you look towards the left hand side what do we have right here we got a lot of Supply right here you can see lot of supply and if we drag this to the left hand side what do we have right here this Supply Zone caus this demand Zone to flip right we got a fil reaction right here because if this Supply Zone were to do is jot price will react to this Supply Zone and then
fill up the remaining sell orders and cost price to go down even further but it failed to do that price created a f reaction right here giving us a demand Zone that caused this Supply Zone to fail right so this pretty much check off the two criteria that we just mentioned it led to a break of structure and it also Al cause your supply Zone to fail right so right now our job is to just wait for price to come back to this demand zone right because right now we are expecting price to pull back
to this area right here and then that is when we can enter for a buy position right so in this case you just do nothing until price eventually come back into this demand Zone ladies and gents this is your entry signal this is where I will actually enter for a buy right here as you can see it didn't just mitigate this demand Zone it also swept the available liquidity that we have have below this lows right here once again if you don't understand liquidity you can just go and watch the liquidity Concepts cost yeah but
this give us an additional Confluence that tell us that price is most likely going to respect this demand Zone because it has also swept the liquidity over here which tell us that price is potentially going to move up right now smart money is going to come in and push price up and in this case I'll place my stop loss below this Candlestick week right here and then for my take profit I'll just place my take profit right here at this Supply Zone that we have right here you can see there's a huge amount of Supply
that step to the market and cause price to come all the way down there right so you can see this is a good one to 3.5 reach reward and let's just see how price plays out you can see ends up hitting a take profit as simple as that and then we'll move on to the next trade right so now I will just delete this one right here because this Zone has been used and I can mark up my fresh demand zone right here and you can see this is my pav demand Zone because what happened
is that a lot of demand step into the market at this mon of time and we can track the source of it right the source is basically this pivot candle right here that CA price to create this vshape reaction right which tell us that demand Ste into the market smart money entered for a large amount of buy orders so we know that there is going to be remaining buy orders yet to be filled within this area right here so we can expect that price could potentially come down here tap into this demand Zone before going
up even further so I actually want to enter for a buy here again right once price actually come back down to my demand Zone and I'll place my stop loss once again below this demand zone right here and perhaps Target like the next area right here but you can see it's still quite far away from where price is at right now so what we can potentially do is to look for short positions at this Supply zone right here you can see price is just blow right past this Supply Zone but look at this long week
that price actually created you could potentially draw more like pav Supply zone right here if you go down to the 15-minute time frame you can see right here this entire thing is actually our paver Supply zone right because at this point of time lots of supplies step into the market and cause price to come crashing down so we just marked that up as our supply Zone and this is when you can look for your sell opportunity as well if I were to actually enter for a sell like somewhere right around here guess what I will
place my take profit at this demand zone right here and you can see in the end probably just comes crashing down a little bit slowly but consolidate a little bit but surely you can see right there yeah man you can see eventually price come down there and smash out take profit that was another very easy sell position basically you sell at supplyer and you buy at demand and obviously you need to look for additional Confluence like your liquidity and also your Market structure so on and so forth but this is just a very simple trading
strategy that you can try out cool now that we have gotten out of the sell position and we are TA into our buy position right here remember we ENT up for a buy at this demand zone right here we are TA into it place our stop loss below this take profit and now where should take profit be at at this opposing Supply Zone that we have right here right this entire range once again you can mark this entire range up just like this or you can just refine it to the pavot candle which would be
this one right here right so I just mark it up just like this right so this will be a very fast trade setup if I'm not wrong right there you can see as simple as that boom boom boom we just won three trades in a row right so yeah this is a very simple trading strategy you just try to sell at Supply buy at demand so after we close this trade next we are looking for our next trading opportunity so what can do is to just clear up all the charts right clear all these supply
and demand zones that has already been used have already been mitigated whatsoever and mark up your fresh zones so you can see right here price push up pull back around here starts consolidating before demand step into the market and push price up right so this entire thing would be your demand Zone and then right now we had our supply zone right here but you can see it has been mitigated which means price is most likely just going to blow right past it which you can see right here just completely disregarded whatsoever because once again price
has already mitigate the remaining sell orders right here so now let's just look at what price does right price start consolidating okay right there you can see Sharp move to the downside right price was consolidating Supply step to the market and push price down so we can mark this entire Supply Range up once again right so this will be your supply zone right this is the range method and then the pivot method would be you refining it to this pivot candle right here okay cool so so remember our demand Zone that we have marked up
right here you could potentially look for long positions right here right place your stop loss below this lows I mean below this demand Zone and place your take profit at this little Zone that we have right here now before I miss it out right you can see there's actually another demand zone right here right here price goes up pulls back and then goes up even further demand step to the market and push price up right so this is also another demand zone so let's just Mark that up as our next demand Zone once again how
do we know which zone is is price going to respect is price going to respect this one or this one the truth is I don't know right I don't have a crystal barall that tell me exactly which zone price is going to go I'm not a fortune tell or a mind reader all right I don't have telepathy or some right so you just have to understand that you need to react to what the market does if the market wants to go up at this area then enter at this Zone if the market wants to go
up at this Zone then enter at this zone right react to the market be flexible be like water my friend so in this case let's continue to observe what price does right I can see price consolidate here a little bit and then it seems like this demand zone is actually getting respected right because if price wanted to come down to this extreme demand Zone it'll just break right past it and comes down here into the demand Zone and then goes up in this case it seems like this demand zone is being respected so yep you
can enter for a buy here if you want yep you can see eventually price goes up and potentially hit this Supply Zone boom there we have it you can see very easy sellup we could have easily entered for a buy right here but for me I'm just going to wait to actually enter for a sell at this Supply zone right so I'll just place a sell order right here right actually I have been already tapped in right here but let's say I did not got TA in the first time round right so I'm looking for
my next entry the second time round right here so I can see there a new Supply Zone being form right here right so in this case you can either enter at this extreme Supply Zone which I would advise you to do so or you can actually enter at this near Zone but the thing about this extreme zone is that it has been mitigated right here which means the sell orders that has already been filled right the remaining sell orders right here but this does not mean that price will not come up here again price could
potentially come up here again and then go down even further because they could potentially still be like what one quarter of sell orders left within this Supply zone right so we always React to what the market does right so let's see you can see price Ste into this extreme Supply Zone Supply St into the market easily enter for a sell position right here place your stop loss above the supply Zone and this time around you can Target this near demand Zone that we have right here so it'll be this demand zone right here you can
see because this is the pivot candle that led to demand stepping into the market and causing price to move up right so yeah once again this would be a very very easy trade setup you can see price in the end come down here tap into our demand Zone and we got out of the trade right so very simple always place your stop loss above a supply zone or below a demand Zone if you're entering for a buy position and then place your take profit at the opposing zone so if if you're entering for a sell
at a supply Zone place your take profit at the next demand Zone and if you're entering for a buy at a demand Zone place your take profit at the nearest Supply Zone as simple as that and you can see price actually end up coming down to our extreme demand zone right here before price could potentially completely bypass it right so you can see this was a very good short position right there and this is why it is so important for you guys to not just understand supply and demand but also understand Market structure because when
you understand Market structure you will know exactly why the supply and demand Zone actually fill it's because at this point of time supply has took control of the market the sellers are winning so it's very important for you to really combine Market structure and supply and demand this is what you will learn what are supply and demand flip zones how to identify and trade these zones how to combine liquidity with flip zones so that they can avoid smart money traps and lastly I'm going to show you a high win rate trading strategy using these flip
zones so what are supply and demand flip zones they are basically point of Interest where a supply Zone transition into a demand zone or vice versa and they basically signal to us a shift in orderflow of the market they tell us price has just go from bearish to bullish or bullish to bearish and it basically just tell us that price is going to reverse and it's caused by changes in the market sentiment and the psychology of the market participants so this supply and demand flip zones basically tell us that price is going to reverse right
now from a downtrend to uptrend or uptrend to a downtrend so there are basically two types of flip zones the first one is your supply to demand flip Zone over here price was potentially you could be making that bearish order flow you know price just going down creating that downtrend creating that low lower high and lower low just breaking through the last low creating your break of structure somewhere right around here and then it just continue going down and go down eventually come down here and then it comes up and over here what we have
was a supply zone right there was this Supply Zone that was formed when price created this lower high right here because this Supply Zone caus price to go all the way down now in this example right here if this Supply Zone were to do his job price is going to go up there right tap into that Supply Zone and continue going going down even further right it's going to continue going down even further and potentially creating that lower high and lower low Dynamic but in this case that was clearly not the case because what price
did is that instead of creating that lower high and lower low Dynamic price actually reacted from this Supply Zone and actually comes down here and creates a higher low so you can see this low is higher than this low right here so this could tell us that price have just shifted from Supply to demand so over here this is where we can draw our demand Zone after price goes up react to this demand Zone and actually break through the last lower high creating our shift of structure and this pretty much just confirmed to us that
you know what price could potentially reverse from a downtrend to a uptrend right now and we can look to enter for a buy so your next step is to wait for price to actually come back down to this flip Zone that was created right here just bear in mind that at this point of time right price is already flip from Supply to demand so this is your supply to demand flip zone so just wait for to come down come back down to this Supply to demand flip Zone end up for a trade and just start
collecting cash now the thing about this flip zone is that it is very important that you actually get that fi reaction right here so what happened right here was that there was a fil reaction like I said if price were to do his job or whether if this Supply Zone were to do its job it's going to continue the bearish other the flow and just continue going down uh creating a lower high and lower low but in this case there was a fail reaction right here where price actually you know instead of going down continuing
going down even further he actually started reversing right here and hit back up so this was the FI reaction being formed and this just tell us that you know what this Supply Zone works but it's not strong enough for this overall trend to continue and then this is when the demand have overpowered the Supply right where the buyers have pretty much just pushed the sellers out right just chased the BS out and right now they're going to come in and take their place next is your demand to supply flip Zone and it's basically the opposite
of your supply to demand flip Zone and in this case you are flipping from demand to supply so what happen is that price could be you know going up creating the higher high and higher low and eventually comes up here pushing up breaking through the last High creating a break of structure before price actually started pulling back and when it pull back guess where is going to pull back to the demand zone right here like this demand zone right here that actually resulted in this push phase right this break of struct so this is a
very strong demand Zone and price is going to come down here and tap into the demand zone now the problem is if price step into that demand Zone you must ask yourself whether this demand Zone will work or not right whether this demand Zone will hold if it's going to hold it's going to continue to go up creating your higher highs and higher lows but if not then guess what that is your F reaction and that is what we see in this scenario right here right it is demand Zone if fa to bring that higher
high right if fail to actually go above this high so what it does was that it actually goes up and come back down so it created a lower high right here right and this could potentially be your shift in order flow that price went from the strong demand to potentially Supply could be stepping into the market and you know let price collapse right so that is essentially what we want to see this field reaction right here so after we see this field reaction we are pretty much waiting for price to confirm to us that this
is going to be a valid reversal and we are only going to get a confirmation where price actually created that market shift where price actually go down here and break through the last higher low giving us a shift of structure confirming to us that price have potentially shifted from a bullish uptrend and right now it's going to turn into a bearish downtrend and we should be looking to sell now where do we sell we sell at the place that actually created the field reaction which is this area right here so this area will be your
demand to supply flip Zone because price has flip from demand to Supply right here and that is when you can look for entry and once again collect cash or credit or whatever you want to collect now let's go on to the charts and learn how to actually identify and trade these flip zones so when you pull up to a blank chart like this the first thing you need to do is to always identify the overall Market structure and also muck up any sort of supply and demand zones if you still do not know how to
mck up supply and demand zones go and watch this video right here but anyways right here first things first we look at the overall trend that direction right we see that price in the uptrend price creating that higher high higher low higher high higher low and right now is pushing and potentially creating another higher high so clear as day price is in a push phase right price is not in a pullback phase price in a push phase and price is in the uptrend now before you think about entering for a buy you need to look
out for your blind spots look out for any sort of opposition zones right what I mean when I say that is that in an uptrend like this you should look out for any sort of Supply zones that that is near this area here because you don't want to enter for a buy at a supply Zone where there's going to be a lot of sellers entering into the market it's all about timing right it's all about entering at a perfect timing so we zoom out a little bit and we can see that clear as day that
is actually a supply Zone somewhere right around here right Supply Zone somewhere right around here this will be your supply Zone and then that is also another Supply Zone all the way up here at this extreme high right here right right and yeah there's basically two Supply zones right here so the reason why I marked up these Supply zones is because this is what you call your ready base drop ready base drop right and it basically tell us that this is the initiation of this push phase right this sellers entering into the market you can
see huge bearish candles stick right here which pretty much tell us that there some sort of smart money or financial institution involvement right here right enter for a bu amount of sell orders Within These two areas here so that is my Supply Zone and I basically draw my Supply Zone by marking up the entire range before the bearish liquidity or the supply enter into the market so it'll be this entire range right here but sometimes what I like to do is to you know refine it toward the candle right before the the bearish liquidity right
before the supply actually happened so in this case I'll refine it to like this this candle right so the reason why I like to do this is because I want to keep my zone nice and tight instead of having like this entire consolidation right here nice and tight just like this and you will most likely do and right now the thing about price is that even though price in an uptrend and by right we should be entering for a buy because we want to trade to Trend right but right now price is actually in a
supply zone right so that's the key thing to not there's a big red flag and when price actually enter into the supply Zone my my next step would be to you know go down to my smaller time frames this is where I look for my entry look for my flip zones and in this case I'll most likely be going down to the 1 hour time frame right once I go down to the 1 hour time frame I'll be marking my structure up once again and I can see that is a break of structure right here
because the last time price actually went up there he actually created another higher highight so you can see this is the high right here and is a higher low and then right now price created another high and right now price is potentially pulling back after Crea this higher high so at this point of time I'm marking up my break of structure I'm also going to Mark out where's my swing high and my swing low so this is my swing high right here and then there's a swing low right here right so there's swing low right
here because this is where price actually know pull up retrace and then go up even further so there's a very strong or rather not strong but like rather a weak swing low right here at this point of time we are looking for our flip zones right in order for this to confirm to us that you know you know price is going to go down right now because this Supply zone is going to do its job right this higher time frame Supply zone is going to do its job sellers are going to enter into the market
here's what you need to see you need to see price actually you know react to this demand zone right here and it fails right it has to create that fi reaction and then after it create that fi reaction it has to break structural which is breaking below this low creating your Market ship that confirm to us and tell us that price is going to reverse for uptrend to a downtrend and only then you can look to enter for a sell position so in this case what do we have right here what we have right here
was that there was a demand zone right here right obviously there's going to be a demand zone right there because this is your your pivot Zone where price actually you know goes up come down pivot and then goes up right this where demand step into the market and this candle actually initiate that demand so this your demand zone and right now price seems to be creating that Fai reaction so what happened right here is that price comes down into the demand Zone and it reacted from the demand Zone remember the reaction is very important you
need to see that reaction because it confirmed to us that this demand zone is working but whether it does it job it's another question and this scenario right here if this demand Zone were to do his job what price is going to do is that it's going to continue going up even higher creating that higher high and higher low and just continue going to the moon but in this case it did not have enough momentum to do that it did not not have enough fuel so what happened is that after price actually reacted from the
demand Zone sellers steep back into the market and push the price down traing your Market shift and it actually broke through the last low right here when it does that we have an officially a market shift right here right a shift of structure and right now this could be like the first sign that tell us that the order flow is about to shift from bullish to bearish so this is where Supply actually stepped into the market after it created a fi reaction from this demand zone so this is your supply zone right and this is
also known as your flip zone right because once again this is where demand has flipped to supply and created that fi reaction right so ideally I would mark up like the candle right before the supply step into the market like this but what I can also do is to mark up like the entire range this entire range also constitute as a flip zone right but for me I like to refine it to tojust this candle right here right but obviously if you refine it to to like this as well it's also quite valid so this
entire area will be a flip zone so in that case I'm pretty much waiting for price to actually tap into that flip Zone and that is when I can potentially look for my entry somewhere within this flip zone so let's just drag that out right there potentially I could be placing like some sort of sell order at this flip Zone and U my stop loss will be above this flip Zone somewhere right around there and then my take profit will go potentially be where the next the theand zone right where's the next swing low and
this could potentially be the next swing low right there so this would be like a very easy trade setup right there and you can see let's let's just observe what price does right because obviously I feel like this is this stop loss is way too big right and if price actually like you know goes up there tap into the flip Zone and just mitigate it then obviously my stop loss wouldn't be so white it doesn't make sense for my stop loss to be that wide in that case my stop loss will probably be just right
above this area right here and my risk to drop should be much more higher so in this case just observe what price does okay you can see price steps into that flip Zone that's a good thing guys price steps into the flip Zone and usually sometimes just for you to take note price can either go into the 50% which means like the half way through inside this flip Zone and then go or sometimes you can even touch the flip Zone and just go there's never like a rule that says that okay you should enter immediately
after price step into the flip zone or tap into the 50% of the episode it's all depends on you right so test it out and see what which one works for you and I stick to using that one so in this case price has enter into like the 50% of the flip Zone and that is when I could potentially have entered for the trade setup manually I always prefer to enter my trades manually after getting some sort of confirmation so I enter like some like 50% right here you can see bearish liquidity started entering into
the market supply have officially step into the market and this flip zone is going to do its job right so somewhere right around here this 50% I've already entered into the trade my stop loss will be probably just right above this flip Zone and this would potentially be a one the three RIS to ro raal I can just observe our price does boom smash your take profit as simple as that God off the trade Happy Days Go and celebrate with champag or something now after we got out of this trade observe what price is doing
right now price has came back down here to this swing low right and this swing low is usually like a point for smart money to actually grab more liquidity to continue this down move so most likely it's going to reverse at this area right here creating that another lower high and then go down even further right it's is literally that AA for smart money to grab more liquidity so at this area right here that is also your demand zone right here so once again that is your demand zone right there and in this area we
want to see whether price actually respect this demand zone or not and in that case I'm waiting to see whether there is a fi reaction right here or Price actually react to this demand Zone and just continue going back up right so let's look at what price does and you can see price comes down comes down boom there you have it your field reaction once again price actually reacted to the demand zone right a Val valid reaction but like I said it was not enough to continue going up right it did not have enough momentum
did not have enough buyers to continue pushing the price up so over here this is what I C the FI reaction right fi reaction happened right here so you can pretty much draw your flip Zone within this range right here so this entire range would be your flip zone right right flip zone right there and then price also created the market shift right here already where price actually pierced past the last low you can see price is going to go down and right now we could potentially look to enter for a sell position once again
when price actually you know enter back into the flip Zone I can see price step into the flip zone right there price step into the 50% of play flip Zone once again pretty much like quite similar to this we are inside the trade and price just collapse right price just collapse and go down and yeah Happy Days this is essentially how you trade the flip zones in a bearish downtrend so this is a pretty good example of demand to supply flip Zone where supply has pretty much overpowered demand and causing the entire order flow to
shift from bearish to bullish now what does it look like in a uptrend what does a supply to demand F Zone actually looks like and that is what we're going to explore right now so over here once again price is coming down here crashing down and I can see price is approaching this demand Zone that we have earlier the reason why I draw this demand zone is because this is actually your drop base ready right so this consolidation this consolidation right here is happened right before the demand steep into the market and pushed the price
up right so this is pretty much a valid demand zone so at this point of time price is approaching this demand Zone and we don't really want to do anything right it's too late for you to end up or sell already even though price in a downtrend because price is approaching a demand Zone where some money is potentially going to enter buy orders in bulk and and potentially push the price up and look at what price does price step into the demand Zone and boom you can see small money enter into the market and create
a vshape reaction right where price created this vshape reaction this is more slightly involvement of the big financial institutions right and usually usually happen after a liquidity Swip so there was available liquidity below these lows right here so there was a liquidity Swip right there right SE the liquidity right there and at this point of time like I said I want to mark up my market structure my swing lows and my swing highs so this is the last swing high right here this the last lower high so at this point of time there is also
a supply zone right here right there's a supply zone right here that actually resulted or rather caus price to move down to this demand zone so at this point of time we want to see whether this Supply Zone does its job or not right so we tap into that Supply Zone and like I said if this Supply Zone were to do it job it's going to continue creating that lower high and lower low and lower high and lower low then at that point of time there's no point of us thinking that price is going to
reverse right so we'll see you can see price is mitigating this Supply Zone starting to head back down starting H back down but look at what happened right instead of creating that lower low what price actually did is that it created that higher low and you can see this low right here is higher than this low so this pretty much confirmed to us that this is your flip zone right this is where supply has officially flipped to your Demand right so this is your supply to demand flip Zone and for this to be a valid
flip Zone like I said we want to see that market shift we want to see price actually Pierce past this last lower high confirming to us that there is a shift of structure confirming to us that this bearish autoflow is about to end and right now price is going to go to the moon and that is what we want to see you can see okay Market shift happened right here and right now I could potentially handle for my buy position and price actually Taps into the demand Zone and potentially you know have my take profit
somewhere right up here at this Supply zone right at this next Supply zone right here right a very quick scop or whatsoever not really quick actually but you can see price St into that that flip zone right here once again boom tap into it actually you already tap into it right here right you already tap into the flip zone right here it Taps into it you can see when it Taps into that flip Zone a lot of liquidity actually enter into the market where which can be seen by these huge imbalances you can see small
money enter into the market boom this is where the demand has overpowered the supply and right now we are just about to go to the moon and you can see probably just about to you know just just about to do his thing and just go up there right and yeah potentially go up to this Supply Zone that we have right here and just steps into it and boom we got our take profit here and Life Goes On Right very very simple and the thing about this strategy is that it seems quite simple but the hard
part is waiting waiting for the high property trade setup waiting for that market shift to occur waiting for price to get back to the flip Zone after the market shift occur that is the difficult part it's all about patience patience is the name of the game now I'll be very honest with you even though this is a high win rate trading strategy the truth is no strategy works 100% of the time right this strategy will not work all the time sometimes price will just not respect the flip Zone you will not respect to the flip
Zone you will go to the extreme Zone and then go or it might not even touch the flip Zone and then go right so it really comes down to you asking yourself this question here when indul just ask yourself has the flip Zone swept liquidity right because the market mve based on liquidity if smart money want to enter for a buy position they need a large amount of sell orders and they can only get that from you guys from your stop loss from the liquidity inside the market so ask yourself this question has the flip
Zone s liquidity if yes enter on the flip Zone if no wait for a liquidity Swip to happen first and Ender on either the extreme supply and demand zone or the next supply and demand Zone after getting extra confirmation this is what I mean so over here this is a pretty similar example so I'm not going to go through the entire thing again but what happened right here is that price was in a bearish downtrend bearish order flow and price has just came back down to this strong demand Zone that we have right here so
we have our supply zone right here and you can see price created that that flip Zone after price rected at this demand zone right it just reacted at this demand Zone come up to this Supply Zone and then instead of continue going down it actually created that higher low right so this low higher than this low right here and this is your flip zone so at this point of time I can just mark up my flip zone right here right this entire thing a flip zone so look at what price does price goes up price
okay price come to the flip Zone potentially you enter for a buy here immediately after price come into the flip Zone and place your stop loss below this flip Zone and Bam you just lost your trade you just lost your trade because you don't really know what you are doing like you are just thinking of trading in terms of like a very surface level knowledge you don't really have a deep understanding of liquidity and the market in general so what happened right here is that what you did wrong was that you did not wait for
liquidity like I said just now this flip Zone strategy is not going to work all the time you're not going to get that perfect flip Zone reaction every single time the market is random these patterns are random so what you can potentially do is to react to what the market is doing so in this example right here like you like I said you are asking yourself as price enters into the flip Zone whether price has already swept liquidity whether this flip Zone has already swept any sort of liquidity and if you look towards the left
where is all the liquidity points it's right here right you can see as Price p pivot right here there's going to be available liquidity below this lows right here because maybe buyers are entering right here they're going to be placing the stop loss below this lows right here below this higher low so there's going to be a ton of liquidity being built up above below this lows right here and in addition to that where else is the liquidity there's a trend line right here right retail traders that they to place that trend line when they
place a trend line right there guess what they're going to be placing the stop losses below the trend line right here when they enter for a buy after price bounce of the trend line after price bounce of the trend line and in that case all the stop loss below this trend line right here all of these are available liquidity so there's liquidity below all this trend line right here lots of liquidity there's also liquidity below this low right here so in this example right here price has not SW the liquidity whatsoever so what we could
potentially do is to wait for the liquidity ship to happen wait for price to ship all this available liquidity and then we enter for trade so once again if you look at the guy that I have right here so if it has not swept liquidity right you want to enter either on the extreme Supply on demand zone or the next Supply on demand zone so in this scenario right here this will be the extreme zone right this will be like the most extreme demand Zone that we have right here right and right now we could
potentially expect price to Swip the liquidity first below all these loans right there and when it does that it's going to tap into the demand zone right this extreme demand Zone and only then that is when you can potentially look for your buy setup somewhere right within this demand zone right and if you look for that you can see price just Skyrocket right huge amount of money just enter into the market huge demand have just officially stepped into the market after price has s all the available liquidity right here or rather after the smart money
have swept all the liquidity and what happen if you know you fail to enter at this demand Zone Z right here then that is the next supply and demand Zone that you can actually look to end up for but I can see as price actually started retracing right here right and you can actually draw another demand zone right here and next time price actually tap into the demand Zone you can easily enter for another buy position and just continue this so on and so forth right so that is what I mean when I say that
if the flip Zone has not SW liquidity whatsoever then you want to enter on the extreme Supply or demand zone or the next supply and demand Zone Z after getting the extra confirmation which only comes in a form of you know signs that tell you that smart money have entered into the market once again another example right here so right now price has came back down to this swing low that we have right here and right now once again this is your demand zone right this entire thing is your demand Zone and you can see
price has actually reacted to the demand Zone and created that fit reaction right here where price actually goes up create that lower high and just goes down right so this could potentially be your flip zone right and like I said you want to ask yourself has the flip Zone swept liquidity if yes then potentially you could enter the price step into the flip Zone but in this case there was no liquidity being swept whatsoever right so we could potentially expect price to completely disregarded flip Zone come into like this extreme Supply zone right here and
that is when you can potentially look for your trade setup right but once again always wait and react to what the market is doing and you can see price just goes down and boom completely disregarded in this flip Zone and where is it going to go next this entire Supply Zone that we have right here right this entire Supply Zone that we have this range right here boom that is when you can potentially look for your entry so let's say you actually wanted to enter for a sell position at this flip zone right and you
did not get the entry because price just completely Mis mitigated it or you actually enter into the trade but you place your stop loss Above This flip Zone and now you got stopped out in that case suck it up move on to the next trade right just get rid of this and look for your next opportunity your next opportunity window will be at the extreme Supply or demand zone so this is the extreme Supply zone so we are going to see where the price expect this Supply Zone and if it does I want to get
involved for a sell position and place my stop loss above the supply and potentially take it at the next take profit next demand Zone that we have right here or whatsoever you can see right here that into the supply Zone boom comes down to this demand zone right here before actually heading up and boom smashing our take profit so this is exactly what I mean when I say that you need to be very reactive you need to be very flexible and adapt to what the market is doing and always make sure that you are being
very careful so go out there play with this trading strategy practice back test and see whether it works or not before you try out on your Live account and if you can com combine this flip Zone strategy with Market structur trust me it's going to be insane right let's just say it's going to be crazy this is really the secret Source that's allowed me to follow the smart money Footprints don't worry I'm not going to charge you $997 I'm going to give it to you for completely free so firstly what are order blocks Auto blocks
are basically areas on price chart where large Market participants like Banks and Fin financial institutions place a substantial amount of buy or sell orders that is why they are called order blocks it's literally in the name guys now aut blocks and supply and demand zones they are very similar with just a few differences the first difference is that aut blocks are much more effective than supply and demand zones because after all the point of order blocks is to really show us where smart money has entered into the market and where they are most likely going
to enter again the second difference is different rules are used when identifying valid all blocks now for a Zone to be considered as an all block it needs to meet four criteria which I'm going to show you later now the trick to identifying Auto blocks is to look for Sharp and substantial upward movement or downward movement so in this case you can see we got a sharp and substantial upward movement right here where price is going up very aggressively just like this in that case you just want to look for the candle right before this
sharp and substantial upward movement and then there a mouu so this is the candle right here so in this case you just need to draw a box marking the top the high and the low of this particular candle and this creates your aut block and then in a bearish scenario you should be looking for a sharp and substantial downward movement and once again you look for the last candle which created this sharp downward movement this aggressively down move if that's even a word and you just find the candle right there and that is where you
basically drop the auto block it's it's really not rocket science guys it's just look for that one little candle before a sharp and substantial movement and it'll just draw a box marking the high and the low of the that pivot candle and there you have your little beautiful auto block like I mentioned just now in order for a Zone to be considered as an aut block it needs to meet four criterial right it must meet every single one of these four criterial if it does not meet a single one of them it is not an
order block it could just be like a normal supply and demand zone so the first rule is that the pivot candle must close below or above the previous candle so after identifying a sharp and substantial outward movement just like this we are able to identify that this is actually the pivot candle where we can actually draw the aut block now knowing that this is the pivot candle you need to ensure that this pivot candle close below the previous candle because this indicates that institutional buyers are stepping in absorbing sell orders and preparing to push price
higher so looking at these two examples that we have right here this pivot candle did close below the last candle but this pivot candle did not manag to close below the previous candle since this previous candle went all the way down here right so this P candle actually closed up here so it's not really considered as a valid auto block in this case the second criteria is that the auto block must cause imbalance what that means is that there must be a gap how do you know there's a gap there you basically look at the
high of the pivot candle and then you look at the low of the next next candle in this case right here and you can see this creates like a little Gap that we have right here what this Gap tell us is that at this point of time smart money have entered into the market and it has managed to push price aggressively up so much that it left a gap behind telling us there was a large amount of demand stepping into the market at this point of time and then in this example right here there was
actually no Gap because if you look at the high of this be candle and then you look at the low of the next next candle in this case is pretty much at the exact same price right so since there is no Gap right here this auto block cannot be considered as valid therefore making it an invalid auto block the third criterial is that an auto block must be unmitigated it must be fresh that means price cannot actually tap into it if it tap into it then it has already been mitigated and what this means is
that the orders yet to be filled with within this auto block itself it has already been filled by the smart money you must understand why an auto block is formed at this point of time this is where smart money have entered for a large amount of buy orders right so knowing this this creates an order block this means that at some point of time price is most likely going to come back into this order block right fill up the remaining buy orders yet to be filled before going up even further now in this case since
it has already been mitigated by this particular candle right here what this tell us is that the orders yet to be filled within this order block has been filled by the smart money right so right now price is most likely going to go up there and it's very less likely going to come down and mitigate it however there is still a chance that price could come down here and mitigate it in the future but just less likly since it has already been mitigated the strongest Auto blocks are always those that is fresh new and unmitigated
the fourth criteria is that it must led to a break of structure so in this case this auto block right here it led to this break of structure making this a valid auto block and then this one right here led to this break of structure making this a valid a block and then this one led to this Market shift once again is also a break of structure but it's just like a reversal in the structure and making this still a valid auto block and then this is also going to be a valid auto block because
it did led to a break of structure so those are the four rules of all the blocks right you must ensure that the point of Interest or the Zone must be all four of these CR for it to actually be considered as a real auto block if it does not me a single one of them it is not an auto block it could just be a supply and demand zone or just an ordinary stupid Zone that is not going to work so now let's apply what we have learned and really learn how to differentiate between
valid order blocks and invalid order blocks so this order block right here right we saw that there was a sharp and substantial outward movement cool and then we know that this is the pivot candle that led to this movement and this pivot actually closed below the previous Candlestick low yes it did cool is this unmitigated yes it is right and was there some form of Gap yes there is there's a gap between the high of this candle and the low of the next next candle okay cool there is unmitigated it caus imbalance there is a
gap and it Clos below the previous Candlestick low and it led to a break of structure that's the last criterial it did right it did led to a break of structure in this case this tell us that this is a valid other block so we can expect price to come down here at some point of time mitigate it before going up even further and then let's look at this next zone right here do we have a sharp and substantial upward movement yes we do right but look at this pivot candle this pivot candle did not
close below the previous Candlestick low which is right down here in this case this is an invalid order block and then let's look at this next zone right here in this case sharp and substantial up movement but the thing is there is no Gap all right you can see there is no Gap this is the high of this pivot candle and the low is like all the way down here there's no Gap that is why there is no imbalance whatsoever and this Zone has also been mitigated right which means smart money have already used this
Zone in that case we can just ignore about this zone right here and then the last Zone that we have right here okay sub and substantial hour movement cool is it unmedicated yes it is did it cause imbalance yes there's some form of there's a small little Gap right here the the marker that drawing right here is way too big but yes there's a little bit of Gap right there and then this did close below the last Candlestick low making this and valid a the block so then now that you understood Theory let's go on
to the charts and apply what we have learned so far and really ensure that you get a deep understanding of the auto blocks before you actually go and apply onto your real account with your hard earned money now how do you actually trade Auto blocks where do you enter and where do you exit that's what we're going to cover next right I'm going to show you my entire auto block strategy from top to bottom first thing you must understand is that there are two ways to actually enter for a trade using this auto block strategy
the first way is called a RIS entry method and then the second way is called the confirmation entry method I'm going to show you the pros and cons of each and then based on this you can decide which works best for you and then pick that one right so firstly let's talk about the risk entry method So based on what we have right here let me just identify the all blocks all the blocks um there's perhaps one like right here you can see there's a lot of imbalance right here and then there is a gap
it's unmitigated blah blah blah we know that okay cool there is an auto block right there okay and then this is the pivot candle that caused this sharp and substantial downward movement and since price has already came all the way down here yes that is still a chance that price could potentially move up there mitigate it and then go even further but let's look at what we have right here because we have another aut block right so that is another auto block right there because once again there is your sharp and substantial downward movement okay
that is your Gap and then this also led to a break of structure to the downside that we have right here where price where price I don't know why I just said that where price has just broke past the last swing low right so that is your bearish break of sh to the downside okay so now you can see we got these two Auto blocks right here the question you guys are going to ask me is okay cool Brett which aut block is price going to go I have no idea all right I don't have
a crystal ball I'm not a fortune Talent I have no idea okay so if you using the risk entry method that means you are most likely going to be placing a sell order at the edge of the Zone itself that means when price eventually go up there touches the Zone you'll be tapped into a sell position automatically by your broker and then you are praying for the best right you're praying that you know price will not hit your stop loss and price will just go in your way you praying that this auto block will work
so that's the risk entry method all right basically basing a sell or buy limit order at the Zone itself and then once price step into the Zone your broker get you into the trade the bad thing about this risk entry method is that you don't have extra confirmation right that means sometimes price can just blow right past your aut Block in that case you have lost this trade right here because you didn't actually wait for confirmation okay but we'll talk about that later for now let's say you actually decided to go for a RIS entry
method and rep place your sell order at the edge of this order block right here and you place your stop loss above the order block itself and if a take profit you can place your take profit at the next structure be the next swing low right you always look towards the left so if I look towards the left right here I'll see that based on the structure this is the last swing low that we have right here because this is the last time price actually pull back all the way down here and then goes all
the way up there and break structure right there so this is the last swing low so you can potentially Target that last swing low that we have right there or you can even Target the opposing auto block right the next auto block which could potentially be this area right here this this is the next order block right so all in all this look exactly the same so let's say you decide go for a risk entry right there let's see how this play out okay cool right here you got tap into the trade let's just continue
to see what price does okay you can see Supply stand to the market and Bam you hit take profit congratulations now here comes the brokies oh Brad you could have just Cherry Picked this you know like this is like a perfect Zone you just bar replay anybody can do it in bar replay I agree with you that is why I don't really like to use this risk entry because for every one aut block that actually work there is like five other aut blocks that don't actually work that's just the nature of the irrational and unpredictable
Market before I show you the next method let me just show you more examples on this risk entry method so let's let's look at what happens next okay price just blow right past that and then we are looking for our new aut block okay price has stepped into this actually this new little okay this is not really aut block this is more of like a supply Zone because it did not met all four of these criteria right you know there was no Gap is is it's also been mitigator whatsoever so this is just an ordinary
Supply zone right but I can see price step into this okay came down here okay cool now we can draw our new order block right here right this is the pivot candle that led to this sharp and substantial downward movement that we have right here okay so this is our new order block and let's say we put our risk entry right there once again right we are entering for a sell at the edge of this Zone and then let's just see what price does does it actually go up there nope I don't think it has
went all the way up there okay so let's just look for another auto block okay that's another auto block right there okay and then let's place our risk entry right there okay let's just once again this is what you guys do right risk entry boom you ATT into the trade right here nice at this point of time I will Target the previous swing low once again where is the previous swing low okay so this would be the previous swing low you always look towards the left right so this is the previous swing low Target just
right there and then let's just see whether we hit take profit right there okay it came down here okay I believe we are going very near the take profit right bam you hit your take profit right there congratulations you just want two trades out of I don't know 10 so as exciting as this risk entry are sometimes they just don't really work right because sometimes price can just tap into this auto block and just blow right past it and just reverse and hit up and just go against you in that case you have lost this
trade right so if you want to get a higher win rate that is where you need to deploy what I call a confirmation entry so unlike the re entry where you're entering straight away after price step into your order block on a confirmation entry you are waiting for extra confirmation after price has stepped into the aut block and if you use this method you will get a much higher win rate because you will actually be waiting for confirmation that shows you that confirms to you that the auto block is actually working and it's not just
like a fake useless auto block that price is just going to blow right past it step one is to draw your auto blocks obviously so over here we saw that there was a sharp and substantial downward movement just like this so in this case we can actually draw our auto block at a pivot candle right so for this right here is is a little bit weird right because it's a very large a so I just mark this entire AAL as my pav candle right here from the high to the low of this pivot candle so
now that we got order block right here right now we are just waiting for price to come back up here now for confirmation entry we are not going to be entering straight away when price step into the Zone we are going to be waiting for the structure to shift once price step into the zone right to get the extra confirmation what I mean is that I want to see this little pullback to be over basically right now price has done bullish to facilitate the pullback so what I want to see on the 15minute time frame
is for this little bullish uptrend this little pullback to be over right so in that case I need to look for some form of Market shift right so let's just continue to to look at Price pulling back all right you can see price pull back and then finally tap into our aut block that we have right here so based on this this was the last breakout structure to the upside right since this the last break of structure to the upside we know that this one right here is the lowest point that led to this break
of structure making this the last swing low that means if price comes down there and break past this last swing low that tell us that this pullback is over and right now price is turning bearish and is aligned with the higher time frame Trend and right now price is about to go down even further right to continue the bearish order flow so in this case like I said this is what confirmation entry is all about is waiting for the extra confirmation that tell you that structure has shifted before you actually enter for sell so at
this point of time I'm still waiting because it has not given me a valid Market shift yet right like I said if you are playing the risk entry you would have gotten in right here but in this case we are looking for the confirmation entry so I'm just waiting still waiting until price broke structural by the way this is more for swing Traders okay so yeah right there this is where we officially got that market shift right now right and this tell us that cool right now this pullback is over this bullish internal structure has
officially shifted bearish and the internal structure the lower time frame trend is aligned with the higher time frame Trend which is bearish now everything start to click like clockwork baby all right so this is where you got a market shift right here okay cool now this is where we start looking for our entry now to refine my entry what I like to do is to look for more order blocks that is within the entry time frame which in this case since I'm entering the trade on a 50-minute time frame I want to look for some
form of order block within the 50-minute time frame itself right so based on this I can spot that okay that is a little aut block right there okay there's one on the Block right there and then perhaps there's another one I'll say right here but this one has been mitigated so it'll be this one right here okay this one right here once again sharp and substantial downward movement right here guys let me just draw it out for you guys to see sharp and substantial downward movement sharp and substantial downward movement and you can see this
one right here it also did led to a break of structure okay and there was a gap so on and so forth pretty much for few all for quite well so now like I said I don't know which zone price is going to respect so I'm just going to R wait and see right so okay price eventually come up into this zone right here okay there's a chance that at this zone is going to go okay but we still wait for extra confirmation okay you can see price actually ended up going even further came all
the way up here to our extreme order block that we have right here and somewhere along the lines it just blow right past it okay tap into this order block right here so this one we can just completely get rid of now at this point of time this is where you can actually enter for a sell right here at the edge of this Zone and if you do actually enter for a sell right here at this order block if you think about it it's still some form of risk entry because you are still not waiting
for the extra confirmation right so for for it to be really a confirmation entry in this case I will go down to the lower time frame the 5 minute time frame and wait for this little pullback to be over over right this bullish pullback once again to be over and then that is when you can potentially get your confirmation entry in right there right there ladies and gents look at this internal structure on a 5 minute time frame this is the last internal higher low this is more for advanced Traders already we got the market
shift to the downside which tell us that right now price has officially shifted bearish and that is where you can enter for your sell position right there okay so you can enter for sell right here place your stop loss Above This aut block itself and then like I said you can take profit at the next uh structural or the next auto block that we have right down here okay so yeah this is potentially what a confirmation entry is about is really waiting for the extra confirmation before you pull the trigger right if you want to
even go like more extreme right more Advance instead of entering right here what you could have potentially done is to wait for price to pull back after this Market shift into this area right here right this entire demand zone right there and then you enter at the edge of this demand Zone and in this case you can see this is a one is to six risk throughout ratio trade right it's a very refined entry okay but yeah like I said this is more advanced stuff right and right now if you are a beginner take things
slow right Master the risk entry first then go and master the confirmation entry and then find out what works best for you and then based on the data that you have collected go and stick to that particular method whether that is risk entry and Confirmation entry for myself based on my own experience I found that the confirmation entry just works so much better for me because I found that when I use the risk entry sometimes the auto block just blow right past it and I just take a bunch of losses that I would have taken
if I just look or rather wait for the confirmation in the first place now to be honest all blocks itself is powerful but if you want to make it even more powerful you need to combine it with liquidity Concepts and if you can combine these two concepts it's like having x-ray vision on the market you can actually see where smart money entered for the into the market and where they are most likely going to enter and they can kind of predict and you can just do some witchcraft on the market inducements are basically traps for
retail Traders where smart money enticers market participants to enter for trades and transact at certain levels in this way smart money is able to generate a large amount of liquidity in order to fuer their large positions they basically entice retail Traders by using obvious chart patterns like double top and double bottom or support and resistance levels basically all these retail trading Concepts baiting them into entering the trade early for example when a retail Trader see a double bottom chart pattern just like this from at a support level they're going to endal for a buy thinking
that price will go up and as a result they will most likely be placing the stop loss below the support level or below the double bottom just like this and when this happens this actually generate liquidity because if the retail traders who ENT up for a buy right here get stopped out guess what they have to sell the position on the other hand this double bottom chart pattern also induces that retail traders who might be bearish and they want to enter for a sell when price actually break out of this support level right here in
this case there will most likely be placing a sell stop order below the support level or below the double bottom once again generating liquidity below these lows right here now once all the retail noobs have been induced to enter for their buy orders and their sell stop orders smart money would then manipulate price by pushing it down to sweep the available liquidity below these lows and when this happens this will generate enough liquidity to fuer that large buy orders and this causes price to Skyrocket to the up side this is exactly why you keep on
getting stopped out only to see price go in your way it's simply because smart money is just getting some liquidity from you now let's look at other types of inducements so in this bearish scenario right here we have price pulling back to this Supply Zone that we have right here and the minute price actually mitigate the supply Zone it from a double top once again when retail Traders see this double top chart pattern they're going to think that you know what I'm going to enter for a sell right here and place my stop loss above
this double top only for price to later go on there Swip the available liquidity above this double top before going back down right it's pretty much the same concept right here on the other hand there will also be retail traders who want to enter for a bite after price actually break out of this resistance level or this double top in that case they'll be placing the buy stop orders right here only for smart money to manipulate price up there and ssy them out of their position by causing price to reverse and hit in the other
direction after grabbing liquidity so yeah this is exactly why chart patterns don't work that well right so if you're still trading chart patterns it's time to stop all right on the other hand right here we also got a strong low and strong High example now the other type of inducements is also created when there is a strong low or Strong high in this case we got price pulling back to the last swing low right and what happened was that the internal structure turned bearish to facilitate that pullback so we could expect the internal structure to
be bearish and when we see price breaking past the last internal lower high that tell us that there is a market shift there is a shift in structure and price is going to head up right wrong because what can potentially happen is that price could just go up there sweep the available liquidity above this swing high right there before coming down there even further swipping the available liquidity below this swing low as well right so a lot of retail Traders they will most likely enter for a buy after this strong low is formed but then
later price come down and sweep more liquidity before actually going to the upside or in this very scenario right here where a strong high is formed after price actually break past that strong internal higher low right when this happens remember there is available liquidity above this swing high once again because all the retail Traders will end up for a sell here they will be placing the stop loss above this swing High only for smart money to come up there swi the available liquidity above the swing high and causing price to go in that other direction
so my tip is always look out for inducements when price is approaching a point of Interest like an order block a supply and demand zone or a flip zone or even a Swip zone right any sort of point of interest because when price actually approach those zones that is where so many retail Traders they will be impatient and they will enter too early just for price to come down and sweep the available liquidity before the actual move actually happens so always wait for liquidity sweep before entering and remember if you cannot spot the liquidity then
you are most likely the liquid instead of me yapping why not I just go onto the charts and show you how it's done all right so right now we got gu on a 15-minute time frame the first thing you want to do is to actually map out your structure so over here we got a break of structure to the downside and this tell us that this is that last 15 minute swing High okay so I'll just put this as the 15 minute strong swing high that led to this break of struction and then over here
we got price pull back a little bit before going down even further and this could constitute as your internal breakout structure okay so when we got a market shift right here where price actually broke past that last internal lower high this does not signal that price has officially shifted bullish this just signal that price is potentially turning bullish to facilitate that pullback back to that last swing high before continuing down goinging even further and continue creating that lower high lower low Dynamic so always try to understand what's the objective of price right what is price
trying to do so now we have figur out that okay price has officially turned bullish to facilitate that pullback so on the internal structure we can expect price to create higher highs higher lows until price actually break past that last higher low that last internal higher low give us the market shift a shift in structure then that confirm to us that price is Shifting bearish and we can look for our sell position to trade with that swing structure and then next step is to actually mark up your point of Interest okay so over here we
got our extreme Supply zone right here that led to this break of structure and then there is also another Supply zone right here okay there's also another Supply zone right here this is more of an order block right but I'll just label this as a supply zone right there let me just mark this up right there make it a little bit more cleaner okay so right now we have our two point of Interest we know that price is turning bullish to facilitate that pullback the objective of price is that it wants to mitigate this either
one of this Supply zone right fill up the remaining sell orders before heading back to the downside right so in this case let's just continue to play price forward and just wait for price to mitigate that point of Interest so until price actually does that we're not doing anything okay cool you can see price has stepped into our near Supply Zone remember when I told you that inducements tend to form at a point of Interest this is exactly what I mean at this point of time just because price has stepped into a supply Zone does
not mean that price is going to go down straight okay what can happen is that it can create inducements traps to entice retail traders to enter a sell position early just for price to go up there should be available liquidity before hitting back down even further right so you don't want to enter too early you want to enter at the perfect timing so at this of time we are waiting for our inducements okay can see price is reacting at the supply Zone but we are patient we are not doing anything whatsoever because first of all
there is no inducement second of all we haven't got a shifted structure that tell us that the structure have shifted bearish and right now we're going to continue to go down because right now price can continue to go up even further okay so you can see price started shifting bearish and then we are getting a reaction from this zone right here and what we have right now we have a double top right so if you look at this we got a price reacting from the supply Zone pull back and then goes up there react from
this Supply Zone again and then start coming down right here right so that is actually a double top and remember double top the two tops does not have to be the same height okay so you can have one that is high than the other it is still counted as a double top and in this case there is also another double top right here you can see like a fror double top right here on a 5 minute time frame okay so right here we got our inducements very very nice double top right here this is where
most retail Traders they might want to enter for a sell somewhere right around here and if they they do enter for a sell here guess what they're going to be placing that stop loss Above This highs right here and in this case let's look at what happened next okay price went down they are in profit they are happy they're celebrating you know they are considering getting that that new car right now because you know they have made 10K and boom they just lost I don't know their life savings or something right too bad for you
you don't understand liquidity right so if you're watching my video you shouldn't be operating in this way you should be operating like a professional professional all right so at this point of time we know that okay we got that inducement we are patient right we are not trying to enter for a sell here too early whatsoever we are waiting for our liquidity to be swept before actually entering for the trade itself and what do we have right here we got a very nice liquidity sweep right where price actually go up there sweep the available liquidity
above this swing high right here above this double top and then right now we can expect price to actually create like that reaction right but in order for this liquidity SHP to be valid it needs to create a sharp vshape reaction just like this so I'm waiting for that still I'm not entering yet you can see very sharp vshape reaction right very very nice now at this point of time we got our liquidity sh but that does not allow me to enter for the trade yet because what can happen is that price can still go
up even further because the internal structure is still bullish so you map out your internal structure you will see that okay this is that last swing High okay this is the 50-minute swing high and then this is that last swing low that we have right here okay so this is actually our - minute swing low so in order for us to confirm a shift in structural in order for price to turn bearish price has to break past this last 15 minute swing low right and that will tell us that price has officially shifted bearish right
so at this point of time we got our liquidity we are still patient we are waiting for our Market shift right here that confirm to us you know we are the lower time frame structure is alive the higher time frame structure then we'll start entering for the trade and there we have it a very very beautiful Market shift ladies and gents this is your entry signal right so at this point of time you know I will be mapping out the point of interest that led to this Market shift okay so this is a little Supply
Zone okay or order block whatever like to call it that led to this Market shift and this is where I I want to actually enter for the trade if you have watched my videos in the past you will also know that this is actually a flip Zone because we are reacting from this Supply right here I mean this demand zone right here and if this demand Zone were to do job price will continue to go up but in this case it created a f reaction right here right so this is actually our 15 minute flip
Zone and this is where I want to actually look for my entry price immediately pull back into the the area right there that me into the trade and at this point of time your stop loss you can place it above this flip zone or you can even place it above that that liquidity Swip right because once price s the available liquidity above this swing High we know that this high right here is somewhat protected right so in that case you can place your stop loss Above This high as well okay so it's really up to
you and for illustration purposes we're just going to keep this strategy simple and just going to Target about three hour okay just going to Target three R just like this okay so obviously I would actually place my stop LS Above This flip Zone I wouldn't place it so far up right because I know my all right so yeah you can see price pull back boom immediately going to profit look at that large amount of imbalance okay within like a few hours it just dropped into our Tech profit as simple as that this is the power
of liquidity when you can understand liquidity you're essentially God right you're essentially God now this is how I personally trade liquidity SS right there are some Traders out there who might actually add for a sell somewhere right around here after price s liquidity and in that case they'll be placing that stop- loss above once again this protected swing high that swep liquidity and could potentially be targeting this area right here right and in that case that might work for you as well right so if you want to do that by all means go ahead my
advice would always be the same and that is to test out which entry work better for you for me personally I need to wait for the market shift to give me further confirmation right and I get that multi-time Frame Alignment before I can actually you know let the trade do its thing but for some some of you guys who might be more aggressive then in that case you might want to enter straight away after the liquidity s find out what works for you Based on data that you collect after countless of back testing and forward
testing okay okay now let's look at the next example that we have on your USD on a 4our time frame right so same thing first things first go and map out your structure you will see that this is the last bullish break of structureal that tell us that this is actually the last swing low and then right here this is that last swing high so right now we know that the objective of price is that it's turning bearish to facilitate that pull back to that last swing low before price could potentially uh create that new
higher low and continue creating your higher highs and higher lows to the upside okay so now that you have understood the objective of what TR price is trying to do you must mark up your point of Interest which is step two right and you will see that this is actually demand zone right there a 4our demand demand Zone and then there is also another demand zone right here it's a tiny one because what happen is that price actually got there it pull back on the lower time frame make a small little pull back and then
it just goes back up right but it is still counted as a point of Interest right so this is actually our demand Zone okay so you can see right now price has actually tapped into this near demand zone right so when you look at this there is two demand zones there's the near demand Zone and then there the extreme demand Zone I personally don't like to enter on the near demand Zone because when you enter the near near demand zone right you try to enter for a buy right here and you place a stop loss
below this Zone what happens is that price could potentially come down and tap into extreme Zone before the real move actually happened and in that case if you entered once right here and then right now you enter again after price actually come into this extreme Zone you are prone to being wrong twice okay because what happens is that if this Zone fails as well in that case we have been wrong two times one time right here and another time right here but if you just enter the trade at the extreme Zone you might just be
wrong once and that's it right but obviously this depends on different scenarios in the market but that's a conversation for another day but for now price has stepped into our near demand zone so we are looking at what price is doing at this near demand zone so at this point of time price has actually reacted from this near demand Zone that we have right here right so let's go down to the one hour time frame and see what price is doing right and you can see we got that price reacting right here and we know
that we are trying to spot inducements at this point of Interest right so let's continue to play price and see what price does okay so you can see right here when price actually reacted from this demand Zone guess what all the retail Traders or rather most of them they're going to ENT up for a buy right here and they're going to be placing their stop loss below this lows because what happens is that price has just mitigate from their demand zone or their support level right so obviously price is going to go up now and
then later on price comes down Swip the available liquidity up below this low right here and look at what we have we got that sharp vshape reaction to the upside right there okay so at this point of time we got a strong low Bing from right because price is actually went up there and broke structur okay it broke structure right here okay when a strong low is formed just like this once again the retail Traders they're going to be entering for a buy right here and they will be placing their stop loss below this strong
low right here after all what could go wrong right this is a strong low price is not going to go lower than this right price is just going to go up right now so let's look at what happen next guys come on guys you're better than this this is what happens when you don't understand liquidity you are the victim of Market manipulation again and again and again right so wake up buddy so what we have right here was that price is just spping the available liquidity above this last high right here just for price to
go down even further and that is why I don't actually recommend you guys to actually enter on the near Zone okay so we got that inducement that strong low inducement right here we know that there is available liquidity below the strong lows right here okay so I'll just put that that liquidity Mark right there that shows us that there is available liquidity below this strong lows as you see right here price has just went down there and the available liquidity below the strong low and right now we can expect price to actually go up right
there and then and then actually creates that the real Market shift to the upside okay so at this point of time if you look at the extreme Zone the extreme zone is still unmitigated right so there is still a chance that price will come down in the future to mitigate this extreme Zone before it actually goes up there and break past that last swing High okay so right now if you did actually enter for a buy right here after you got that liquidity sit below the strong low you can potentially Target like this area right
here or one three R right like what I've mentioned earlier but let's continue to see what price does because what happens is that if you look at it closely at a high level you will actually see that there is available liquidity below this strong low as well right so this one is kind of harder to spot but once again I just want you to to time travel back with me a little bit okay so what we have right here was that this was that that last break of structure right to the downside which means this
is that last low and then we got price actually breaking past that last low that we have right here when price break past this last low we got a market shift right here and this tell us that this is the new strong low okay this is the strong low that led to this Market shift right here and because it is just a beautiful swing low just like this that is available liquidity below this swing low okay so yeah this one is a little bit trickier okay but right now remember your extreme zone is unmitigated so
what can potentially happen is the price is going to come down there sweep the available liquidity from this strong low before the real move actually happens and take out this swing high right here okay so you can see price came down later on available liquidity from that strong low okay once again you must understand the rationale of this when retail Traders what they will do is that they're going to be entering for a buy right here okay only when retail Traders maybe even a lot of expert Traders they see price actually creating this Market shift
right here they potentially enter a buy right here after this strong low is created and that is where they could potentially be Target like maybe right here or maybe even at this swing High because they're expecting price to take out this swing high right and maybe they placing their stop loss below this strong low right here maybe the entry was like right here because this is a little bit ridiculous this is a little bit too late but let's say they they they have like some good entry let's give them some credit okay and in this
case stop loss below this strong low liquidity right here they are trying to Target this swing high and then they see price going so near that that swing High then bam reverse against then they hit their stop loss now this is where they are raging all right this is where they are angry because they just got stopped out right here and that is really just price sweeping the available liquidity from this strong low and then the real move actually happens right there and finally take out that last swing high and move up to the upside
most trading gurus and idiots try to make these liquidity Concepts seems like something so hard to understand and complex but I promise you that by the end of this lesson you will be able to fully understand what is liquidity and how to spot liquidity correctly so what exactly is liquidity you must understand that for every buyer that is a seller because there needs to be a seller on the other side to fulfill your buy order this also means that for every winner there will be a loser that's just how trading is like and every time
you lose a trade you are essentially adding liquidity into the market this is is the key about what we're going to cover later so this is what it kind of looks like right you a retail Trader you get your trade stopped out because the smart money is so smart enough to know that you are an absolute idiot and purposely going to push the price down trigger a stop loss you lose your hard money or they just make a out of money now liquidity is not a problem for retail Traders like us because we are not
trading with a large sum of money however it is a problem for the big financial institutions because they are trading with millions and millions of dollars which means if they want to enter for a buy right they want to buy EUR USD with a million dollar they need to look for someone who is willing to sell a million dollars worth of Eur USD to them which is extremely rare therefore they need a large amount of liquidity in the market in order to place large orders and how do you think they're going to get this liquidity
by causing you to lose because when you you lose you add liquidity into the market remember so let's see what this actually looks like on the charts so when you see this you probably think that price is in the uptrend right because price is creating on higher highs and higher lows and higher highs and higher lows and right now price is creating a high highs so let's say you enter for a buy somewhere right around here and your first thing like the first thing you do is to place your stop loss right below this last
swing low right here now let's say on the other hand of this Market on the other side of this Market smart money want to buy your USD in bul okay and they need a lot of sellers in order to fulfill that order right so right below this swing low we have stop losses from the current buyers who are inside the buy position the long position in addition to that we also have the breakout or rather the reversal Traders the people who have a sell order somewhere right around here so that if price actually break through
the previous low they'll be entered into a sell position so here there is sell stops and there is also stop losses of current buyers so this is what smart money will do they will purposely manipulate price to grab liquidity by triggering the stop losses of the current buyers and the sell stops of the sellers and this is exactly why it is imperative that you train your eyes to spot liquidity because if you don't you are most likly going to become a victim and lose your H earn money if you're on the wrong side of the
market in this case what smallart money did was that they purposely manipulate the buyers to actually enter for buy orders right here and place their stop loss below this low and also all the sellers who have their sell stop at this area right here and then they purposely push the price down triggering all the orders that we have right here and all these buyers and sellers they out of the market right now and when they lose a trade remember they add liquidity into the market and that caused price to just hit up in like a
like a rocket way like a literally sky rocket all right and when this happens this is actually what we call a liquidity sweep right where price has already created that liquidity Swip come down here grab all the liquidity before fueling the up move front here and continue heading back up now quite simply put liquidity is basically pending buy or sell orders plus stop losses now the question becomes how do you exactly spot liquidity when you are trading and that is where the concept of liquidity zones come in so liquidity zones are basically where resting pools
of orders are sitting and where institutional activity may have occurred like I said our job as Traders is to follow the footprints of the institution Traders the big financial institutions the smart money because we understand that they are in charge of this huge move and in order for us to you know get in with those huge move with them and trade with them rather than against them we we have to understand these liquidity zones and make sure that we identify them properly so there are a few type of places where there will be a lot
of liquidity right and those are your equal highs and lows your swing highs and lows your trend lines and your support and resistance levels if you look at these liquidity zones right you'll realize that these are actually things that retail Trader look at things like a trend lines your support and resistance levels your even your down top and down botton right here right retail Traders are looking at this and they are placing their buy or sell orders based on these patterns that are showing on the charts and that is exactly why these are pending orders
yet to be filled which give us liquidity so let's go through one by one so if you look at equal highs and equal lows this is actually your double top and double bottom chart pattern right is where price creates the first stop and then come back up to retest that top before collapsing and when retail Traders they see this they will most likely Ender for sell right here right after price create this double bottom I mean double top and what happens next is that they're going to be placing that stop loss Above This stops right
here and this give us liquidity right and there will also be breakout traders who will place their buy orders right here right pending buy orders right here so that if price eventually break above these highs right here they will be triggered to enter for a buy order so you can see buy orders right here there is also stop losses right here for the sellers right here and both of that give ask liquidity at this area right here your liquidity Zone and sometimes what smart money will do is that if there's not enough liquidity for this
move to happen right price will be pushed up right here triggering out all the orders all the buy orders all the stop losses right here before pushing back down here and go back in that particular direction because right here it created your liquidity s right it give the price enough fuel to continue this down move so this would have been somewhat of like a liquidity zone right here that have been tapped into same thing with the double bottom right just the opposite of a double top right that is liquidity below these lows right here and
smart money they might push the price down here break past the previous swing lows grab liquidity before heading back up now next is your swing highs and your swing lows right we know that in the uptrend price is creating your higher highs and higher lows and in the downtrend price is creating your lower highs and lower lows and within this swing highs and swing lows there will be your stop losses your pending buy or sell orders once again there will be liquidity now in this scenario right here price actually created an up move right here
before it starts retracing and then creating another push phase and create your new higher high right here right and then what happens dicks was that price actually goes down and actually break past the last higher low right and when this happens this could signify to us that price price is about to change right this uptrend that we had previously could potentially be changing into a downtrend in this scenario right here what price will most likely do is that price is going to come up here to somewhere right around here and create a lower high before
continue back down right because CH if price break through the last high low to somewhere right around here it won't have enough liquidity to continue this down move and go all the way straight down right remember price will always have to retrace and that is why in needs to retrace so that they can have more liquidity before pushing price down even further and that is why price will retrace to this zone right here and grab the liquidity around this area create a lower high before continuing down even further same thing in this barish scenario right
here right price will most likely come down here redest create a new higher low right here before continuing the uptrend now if you're still unclear of what liquidity is liquidity is basically a magnet for price to be attracted to because the market needs to rebalance and in order to fuer further move right because the price cannot go up forever or go down forever is to go down retrace a little bit so that they can gain more fuel just like a car before continuing and heading back down right the market will never ever move up or
down in a straight line it needs some sort of fuel and that is where liquidity come in and then you have your trend lines right trend lines is where you know if price is creating an uptrend right you can draw draw your trend line connecting all these higher lows right here which means all the stop losses are going to be below all these higher lows as well and which means there's going to be liquidity below this area right here so that is exactly why sometimes smart money what they would do is that they'll push the
price down and actually break past the trend line and actually still hit back up right because they know for a fact that if they push the price break past the trend line that we have right here new retail Traders are going to think that this trend line is no longer working and you will get out of your position or you might even enter for a sell because you see this as a trend line break and in that scenario you have been 100% wrong because smart money will just push the price up like this once again
this happens sometimes not all the time but sometimes sometimes a trend line break will be valid sometimes it won't and lastly we have our support and resistance levels the most simple concept that you guys learn when you start trading and is actually the biggest threap right because like I said smart money knows that you are trading based on this support and resistance levels here here and they going to use take advantage of you right they're going to take advantage of your stupid brain so what they're going to do is that they know they have a
resistance right here they push the price up break past the resistance triggering your stop loss for the sellers and also making the buyers think that price is going to break out right now and then they're going to push the price back down and then they're going to break fast the support and then they're going to push the price back up and down and they're just going to play Mind Games rev you right and in reality what they are really doing is that they are really trying to trigger your stop losses you know cause you to
get out of your trade so you add more liquidity into the market and fer their move and a lot of times you see this pattern happen over and over again where you maybe enter for a buy right here and you place a stop loss like below this lad price will purposely get all the way down here push all the way down here hunt your stop loss trigger a stop loss before heading back up in that particular direction and then you're sitting there regretting like oh my God I should have placed my stop loss wider because
price purposely hit my stop loss and then go up oh no I'm oh no my trade did not go as planned now in that case you deserve it because you don't understand how liquidity works if you understand how liquidity works you will know exactly what price is going to do next and that is when this quote comes in if you can't identify the liquidity then you are most likly the liquidity now let's go on to the charts and actually app whatever we have learned so far about liquidity and see how all this works on the
charts so when you look at any chart right the first first thing the first step you should do is to identify the market structure I've mentioned this for like the past three years right the first thing identify the market structure because you cannot spot liquidity if you don't even know what's the overall trend Direction you don't even know what's the overall orderflow of the market whether it is bullish or bearish so first things first identify the market structure and you can see price is creating your lower highs lower lows lower highs and lower lows and
you can see price created a lower high right here and then it break past this previous low creating your bearish break of structure R here before retracing creating another lower high and then creating another bearish break of structure right here right where price broke passed the last uh lower low and right now price has retraced once again creating a new lower high but it has not break past lower low right here yet right you can see this the last low and right now most likely if price is going to respect this lower high price is
going to go down here and break past this lower low right here so ideally that is what we want to see in price but if You observe closely what do we have right here we actually have your equal lows right your double bottom this means that there will be liquidity in this area right here below all these equal lows so you can actually mark up like a little liquidity zone right here I like I just like put dollar sign because yeah it's it shows me that smart money are actually going to enter into the market
soon so we can expect price to actually goes down here sweep the liquidity below this load before heading back up right that is what we could potentially expect but like I said we never ever want to make sure that we assume what price is going to do we always want to make sure that we actually React to what price is going to do because price can actually go to somewhere around here and even go back up like this right right so we always want to make sure that we look and be patient to see what
price going to do next first then enter for our trade so you can see price goes down slowly and I can see price breaks past the equal lows that we have right here so the Rhythm Traders are bullish because they see this double bottom right here they're going to be entering for their buy position right here and place their stop loss below this equal lows right here because they see this dou bottom pattern and you know textbooks are showing them that dou bottom means you should enter for a bite right and they place that stop
loss below this equal lows and look at what happened here price got push down triggering all their stop loss so the buyers who actually end up for buy position right here they're out of the trade okay so they add liquidity into the market already now on the other hand we also have retail traders who are breakout Trad us that means that if they see price break structure like this right price break past the last lower lows means what price is going to continue going down already they're going to be entering for the cell position right
here as well and when they enter for the cell position upon the breakout they're going to be placing the stop loss above right here right above right here above this liquidity zone right here and in that scenario look at what happen next they also get stopped out when both side the buyers and the sellers the retail Traders they completely out of the market smart money was able to grab liquidity right now so in this scenario instead of entering for a buy here or a sell here you should have been very patient to wait for price
to actually break past the equal lows right here and create what we call your liquidity sweep which I showed you guys just now before entering for the trade so in this example we actually had a liquidity sweep right here because trust me when I say that if price wanted to go down right price would create this massive momentum and just goes down create a low high low low low high and low low but that is not what it actually shows us if You observe the candlesticks that's forming right here after price has broke past the
equal lows price is giving us small Candlestick right here and then look at these two Candlestick right here this show us that the selling pressure the selling momentum is gone the smart money have our is potenti going to enter into the market soon and they're going to enter for buy position in bulk right and you can start seeing some sort of bullish momentum right here so this is where you can actually enter for a buy position right here place your stop loss below these lows right here a best better entry be right here right the
immediately when price starts showing some sort of signs of bullishness after price actually grab liquidity right that is when it can enter for the trade stop loss below these lows and you can take profit at these highs that we have right here and once again if you you look at this what do we have right here your double top so that is going to be once again the same thing liquidity waiting for you at this AA right here so that would be a very good take profit for us right and that is we can place
a take profit right here one is the five R to rock ritual and look at what price does price goes up smash or take profit well all the retail Traders in the world just lose the hen money we are over here making the money stealing the hen money and that's just the coh hard truth of trading right trading is a zero sum game right it's either you become the winner or you become a loser and after watching this video If You Can implement the advice I give you in this video you will be the winner
that actually takes the money away from the loser because if you can understand liquidity properly right you will no longer be a victim of the market you will actually be part of the smart money and be able to you know not get your stop loss liquidity all the time and not lose your hard money all the time but instead be making profits just like this and right now since we're out of this trade right potentially we have identified your equal highs right here we're going to be waiting for price to sweep the liquidity Above This
highs right here and then that is when we can enter for a sell position right because if you look at the overall trend we are still in a downtrend right once again we are still in a downtrend and ideally we want to trade with the trend right and in that scenario we want to be looking looking for our sell position at these lower highs that's forming right here so chances are right now price is potentially forming a new lower high before heading back down to create your new lower low so right now we are waiting
for price to take out this equal highs to create a new lower high right here and then that is when we can look for our short position and take it all the way down to the next lower low so that is what we're going to be waiting for right we are waiting for signs that show us that this little retracement is going to be done and that is only going to happen after price just officially spp the liquidity above his highs right here and see price goes up there once again spp the liquidity above his
highs already and that is where you can potentially enter for sell position somewhere right around here once again what happened right here do do you guys realize that I didn't enter for uh sell position right here okay let me just buy play right here you see right here price created uh double bottom and I could have entered for a sell position right here immediately after price created this double bottom but I did not do that because I know that if I do that I'm going to place my stop loss right here and once again what
is that that is your liquidity Above This highs right here so what I want to do is to wait for Price once again to actually take out the liquidity above these highs here before entering for my position you see bam right there that is when potentially a liquidity is going to happen soon look boom there we have it the liquidity Swip just happened right here on this double top and this is potential a new lower high on the overall trend right you can see overall trend this is the last lower high and this is the
next new lower high and then this is the most recent low high and if you look towards the left that is actually your supply zone right here right there is your supply zone right here and just nice price has mitigated your supply Zone price mitigated your supply Zone you got your liquidity s Brer and based on Market structure price also in a lower high and yeah based on that we got all the confluences in the world for actually for us to enter for a cell position somewhere right around here but it's a stop loss Above
This highest right here IDE I will potentially enter for the cell position on like a 1 hour time frame like a smaller time frame and I have enter like somewhere right around here and then I will move my take profit all the way down here at this area right here right and this this is the last low and you can also draw like a little demand Zone here if you want and yeah this would have been like a very nice potential trade right here and just see on a higher time frames price goes down goes
down and eventually smash I'll take profit right somewhere right around here smash I'll take profit before price actually reverse and hit back up here now in in this scenario right here right the moment price actually comes down here tap into this demand Zone that we have right here you can manually just take profit and get out right ideally like I said I will take profit somewhere right around here I'll just refine this Zone a little bit somewhere around here and yeah then that will be my take profit price step into this Zone and then reverse
and H back up and look at what price does once again price grab the liquidity below these lows that we have right here right chances are if you look at it from here there is actually a support level right here and price actually creating your liquidity sweep right here before getting the momentum and hit back up now let me show you guys another example to make things much more clearer to you and this time around in the uptrend so let's say price in the uptrend once again creating a higher highs higher lows higher highs and
higher lows right here and like I said nothing goes up forever it needs some sort of momentum so let's say price is in the uptrend right now you know lots of bullish momentum R here and we could be expecting price to create a new higher high right here price created a higher low right here so I can actually mark up this low right here and then price is actually also created a higher high right here we know that that is going to be liquidity above the swing highs right here right above the swing highs there's
going to be liquidity and then there is also liquidity below the swing lows right here so we are waiting for price to Swip the liquidity either from the upside or the downside so we still wait and see what happens next right here price goes up here you know slip all the liquidity that we have above this swing high right here now what do you think is going to happen next we still wait first of all you could have easily enter for a sell position right here right right after price sh the liquidity right here you
can enter for a sell position right here and then place your stop loss above place your take profit all the way down at this swing low so in this case right after price has s liquidity from the upside look at what happens next price goes down here and go all the way down to this low that we have right here so if you actually enter for a sell position right here right after this liquidity s place a stop loss above these highs you will have me like a very nice 1 is to six R to
ratio trade very very nice now observe where price go next after price reverse at this higher lows it goes up here to the liquidity Zone that we had earlier right remember that is liquidity Above This high right here and then there is also your liquidity zone right here so this whole entire zone is your liquidity Zone so if price goes up here we know for a fact that smart money is potentially going to enter for sell orders right here right because once again there is selling liquidity at this area right here so the moment price
reach up here you could potentially enter for sell somewhere right around here after getting some sort of selling pressure right some sort of signs that actually show that they selling pressure and therefore for sell right there place the stop loss below this lows once again I ideally place my stop loss above these highs right here once again right you can see price obviously s the liquidity above these highs that we have right here before heading back down see the liquidity right here before heading back down so when price is breaking past this liquidity Zone that
we have right here right I wouldn't be really worried right if you could even like go down to like the smaller time frame and you realize that price is just simply swipping the liquidity Above This highs right here so if you want to have like a much better entry have probably enter somewhere around here right after this liquidity should happen you see this first sign of selling pressure right here here right your bearish candles stick place your sell order right there manually and then you can actually place your stop loss Above This highs and take
profit at this area right here and you can see huge move right huge move happens right after price actually spp the liquidity above the highs right here now the thing about liquidity is that I don't really use liquidity as my main Confluence I use it as an additional confrence for me to confirm for my entry so what that means is that I'm going to be focused on Market structureal supply and demand first as the foundation before even thinking about liquidity so I want to enter for trade based on Market structure right I want to enter
for a buy based on uptrend and I'm going to be seeing whether the intern structure align with the external structure or not and then I'm also going to be waiting for price to get your supply or demand Zone and then finally then I'll look at liquidity so my focus is never on liquidity because liquidity can is just an additional confluence for you to enter for the trade what this means is that you need to master Market structure and supply and demand zones and even order blocks first before you can even think about understanding liquidity so
inside this full complete course on autoflow here's what you will learn what is autoflow why use aut flow right we have g a deeper understanding behind the Dynamics of UT flow and how price price move right inbalance versus balance and how order flow actually move prices and how to trade with order flow using both footprint charts and Candlestick charts now please watch this video in order from start to the end don't skip around right if not you won't be able to understand what I'm actually saying because you need to have a deep understanding of how
price works on the fundamental level in order to understand and master order flow and like I said if you don't have the attention span to even watch me fin a goddamn video how I going to have the patient to become a successful Trader dumbass now what is orderflow orderflow trading allows you to see the interactions between the buyers and the sellers in order to identify who is in control of price and that's really all successful trading is about right it's about figuring out who is in control of price whether the Boost or the B and
being on the correct side of the market it's the process of analyzing the flow of Trades being placed by other Traders institutional Traders retail Traders on a specific Market or an asset by watching the order book or footprint charts right so this really allow traders to see the amount of buy and sell orders that are being placed at a certain time in the Market at a given price point and guess what this allows you to do this allows you to anticipate changes in price before the they even happen so the truth is why do we
use autoflow right what is so magical about autoflow and the truth is autoflow is not a holy grill right but it allows you to figure out what price is doing and that's the most important thing ever and it is not lagging that means it's not moving like a snail like all the other trading indicators so if you are still trading with goddamn moving averages Ballinger bands RSI understand that you are a bit late to the party body so in trading the fastest finger wins if you are able to understand order flow you will be able
to understand how the market move and most importantly how price works and this really allows you to gain such a deep understanding of the market and change your Paradigm so that you are aligned with the professional traders that actually know how to move the markets right and this really allows you to overtake all the other retail Traders like what using boat is doing right here who are still relying on all the lagging trading indicators of freaking stupid chart patterns right here right all these guys here right so don't don't be like this guys here be
using Bo my friend so by trading order flow you are able to gain an edge over the retail Traders right pretty much the entire retail space because trust me no retail Traders are going to be looking at UT flow who the hell cares about order flow order book when you can rely on chart patterns he he you know because when you are trading UT flow you are able to see institutional activity that means you are able to see what all the big boys the smart money the financial institutions the investment funds the okay basically all
the smart money what they are doing and if you're able to see what they are doing earlier than the rest of the world you will be able to trade with them so when those big move happens in the market you will be able to get in before they actually even happen now not only does it allow us to spot institutional activity earlier it is also much more reliable since it comes straight from a centralized order book right and order book is basically where you see all the limit and Market orders that is existing inside the
market right so all the buy or sell orders is all shown on the order book and this centralized order book literally shows everything all the orders this means there is no hidden orders from the black market or something out there right it's all on the order book right like come on all the orders are literally displayed right in front of your face on the order book itself and that relationship really helps you understand what's actually going on in the current market environment and when you are really able to understand what's going on you are able
to be in sync with what the market is actually doing right and you will be able to really write the liquidity and quite simply put Market liquidity doesn't lie numbers can't lie right you are literally looking at cohart numbers which tell you exactly who is in control of price and yeah that there there's no way that it's a lie it's cold hard truth so the financial markets work based on the auction Market Theory which states that financial markets are just like any other business in this world meaning there's going to be buyers and sellers and
they are both actively trying to seek the fair value of an assets right this theory is based on the principles of supply and demand and the ction process and that's really how the world works right if you go to the market right you're essentially buying from a seller and if you are trying to sell away your used car or your Apple iPhone or whatever you are essentially looking for a buyer to fill up your sell order right same thing with the financial markets so let me just give you a quick example to really deepen your
understanding behind this auction market theory and what is this complicated weirds THM all about say that is a beautiful 5 bit room house that is on auction right now and it's priced at $400,000 now since this house is so gorgeous and is located right beside the beach you know has such a great location people perceive this house as valuable so they start biding for it I want to buy this house at $420,000 I want to buy this at $430,000 and then when this happens this creates Demand right this creates demand for the house and since
there's only one house and there's so many people just building for the house the demand exits Supply right when demand exits Supply this drive the price of the house up to $450,000 now this is the new price that the market deems is fair meaning this is the fair value of the house now suddenly let's say there's a bad news Okay bad news come out about the house is being announced uh the roof is falling apart uh it does not include Furnitures right so whatever you see right there is just your imagination it's not real right
you are not going to get the nice letter so far it's not included with the house boom when this happens people start backing out yeah come on man this is what I expected and this is what I get come on doesn't make no sense so people start making backing out and since less people won the house now Supply exits Demand right and this causes prices of the house to drop to $420,000 which is the new fair value of the house right is the price where the beaders they deem as Fair since now he has take
into account all this bad news right and if they project the cash flow right how much return on investment this house can actually get me is actually not that great right so this is the new fair value however let's say later on good news come out again if you buy this house you get a nice Tesla right for free buy one get one free this obviously not real but like let's say it's real later on good news come out and this causes price to actually increase back to $450,000 right because now there is people who
is more interested in the house and demand exit Supply once again essentially this is what happens in the markets every single day every single day buyers and sellers they meet each other and what they are doing is that they are trying to find the fair value of an asset be it a stock or a crypto coin or a Forex currency pair right which result in buy or sell orders which pretty much constitute the order book and mix up the aut flow and this is exactly why price is always moving from balance to imbalance to balance
and imbalance right if you look at the charts right now any price charts on trading view whatever you will notice this common similarity and this is essentially just how the markets move on a fundamental level right to really understand how it move on a fundamental level you need to understand the concept of balance and imbalance so in a balanced Market buyers and sellers they agree on a certain price based on their perception of what is fair your fair value and this leads to lower volatility and price just remain quite stable right and this causes price
to range right just stuck in a consolidation just like this where it's just going sideways and not really going anywhere however financial markets they can't stay in this balance forever because new information is going to come in new information whether that is fundamental news or it could be technical right based on price action this causes markets to move away from the fair value and transition into a completely different environment which is your imbalance right and imbalance occurs when there is a disagreement about the fair value and this is where one side of the market participants
beat the buyers or the sellers they actually become more aggressive and this leads to a trending markets and imbalance actually caus price to either move higher or lower until eventually this imbalance Fades away doesn't have enough momentum anymore and it stops and price starts consolidating again going back to the balance phase and then eventually it can't stay in the balance forever so it eventually break out the balance B phase going into the imbalance phase back to balance and this just happens over and over again right and this is essentially just how the markets work if
you think about it this is actually How the Universe and how life works it's always a balance between Chaos and Order inyang so quite simply put the market are basically an oscillation between imbalance and balance because it is always seeking fair value when there is an efficient market it is not able to stay in there forever because eventually due to some sort of new information demand will exit Supply or Supply will exit demand and then when this happens this causes your invalent to occur right where there's a lot of buyers valal sellers or a lot
of sellers valid buyers imbalance right just imagine a seesaw right it's like it's like not balanced right now that's why we call imbalance and when there's this imbalance creates inefficiency in price and then price look for balance again to form an efficient market and this whole Loop just keep happening over and over again forever and this is essentially just how the market Works don't ask me why this is just how it works right so your goal as a Trader is to really make sure that you can capitalize on the inbalance move because that is where
the big money is at just think about it when you go on the charts you identify all those large move that you always miss CU you suck at trade these are where the big gold mine is this is where you're able to make the most amount of money by really capitalizing on all this large move so like I said your job is to look for this large move and actually get in before they happen so they can write this large move and make a lot of money very very fast now when you look at a
Candlestick chart just like this it doesn't really give us information that tell us about uh volume price price and the exchange between sellers and buyers right when you see something like this all this green Candlestick tell you just that this is actually a bullish Candlestick right and this tell us that okay there buying momentum and price is going up but that's all it is that's all a Candlestick chart tell us and if you see a red Candlestick it just means that price is bearish and price is going down now you're essentially looking at the outcome
of buyers and sellers right you are not looking at how it was being formed and looking at just at what price is doing like what's the outcome right it doesn't really tell you what is going on at a deeper level beneath the Candlestick and that is when your footprint chart come in right so this footprint chart how it works is that once again it dissects the Candlestick into orders right so the right hand side all these numbers right here it basically show you the buy orders right the market orders on the right side are the
buyers right so you can see all these numbers is essentially how much buy orders at the specific price and then on the left hand Sid this is basically how much sell orders on the left hand side what the Candlestick does is that it just show you the outcome right it shows you the high price the close the open and the low but a footprint chart actually show you how many orders how many buy or sell orders happen at each price each pip now this is important because when you are able to get get so much
more information when it comes to volume and the exchange between the buyers and the sellers between the supply and demand this allows you to really understand on the fundamental level who is actually in control of the market and yeah this is just very powerful if you can really look at this footprint chart and actually understand what is going on with all these randomiz numbers you will be able to understand that nothing is random in the market now let's talk about how orderflow actually move prices right and let's kind of understand how this footprint chart works
on a deeper level so when you look at your bit and R spread or whether this is actually your order book right so let's look at the order book and how this order book works is that these numbers on the right hand side this are right these are essentially your sell orders okay as simp as that these are your sell orders and then this bit right here these are essentially your buy orders okay but here's the the the tricky part right these numbers right here right it represent the amount of orders at the specific price
so this is essentially 1,3 sell orders at this price and then this is 1,687 sell orders at this price but you can see this is the market price this is where the market currently is at right now this is price of a specific asset right now so over here here right all of these right here all of these are essentially what we call your limit orders now if you don't understand what are limit orders they are basically orders that have yet been activated they are pretty much pending orders inside the market right because right now
this is where the market is at right this price right here is the price of the asset and right now these sellers they want to actually enter for a sale at this price they want to enter for a sell at this price or this price right and you can see these are the different number of orders that is located at different prices right these are all limit orders which haven't been activated yet now let's say that is an apple that cost $5 and this just to help you understand what is the difference between limit order
and Market order so Apple cost $5 a market order is you buy the apple right now at $5 right you don't care about what the price is right now you just buy okay that's a market order you execute at the current market price a limit order is when it some sort of condition you only want to buy an but only if it cost less than $3 okay that means that $3 it's actually below the current market price which is $5 so in that scenario I only want to buy when this at $3 but right now
it's not at $3 yet so I will wait until price of the apple drop to $3 then I will get in for the order right so that is essentially what a limit order is now the Apple will be bought when its price dropped to $3 or lower so quite simply when you look at order flow if you think about it from the first person perspective right or underlying belief autof FL is essentially a interaction between your limit orders and your Market orders and this pretty much forms the liquidity that you see in the market so
let's say John right John this guy is a Trader working for a large financial institution and this guy has Insider information right which is not accessible to public right that is why right when you look at news and you expect the news to actually come up and actually cause price to move but then price has already made a huge move before the news even come out and that's most likely because this institutions Traders this smart money they have inside information and they act on it before the news actually come out which result in all this
large move before they even happen so yeah let's say John this guy right he's an Institutional Trader right so that means he's managing millions of dollars he has a lot of buying power right and he has Insider information which happens to be positive news so he has to act on this information as soon as possible before the market knows about it before the news come out and the market takes into account of the news he has to act on it right now so he's not going to be placing a limit order which will take like
a few hours to fill up he's going to execute the market order which allows him to get into the buy position immediately and he's going to do it with a lot sum of money and I'm talking about Millions if not billions of dollars here and this is essentially where a process actually create imbalances right this actually fills up all the ask on the order book right it fills up all these ass orders you can see previously it was like thousand uh sell orders right here right thousands of sell orders but right now it's all being
filled up boom boom boom boom boom it's all been filled up and when this happens it's because he was able to execute a large buy order right was able to enter into the market in bulk and this creates massive imbalances in the market if you look at the left hand side right it creates your inbalances and like I said your goal as a Trader is to really spot the imbalance move before they actually happen so that you can write the big money and make bank now how do we spot these imbalances and orderflow by utilizing
footprint charts right and that's what we're going to talk about next so where do you actually find footprint charts there's actually three main software that you can actually find these footprint charts to trade with to really understand the underlying order flow and first is atas and second is trading View and next is Sierra chart right in my opinion I think Adas is the best software to actually use when it comes to finding and actually utilizing your footprint charts but like I said here a quick note footprint charts are not cheap at all yeah it's actually
not cheap so if you want to trade like professional Trader because this is what professional Traders look at it's not going to be cheap just going to war you and yeah different software have different packages and different pricing for the footprint chart anyways now let's go on to the footprint charts and let's learn how to trade orderflow now when you go on to trading view you have the option to switch to your footprint charts just by pressing this button right here and right now you're probably on the Candlestick charts just need to press it click
and volume footprint and then you will be able to switch to the footprint charts bear in mind this is only on the Premium plan and above so you do need to purchase a subscription with trading view in order to access these footprint charts like I said it's not cheap but if you want to be serious in trading and you want to add this footprint charts Into Your Arsenal then this is something that I recommend you to actually invest in right so let's dive deep into how to actually read this footprint charts right so I'm just
going to zoom into one Candlestick like this so over here we got the candles stick and on the right hand side we pretty much got the buying volume right the buy orders and then the left hand side we got the sell orders the selling volume right so this is basically your bid and us right so when you look at this you can see there's a lot of things going on here but like I said I'm just going to simplify things with you guys by having like a little description for you to actually understand what's actually
going on with this footprint thing here right so uh first of all maybe you want to copy my settings so let me just show you my settings you can just pause the video video right now and you can just copy this settings that I have right now and basically the darker the gradient right you can see the darker the gradient of the footprint rectangle thing the more volume that is right the more orders that is right so let's go dive deep into understanding how to actually read these footprint charts right so once again left hand
side what you see is your cell orders and like I said the darker the the color right the more order that is right so you can see the number in the middle that pretty much just represent the number of limit orders right that pretty much represent number of orders inside the market right limit or Market orders right so you can see the gray box basically represents like the most amount of order so pretty much this pricing right here 1.08 for aial this is when there was the most amount of buy orders and there the most
amount of sell orders being filled up right so you can see 4.6 22k buy orders right there for 3.8 to8 K sell orders right there right so that's basically how you read these numbers right so first thing you have to understand is that the darker the shade of the green or red right the more orders that is and yeah the higher the number is basically means that it's higher amount of ERS right it's it's not rocket science and then when you come down here this Delta thing right Delta this number right here it basically represents
the difference between your buy and selling volume or orders right right so it's basically you just take the toal total amount of buy orders right minus the total amount of your sell orders okay and then the total right here this number right here is pretty much the total volume the total amount of orders when this entire Candlestick was being formed right here okay so if you see like a positive Delta number like this like 7.53 4K that's pretty positive right this tell us that that is aggressive buying now if you see a negative number right
say maybe this one right here yeah this one right here you can see this means that is aggressive selling right and one thing to note is that just because the number is positive or negative does not really mean that the number like it correlates to who is in control of price for example right here even though the Delta was negative right meaning there is a lot of aggressive selling going on here the Candlestick actually end up bullish right it end up being a bullish Candlestick which means the Bulls are actually in control of price even
though there was a lot of selling so yeah that's one thing that you guys have to be careful of don't just assume that just because the Delta is negative that means that sellers are in control or just because the Delta is positive buyers are in control now that's basically how this entire footprint chart actually works like how you actually read it and there's different type that you can actually choose from you can see this is the normal buy and sell one and then you can have one where is the Delta one which is just focus
on uh just like one row instead of having two rows where you differentiate the buy and sell one you just have one row which shows you the total buy volume here total sell volume here and then if you go to the total this is just volume right just really looking at the total amount of orders total amount of volume so yeah that's pretty much how it is we're just going to stick to this one because this one really tell us the buy orders the sell orders and whether there's any sort of imbalance whatsoever okay so
that's basically how you understand a footprint chart now let's talk about how to actually trade it how to actually add it into our trading Arsenal first things first this is a very important thing to note right I don't really like to jump straight into the footprint charts because this is what your charts will look like if you just jump straight into the footprint charts it's very hard for you to understand what's actually going on so what I like to do is that I would start off by analyzing my charts on the Candlestick charts you know
a normal Candlestick chart and how I trade is that I always like to build a higher time frame narrative first that means I need to understand who is in control of price on the higher time frame and for to do that I don't really need to look at footprint charts to actually confuse myself I just look at Candlestick charts I analyze the price action I look at the market structure to see whether price is in bullish or bearish order flow right so obviously first things first is you map out your Market structure right so if
I have to map up my market structure based on what we have right here you can see price is pretty bullish right now so price actually created a market shift right there and then this led to the market reversing from bearish to bullish so now based on looking at the candlesticks alone you would see that the buyers are actually in control of price right there is more demand than Supply in the market and then when price actually break above the market shift it actually end up creating a new higher high higher low and it's starting
to create a new high so I can actually have my bullish break of structure right now right so that's all I'm trying to do is to really map out the market structure identify any sort of underlying point of Interest maybe that's like a supply Zone that we have right here right you can see your supply Zone mark up any significant uh point of Interest then there's a demand zone right here so we are pretty much playing within this range right now right so the first things first is to always go and build the higher time
frame narrative to see what is the range that you are trading within and also to see whether price is in a bullish uptrend or a bearish order flow right and we do that just by purely looking at candles stics right and really analyzing the market structure now my point or rather here's a tip for you guys because this is what I do right I just wait for price to get to a point of Interest then I switch to footprint charts okay so I only sarch to footprint charts when price get to some sort of demand
zone or Supply zone or order block or sweep zone or flip Zone some sort of point of interest because what I'm trying to do is to figure out whether price will respect or disregard that point of Interest like just blast right through it and how I knowe that price will actually respect this point of Interest is when I go down and look at the footprint and I see whether the sellers or the buyers are in control of price at this a right if at this AA this buying momentum it starts losing some sort of momentum
right and I can see like the buying volume fading away right the buying the buy orders are fading away and the sell limit orders are just filling up and it's going to cause price to actually resp this Supply Zone that we have right here and actually go down if I am able to see sustain buying PR and and actually there's a lot of buying volume and it can actually sustain right there actually an aggressive buyers and the buyers are still in control the most likely it's going to pierce right past this point of interest that
we have right here okay so right now price has reached our point of Interest let me just delete this and then I will probably just switch to the footprint charts right here footprint charts and then I will go down to perhaps the smaller time frame to analyze what price is doing at this Supply zone right so like I said right just because you get a NE netive Delta does not mean that the sellers are in control of price right so you just need to understand that what this footprint charts does is that it tells you
who is more aggressive and who is more passive now the aggressive people are the ones that is filling up the market orders right they're actually filling up the market orders they don't care about what price the market is at right now they just want to enter for the trade those are the aggressive Traders and then the passive Traders are the ones that have their limit orders right they have their by limit orders they have their self limit orders right they are not as aggressive as the aggressors right and yeah that's basically what does it shows
you who is more aggressive who is more passive and like I said the higher the number the more aggressive the the person is right the Traders is and like I said most importantly you just want to focus on the volume right at the point of Interest so right now price come into this Supply Zone how do we know that price is going to respect this Supply Zone we need to see that the price actually loses control right I mean the buyers actually lose control at this Supply Zone that is what we want to see if
price were to respect this Supply Zone and reverse you must see the buy orders right the buying volume Fades away and Supply step into the market and take control of the market right that's all we are trying to do so right here you see price approach this Supply Zone and if you are observing the Delta that we have right here right and looking at the total orders what we have is that there's a lot of strong momentum right you can see positive delal right there's a lot of aggressive buying into this Supply Zone and the
volume's also quite high right the volume is also quite high and just getting more and more aggressive but you can see over here the trading volume is starting to decrease a little bit compared to what we have right here so there is some sort of Supply starting to enter into the market so to simplify things even further let me just draw it out for you guys like a quick example so let's say there's a demand zone right here and then price is going down right to the demand Zone and he has a lot of aggressive
selling volume right and price is just going down you know negative Delta uh strong amount of volume there's a lot of orders a lot of momentum pushing the price down eventually when price get to this demand Zone you realize that it can't seem to break pass it multiple times right even though there's a lot of aggressive selling right but it can't seem to break pass it this is because there's a lot of demand at this demand Zone and pretty much all the buy limit orders that we have right here is just eating up all the
aggressive sell orders right it's literally like Pacman right the all the passive limit orders right here all the buy limit orders right here is eating up all the aggressive sell orders that is why this demand zone is most likely going to hold and price is going to trade even higher and potentially reverse because of the fact that the buyers are actually took back control of the market at this demand Zone just because the passive limit orders was just so overwhelming so that's essentially what we are trying to do on by using the footprint to do
right so by seeing price actually approach this Supply Zone that we have right here we need to see what the volume is actually showing us right we need to see whether the aggressive buyers are able to break past this Zone and to do that it must overwhelm the sell limit orders at this a here if not then the Supply will come and step into the market and price is just going to reverse and hit back down as simple as that now here's another example So based on the price action that we can see right here
there's a lot of demand at this a right there's pretty much a lot of demand at this a supporting price right so this entire area here there's a lot of demand at this area so this is the demand Zone and you can see as price comes down into the demand zone right we observe the Candlestick when it actually reach that point of Interest right so that is where we really want to focus on the footprint right and if you look at this Candlestick right here the one that actually touch into the demand Zone what we
have right here was that there was a lot of aggressive selling right there's a lot of aggressive selling that results in a negative Delta all right and if you look at this there's a lot of trading volume and there's a lot of aggressive selling but if you look at the buy orders right that is 2.46 2K buy orders and that complet overwhelm the 1. 381k sell orders now this pretty much tell us that okay even though the sellers were aggressive but then there is so much demand at this demand zone right there was so much
passive limit orders buy limit orders that actually just completely eat up the sell orders that we have right here which result in price respecting this demand zone right and then next thing you know demand stepped into the market and push price up forming this huge bullish candle STI right here and you can see the Delta is a very big number like a very big positive number right and this pretty much just show us that demand have officially stepped into the market and quite simply that's essentially how you actually trade footprint charts right you basically just
want to wait for price to get to a point of Interest right be it a supply or demand Zone and then to decide whether it's going to respect that supply and demand Zone you go and look at the aggressive selling aggressive buying and then figure out who is actually in control of price right and just like I said just because that is aggressive selling doesn't necessarily mean that it's going to break past the demand Zone because the passive buy limit orders can eventually just eat up the the aggressive selling and just cause price to reverse
so my advice would be to always start off with the higher time frame looking at the Candlestick chart first to figure out who is actually in control of price like whether price is bullish or bearish based on the higher time frame narrative and as much as possible stick to that buyers so if price is bullish on the 4our time frame you should potentially look for buy orders within the lower time frames and then you just wait for price to get to some sort of demand zone right and then once price get into the demand Zone
on the lower time frame you go to your footprint charts and you see that what you want to see is that you want to see buyer St back control of price right if price is pulling back to that demand Zone you want to see buyer St back control and that is when you can potentially enter for your trade right so off fo pin charts work is that it act as like a additional signal right so at the end of the day price action Market structure supply and demand liquidity all of these concepts are really what
Drive the market as well right and they are they always going to be the core components of my own trading strategy my own mechanical trading strategy this orderflow this footprint charts thing is just an additional Confluence trading plan is what's going to allow you to grow your account but re management plan is what's going to allow you to survive in trading it's what's going to allow you to sustain and play the long game if you want to trade for a few years like literally treat trading as seriously as possible and treat it like a business
and not just like a hobby so that the market don't treat you like a joke you need to practice proper risk management so the question becomes what is risk management so risk management is basically a set of rules you Implement to ensure that the impact of being wrong is tolerable so that is the definition of risk management and what does it really mean it basically means that you will lose money in trading but in order to become consistently profitable you have to win more than you lose when you win you have to win big when
you lose you have to lose more and in order for that to happens you need to make sure that when you lose you are losing as little little money as possible Right the loss is not so big where you know you are literally risking one quarter of your whole account on one trade and the thing about risk management is that if there's no risk there is no reward no risk no story right to achieve anything successful like genuinely like great you need to risk some sort of things right and in trading that is your heart
ear money and bear in mind that you are a Trader not a gambler I want to instill this mindset into you guys you are a Trader not a gambler a g gamble Gambler a gambler is the guy who go to the casino you know decide to okay Bet like okay this amount of money and this am money and then eventually give all in you know all in let's put all my chips into the poker table or the slot machine you are a Traer a Trader is the guy who take calculated risk a Trader is the
guy who knows how to manage his risk so that he can stay in the longterm and he can actually make consistent profits like I said this is absolutely essential all right it's not uh okay you know what maybe you don't need risk management it is are essential right you need risk management if you want to become profitable so risk the definition of risk is basically the amount of money you are willing to lose for every trade that you take so if you have $1,000 in your account and you want to rise $100 then by all
means go ahead rise $100 and that will be your risk right so it's basically the amount of money that you are okay with losing so in Risk Management there is three rules that I want you guys to Master we will go through each one of these rule in the following lessons where we talk more about uh risk management like Leverage risk but trade RIS to reward ratio risk Capital all these terms we're going to talk more later but for now since it's just like an introduction you guys must know why risk management is important and
how risk management is important and basically this just shows you right so example the first rule is the maximum loss on a given trade should not exceed 1 to 3% that is the standard rule the reason why we keep the maximum loss so low is because if we only RIS 1% per trade we can lose 100 trades in a row before we blow our account before we lose every single money we have in our account if we reach 3% per trade we can take like what 30 trades before we even I mean we can lose
30 trades before you can even like you know see our account balance go to zero so it give us this large room for error right ensuring that okay even if you encounter losing streak which is very common by the way it is okay right it is okay rule number two is to carefully determine your position size based on applied leverage right the second rule of risk management is that you need to make sure that when you are trading you are using the correct position size and this depends on your account size your risk tolerance your
risk per trade your stop loss distance all these things determine how wide or how tight your stop loss is ideally we want to have like a tight stop loss but that's cannot be always the case because there's sometimes where we might enter the trade a little bit too late and then the stop loss distance have to be a little bit wider in that case you need to adjust it so that you know what it still low and it actually fits your risk per trade don't worry if you still don't get it I will talking about
this later on what how or why or how what how do you choose the correct position size when you are trading rule number three is where we talk about how you need to maintain a consistent risk to reward ratio for all your trads and it should never ever be one is to one 100% it should never ever be one is to one because if you're trading you should want to get back in return at least twice of what you're risking it doesn't make sense to risk $1 to make $1 then why would you even risk
in the first place it's count as a risk because you expecting something higher in return so one is to one is a no goal at least r one is to two once again I'll talk more about all of these rules in detail later but for now you guys understood why racek management is important is because you need it to survive in this market you need it if you want to trade for the long term and actually you know become a full-time Trader you need to preserve your capital in order for that to happen because imagine
you start off trading with $100,000 that's all your money that's all your life savings and you jump into trading full time with 100K and you start taking trades boom boom boom and you rise 10% on each trade boom 10% 10K and you lost that trade then you R another 10% boom thank and you lost another trade and then you keep on doing this until you eventually lose 100% of your capital and guess what now you're broke you have no money to trade with anymore and now you have to go get a job at McDonald's or
some just so that you know you can raise Capital again so they can trade again right and it all comes down to risk management if you practice proper risk management in the first place you risk 1% instead of 10% then you lose what 10 trades in a row you only reach 10% I mean you only lose 10% which is okay right it's still easy or rather duable to earn back that 10% and eventually grow your account right so bear in mind that no risk no story once again these are the three rules that you guys
should really take into account of when crafting your risk management plan and this whole syllabus right here risk mitigation framework is where I give you the details you need to know in terms of how to manage risk when you are trading and your job is to go create a risk R management plan out of these rules right have strict rules where you know you must obey these risk management rules when you are trading because if you have rules and you trade based on your rules your trading will be less emotion based and you'll be much
more rules based where it's much more rational and logical so that is generally how you can you know use risk management to your advantage okay so I'm going to share with you guys everything on the Whiteboard so that it's much more easier for you guys to understand so the first thing I really want to talk about is what we call your risk Capital now what is risk Capital risk capital is basically the amount of money that you are putting into your account right your trading account your live trading account and you can see risk Capital
can depend on like it's different for everybody right like I might be okay to put 100K into my life account right sex figures in into my life account but you might have less than $1,000 in your bank account and in that case you might only want to put in like $100 into your life account right so it's really different for everybody and the main concept on risk capital is you should only be putting money that you can afford to lose that's it it should only be depositing money that you can afford to lose into your
account account into your live trading account I want you to go into this mindset where whatever money that you deposit into your account balance treated it as you just lost that money it's no longer yours and when you do this right this give you what we call a Detachment right what we call a Detachment where you are no longer like constantly worrying about the money you know like paying bills and you know paying for food because this money here is just like disposable income it's not your life savings it's not the money that you need
to depend on in order to live in order to survive right cuz this is just disposable income so for example let's say you have $5,000 in your account even though like most you know people don't even have $5,000 in your account but let's say that you are somewhat like you know have a stable job and stuff and you've managed to save up like $5,000 $5,000 you shouldn't be putting all of this $5,000 into your Live account I did this last time where I would only have like $500 in my account and I'll deposit all of
it inside my live trading account and when I do that I start taking trades and every single trade I take my heart started beating faster and faster because if I lose this trade I am literally going to be broke soon right and I was risking like what $20 or even $50 on each trade and I lost like 10 trades in a row and I just blew my $500 account and I have Z in my life account I also have Z in my bank account that was the worst part so generally let's just go back to
this right you don't want to put 100% of your money from your bank account into your trading account that means it shouldn't be 100% right right what's a good range I cannot really tell you the exact amount or a good range a good percentage to put inside a life account because I'm not a financial advisor here but if you really really want to it should be no more than 10% honestly no more than 10% so if $5,000 and 10% is probably like what $500 yep should only be putting $500 do into your account right that
is my rule of THB right because this is a good percentage where you won't feel so attached to the money so the other 90% right here right which is what 4.5k right 4.5k this amount of money you can use to you know go pay your monthly expenses your um transport food put for on the table pay your phone bills all these thing you need this money all right you need this money that is why when people ask me whether they should quit their job to trade I would literally never never advise them to quit their
job to trade like generally you should have some sort of like income on the side when you are trading when you're just starting out and you're not profitable yet you shouldn't just solely depend on trading you need to have some sort of income so in that case the risk Capital here we had was $500 and it was 10% of our total money that we have in our account so this was the total capital and this is what we call the risk Capital right so this is the amount of money that you're going to put a
live trading account so like I said I genuinely would not recommend you to put more than 10% into your life account because the thing about trading life is that the first few times that you trade life you will lose money right you will lose money and you might even blow accounts I myself I blew my first account and I deposited more money into my second account and I blew my second account and I deposited more money into my third account and just went on and on like this and I just you know just keep on
losing every single sent that I have in my bank account and I just don't want that to happen to you guys right it's a a very like depressing state where you have $100 in your bank account and lose the $100 and then you have to wait until next month uh then you get your monthly allowance from your parents which is another $100 and then you lose it again and again and again and again again it's absolutely the worst feeling ever and I don't wish it on my worst enemy and yeah just just don't guys just
don't right just practice this Rule and you'll be fine when it comes to risk Capital now the next concept I want to talk about is actually what we call the risk per trade right risk trade is basically how much money that you are willing to risk on each trade how much money are you willing to lose on every single trade to show you an example of how all this risk but trade stuff works let me just draw it up for you guys to see let's say got a chart right here right go away Meo and
then um let's say price is at you know consolidating right here and it's at this support level right here right there's a support level right here now at this point of time you end up for a buy somewhere right around here okay you end up for a buy right here and you probably have like your stop loss down here below this support level here and take profit could be all the way up at the next you know key level of Fibonacci extension level so all the way up here so this is your stop loss and
this is your take profit in this case your risk for trade is basically the amount of money that you will lose if price goes down and hit your stop loss okay so if your risk but trade is let's say $10 right you need to make sure that the lot size that you're using right here for this buy position for this long position correlates to this $10 so if you hit your stop loss the maximum amount of money you will be losing is only $10 right it's only $10 and then in this case let's say that
we have a 1 is to three Re to ratio right which means that if you lose you are losing like 1% of your Capital which is $10 right and then if you actually win this trade and price goes up there hit us take profit you'll win about $30 one is the three right risking 1% to make 10% risking $10 to make $30 in this case this is your risk but trade where you are thinking about how much money that you are risking on each trade and how much money you will lose if price do not
go as planned uh that is basically the whole concept of risk for trade and the reason why risk for trade is so important is because if your risk for trade is way too big you will blow your account and you will lose a lot of money and you will never become profitable as scary as that sounds but that is the truth let me just like you know sketch it out for you guys to see so let's say you have $100 in your bank account I mean not your bank account your live trading account and you
RIS about 10% on each trade so risking about 10% on each trade means what you are risking $10 on each trade okay $10 on each trade everything is good and stuff so you actually start off with $100 and then let's say you lose your first trade and then you lose 10% so now your $100 has just cut off down to $90 okay $90 $90 and then you lose another trade and now you cut down to $80 right cut down to $80 $10 $10 and actually wait no doesn't work this way if you are sticking to
the 10% rule and you lose your first trade right let's say you lose your first trade you lose $10 okay you lose $10 so the original balance was $100 and you lose your first trade 10% is $10 and then now you adjust this 10% to this new account balance which is $90 and 10% of $90 is what uh $9 okay so you lose another $9 so in that case your down to $81 and this just keep on going and going and going where you are losing $8.1 and just slowly you watch your account what is
this $8.1 $81 uh I can do math I want it Tre oh my God my mind literally can't thing it's been so long since I do math bro 1 7 uh 7 no no no no s oh three $ 73.1 oh my God it took me so long to do this basic meth God damn it uh yeah $3.1 and you can see right if you look like let's say 10 trades in a row right you probably be down to $0 or something like that right 11 trades or 12 trades in a row and you'll be
down to0 that is why RIS for trade is so goddamn important right you need to make sure that you know you have much more room for for error right you need to make sure that you have room for error so that even if you lose multiple traes in a row even if you encounter a losing streak which is so goddamn common you will still have money that you can trade with right the last thing you should be doing is this this is a negative scenario this is a very bad example now let me show another
example where same scenario right here you are you lost let's say you lost 10 trades right you lost uh 10 trades in a row right so another scenario right here where we instead of risking 10% per trade we are risking only 1% per trade so every time you lose $100 you are losing what $1 right $1 in this case you lost 10 trades after you lost 10 trades you will be down $10 or something that around $10 and in this case right guess what both guys both Trader a and Trader B they both lost 10
trades in a row but Trader a have $990 left in that his account to trade while Trader B has zero goddamn dollars in his account so in this example I literally have shown you guys how important R but trade is if you practice proper RIS but trade you will have enough money to trade with our goal as Traders is not to look at the upside it's never to look at the upside and how much money that we can make it's always to look at the downside which is how much money we can lose if you
trade with this mindset you will become profitable if you stop focusing on the money and how much money you can potentially make right and actually start thinking about oh if this trade does not go as planned how much money will I lose if you genuinely start trading in with this mindset right you will start to you know take trades with much more caution and instead of taking those impulse trades where you know you get in and use a position size that is way too big for your account because you are a bit greedy and you
want to see how much money can make on this trade oh if I make this one trade and and I win this trade I I'll make like $11,000 in my bank account that shouldn't be the mindset when it comes to trading so what is the general rules for RIS for trade did I even mention about the general rule about RIS for trade I hope so right basically the general rule about risk but trade is to risk about oops not this pen is to risk about 2% to 3% of your total Capital 1% to 3% actually
the minimum can be 1% to 3% right the reason why we choose this RIS but trade is because it's not too low and it's also not too big and it's just nice it's a very sweet spot where if you reach 2% on each tra you have you can lose like 50 trades in a row they you blow your account if you use 3% you can lose like 30 trades in a row before blowing your account you can see you can have so much more room for error where you can lose a lot more money and
you'll still be good right still be good if you have a proper risk to re ratio which is the next thing we are going to discuss but for now just understand this right if you can lose less and make more then obviously you're going to become profitable right this is common sense but why are 90% of Traders not profitable even though it's a common sense thing to do that you need to win more money then you lose it's because of this thing right here it's because of this thing right here we don't practice proper risk
management this 90% of traders that lose don't practice proper risk management so stick to this rule 2% to 3% so if you have $1,000 in your account you should only be risking $20 on on each trade right if you and $20 $30 on each trade so R 2% 3% of your total Capital your risk capital and you'll be good so in this lesson we're going to talk about risk to reward ratio and the thing about risk to reward ratio is basically how much you are risking and how much you getting back in return is this
ratio right here so if your risk to reward ratio is 1 is to three that means you are risking 1% to make back 3% right so you if you lose this trade you'll lose 1% if you win this trade you will win 3% for your total Capital right so that is basically the prime of RIS to ratio and the rule is that we never ever want to trade with a risk to reward ratio of one is to one or less right never never ever trade with a one to one R to ro ratio just think
about how stupid that is you enter for a sell here okay actually let's just use this example use this chart right you enter for a let's say you enter for sell right here your stop loss right here above this and your take profit right here in this case one is the one risk to draw ratio you risk probably about $10 on this trade because your account only have like what $100 or something I no uh $11,000 so you use 1% on this trade $10 and you make back another $10 right here in in that case
that is absolutely stupid because why would you take the trade to make back something that is equivalent to your risk you always want to make sure that your reward is bigger than your risk right that's literally the least you can do and that is how you can really become profitable if you can stick to this risk to draw ratio and that is why the minimum risk to draw ratio I would advise you guys to look for is 1 is to three right 1 is to three that means in that case you are risking 1% right
here to make back 3% can see Rising 1% to make 3% and it give you a one to three risk grow ratio so in this case if you reach $10 here you lose you lose $10 but if you win you win $30 so that should be the minimum right that should be the criteria the standard when it comes to R draw ratio uh for me I like one to three but for you you might be going with one is to two and the thing about really to ratio it kind of depends on your win rate
if your trading strategy have a higher win rate of like let's say 80% then in that case you can have a lower risk to drop ratio and if you have a minimum of one is to two that means you need to have a higher win rate now so that means you have your strategy must win more trades if that makes sense so let's just quickly go through RIS to raal and why so gotam important so let's say I enter for a buy right here right maybe I enter for a buy right here I saw there
was some sort of support area here right support area right here and then I went down to the smaller time frames right here let's say I go down the smaller time frame and then I end up for a buy right here at this support area let's just be I'm a retail Trader so I ENT up for this buy position right here at this support area right here and then my take profit was all the way up at this resistance area right here you can see there's a little resistance area right here so I place my
take profit all the way up here in this case this is a stop loss below this support level right here in this case this is like about a one is to four reach Dr Ra so if I win this trade I win 4% if I lose this trade I only lose about 1% so let's just assume that our account balance have $1,000 in our account and then we are risking 1% I mean no we are risking 2% right our risk trade is 2% the standard 2% per trade and in this case the risk to RW
ratio is 1 is to three in this case right here you're risking 2% per trade and one here means one unit right so in this case you are actually risking 2% to make back six 6% right one is to three risk to R ratio guys so this is a 2% risk and this is a 6% reward right very very simple concept so far so good right we are risking 2% right here to make back 6% so if I lose this trade right God forbid I lose this trade I lose about $2 on this trade if
I win I'll win about 20 $60 on this trade right sounds fair right if we lose we will lose about $20 and if we win we will win about $60 on this trade in that case I'm perfectly okay right that is okay and I'll take this straight but but but but but let's say you were a little bit late you did not got this entry right here this is really like the best entry no actually the best entry be all the way down here and you can see it's like a insane one is the 50
didn't reach the ratio but let's say you didn't get the best entry instead of entering right here you actually enter a little bit late right you open the charts you just wake up and you already see price up here but still you feel the need to you know enter this trade you feel the foro so you enter right here in that case if you enter right here where should your stop loss be you should always be placing your stop loss based on the market structure right so you place it below this support area right here
right it's the same thing placing it below this support area right here and then take profit where should it be same area this resistance area right here so in this case right in this case you can see this actually like a one is to one risk to draw is and I will not take that trade I will not take this trade I'll tell myself you know the boss has already when you've already missed this opportunity it's already too late you should not be entering for this trade now now in that case what or rather like
what's the proper to R ratio d four like I said 1 is to three 1 is to three the minimum the minimum is 1 is to two right that's the minimum less than that just absolutely no goal right so another example let's say I actually managed to you know enter on this pullback right here so enter for short position right here somewhere right around here place my stop loss above this uh resistance area right here and take profit all the way down at this area right here and actually maybe I enter like somewhere right around
here I entered somewhere right around here where there was a one is to two ratio in that case when I say A for one is to three right that is somewhat like the scenario where is perfect right one is three higher than one is three is perfect right that means you're risking a very small amount of money to make a lot of money one is 10 that is absolutely best right the higher the better but let's say we saw this opportunity right here maybe right here we saw all the confluences in the world lineup right
you can see the light bub in your hit lighting up telling you should enter for this trade because you have all the confluences in the world oh oh you have this Candlestick pattern price at this Zone other block here and then Supply demand here Fibonacci here you got all the confluences all the signal from the market telling you that you should enter for this trade right so this is a trade that can be very confident on but I don't have a risk to draw ratio of one is the three I only have one is do
right here the question becomes will I still take this trade right I get this question a lot will you still take this trade if it's less than your R to R ratio but it's a very high for this trade setup right it's a setup where you know there's a very high chance that price will go in that way in that case yes I will do it but if sem exact scenario you have all the Confluence s in the world and you have all the signals telling you that you should end up for this trade but
instead of one is to two it's actually one is to one I still take next trade the answer is no right answer is no so that is basically the concept I want to drill into you guys for re to ratio is to make sure you aim for one is to three right at least one is to three that is a very good range right that means you can you know lose three trades in a row and you just need to win one guess what you will end off as break even right you will end off
a break even and it's very common to lose three trades in a row so you just need to win one and you break even how beautiful is that that is why you guys need to have a proper R to R ra because if you lose if you have want to One reach thr ratio once again right you lose one trade and then you lose another trade and then you lose another trade now in this case right you need to win back three trades in order to break even you can see it's a little bit different
now right just now you can literally lose three trades in a row win one and you break even now you lose three trades in a row once again but you need to win three trades in order to break even it becomes much more harder to grow your account right now because you are not focused on preserving your Capital so take into account this RIS ratio follow this strictly and you will have a much more higher chance of becoming profitable maximum account exposure quite simply put it's basically your draw down right it's basically a draw down
you know how when you end enter a trade right let's say once again this is a chart right here and let's say you enter for a buy position at this support level right here right you end up for buy right here end up for buy right here and price actually end up going against you for a little bit right going against you a little bit and you will start to see your account balance negative $10 negative $20 you can see the the loss starts to get bigger and bigger right and that's the floating loss right
the floating loss where is basically what we call the draw down it's not realized yet it's not close yet if you close the trade at $20 then that is realized then that is your close loss your realized loss but in that case if it's floating like this in your account balance you can see on your meta Trader for at the top right is showing you red color negative this amount that is what we call the draw down in this case what should your maximum account exposure be limited to what's the max amount of money that
you should be allowed inside your draw down 5% generally 5% that is my rule so let's say you stick to the rule of risking 2% on each trade in order to get a Max draw down of 5% at all times right you should only be having like two three trades open that is risking 2% right 2% let's say you have three trades right three trades and all of which is risking 2% in that case your draw down the maximum is 6% right the maximum is 6% where you actually all your trades hit stop loss and
you lose 6% but in that case the draw down should only be 5% like the maximum if it's a little bit confusing for you guys let me simplify even further right basically draw down right here just remember the maximum is 5% right that's the maximum and in that case if you know that you're going to risk 2% on each trade you shouldn't have more than two trades open inside your account right you shouldn't have more than two trades open inside account so what that means is that 2% let's say I open one trade on a
long position risking 2% on this trade okay this exact trade right here and I bought in for gpusd right gpusd so this is my first trade this is my first trade right here then my second trade I saw an opportunity for me to scale in for this position right I I start seeing price revers right now actually no it reverse right actually price is continue going down but I'm still so confident that you know what price is going to go up and right now price is at a discount right price is cheap so buy those
sell high right so I should enter for another buy so this was my first buy position and I ENT up for another buy right here but price just keeps going down keeps going down and at a point of time you on the second trade you risk another 2 I'm trying to find a way to articulate my thoughts properly and I'm trying my best here guys but I find another way to you know risk another 2% on this trade right here so in total we are risking 4% right here total 4% on this gpp USD trade
so the worst case scenario is that if we r or rather lose both trades we will be down 4% that's the worst case scenario but right now price just going against us he haven't hit our stop loss because my stop loss could be like right here it haven't hit our stop loss yet it's just going against us right now and started retracing a little bit and then go down even further like this right in that case my account is in draw down right now right my account is in draw down right now and it could
be - 3.5% or what right now whatever it is the draw down is the floating loss right we don't know why it is because we don't know the exact price but this is the floating loss and it's not realized yet until price hits your stop loss this is just floating loss right until price hits your stop loss or you close the position then the loss will be realized which is -4% so when I say that your maximum draw down your maximum account exposure should not exceed more than 5% what I mean by that is that
the amount of open positions that you have right and you add up all the draw down if the trade does not go as planned add up all the draw down it should not be more than 5% right it should not be more than 5% so if you use the 2% rule at any point of time you should have no more than two open positions at once right so stick to this rule if your maximum account exposure is 5% and you're Rising 2% on each trade at no point of time you should have more than two
positions that is open at once right so if you enter for the first trade and you do decide to scale in for another trade right here so you have another trade right here you have two trades running to your take profit or stop loss or whatever right now right you shouldn't open a third trade you should limit yourself to those two trades you need to practice self-control and limit yourself to two trades just so that you can stick to this maximum account exposure right here so next I'm going to talk about position sizing so when
it comes to position sizing that is actually three factors that you guys need to take into account of right and the prise is basically a lot of you guys don't know what's the correct lot size to use for your trades right and it's very important because if you use a lot size that is way too big for your account you will ruin your account if you use a lot size that is way too small for your account you will not grow your account and I always say that you need to use the correct position size
because if you can do that then you have an ideal scenario where you can have uh what I call a big win right your big win let me tell you something your trade should always always only end up in four ways I mean three ways wait four ways okay no your trade will end up in four ways Big Win small win small loss but it should never ever be a big loss and we do that by adjusting our position size right so that we can get a big win and also we can get a small
loss right so once again comes down to three factors right here so to answer the question what is the the correct lot size that you should be using on each trade you need to take into account these three factors here let's go through one by one so we know that risk capital is basically how much money you have inside your account balance right it could be $1,000 or $500 or $10,000 how much money you have inside your trading account that is your risk Capital next we talk about how risk per trade we should risk about
2% to 3% per trade for this scenario here let's just stick to 2% right stick to 2% that's my standard now the stop loss distance this is something that is a little bit tricky because we don't have like a fixed predetermined number of Pips for our stop loss and that is another point I want to say you should never ever want to go into trading with the mindset that you know what you always want to make sure that you get the tightest stop loss and have like a five pip stop loss every single time that
is extremely unrealistic and that is extremely stupid and a very dumb way to trade if you go into this mindset where every single trade that you take need to have a five pip stop loss right you will end up taking very bad trades trades that are not really profitable that is why you need to place a stop loss based on Market structure and place it at a level where it will invalidate the setup if it is wrong right if the trade setup is wrong you invalidate the setup so we know that in uptrend right price
creating higher highs and higher lows right you placing your stop loss at all these higher lows right here a few Pips below this high lows and if you are trading sub of order blocks or supply and demand or support and resistance right and you actually let's say buy at this demand area right here right this key level here stop loss will be below this key level and same thing over here that we have right here if you sell at the resistance right here your stop loss should be above this resistance right so that is your
stop loss distance and by the way this works for supply and demand order block support resistance whatever that involve like key levels or zones that institutions are entering for the trade P your stop above or below that zone depending on whether buy or sell and then Bas it like a few Pips above below it right if you don't understand where to place a stop loss then you should go watch the videos where I talk about trading strategies and actually like trading this is a risk management cost so I'm not going to dive into where to
place your stop loss but if you still don't have a clear understanding of that go watch the trading videos so pois sizing in order to choose the correct lot size you need to take into account these three things and a stop loss distance and it could be like a certain amount of Pips like 30 Pips or even 50 Pips right depending on how white is your stop loss and what type of trading style you are maybe you are scoper scoper will probably have like a five pip stop loss like a r tight stop loss but
then uh in tray Trader or swing Trader might have a 30 pip stop loss which is much more wider right so now before you enter for the trade I want you to do this one thing to this determine what lock size you should use and that is to go and calculate what is the correct verion size you should be using let me give you an example so let's just go to the charts and I can just give you let's say we buy at this support era right here right and then we aim for this little
area that we have right here this resistance zone right here and place our stop loss below this support area right here now before you enter for this trade right there is two criteria that must be met or what two things that you must do the first thing is to you know do this forecast where you place your stop loss and rep place your take profit to see your risk to R ratio if it's more than two then by all means go ahead and take that trade if it's less than two do not take that trade
second thing you need to do after you do this is to go and calculate what position size you should be using so in this scenario right here let's have an example where once again we have $1,000 in our account right $1,000 in our account and then we are risking 2% right 2% risk and that give us $20 that means we are risking $20 on each trade right the 2% risk per trade now in that case our stop loss distance here is 11.6 Pips right 11 Pips stop loss so I'm just going to put 11 Pips
stop loss we actually should run up right always make sure you run up so 11.6 you can run or you can just put in the exact number but I like to like round up so that it's like a nice whole number so 12 pip stop loss and this will be you know yeah a stop loss distance the stop Bloss is 12 Pips so these are the three information that you need to input inside your position size calculator and that is where you'll find what lock size you should be using so if you just go to
Google and search position size calculator right and I recommend you guys to use the first one right here this is actually the one that I use by my FX book so you click on right here and it will come to this page right here and like I said just now the reason why I ask you to input this information right here is because you need this information so that you can actually determine what's the correct lot size you should be using so let's just input it account balance is $1,000 account size is $1,000 so that's
1,000 and also make sure you choose the currency pad that you're trading in that case you are trading aod USD right and then this account currency is basically the currency that your account is on is it on USD aod USD or what no but default should be US dollar and the risk to R rual this is not your risk to R rual this is your risk per trade percentage so if you are risking 2% on each trade your risk per trade is 2% then here just put two as simp as that just put two if
you're risking 3% but trade then put three as simple as that so in this case we are risking 2% but trade and what's the stop loss that we have right here we have a 12 pip stop loss right you can see this is a 12 pip stop loss and when we made sure that we play it at a level where you know if the trade does not go as plann and it actually goes down here we minimize my our loss at a price where it would actually invalidate this setup right because if price actually reverse
and go back down right this shows us that you know what maybe price will break through this support AA and you know it's not going to go up anymore right it's not going to respect this support AA anymore so this was a trade that is going to be lost anyways so Char stop loss and just put it in right here press calculate and there you have it as simple as that this is the lock size that you should be using so at this point of time after I get this figure here I will go on
to my position size calculator and just type in 0.17 and then I'll place the buy order and ladies and gentlemen that is how you calculate the correct lot size per trade let me give you guys another example in case you guys don't understand maybe let's just go to USD JPY right a pair so in this case right let's say you enter for a buy right here at this higher low right here and see where's the buy two right here and I place my stop loss below this last high low right here and take profit all
the way up at this resistance area that we have right here right here yep so in this case you can see this like almost one is two risk raal and in this case let's have another example where maybe we are risking our I mean our account balance is $5,000 and our risk for trade is about 3% let's say this time we risk 3% on each trade and this case our stop L resistance is what 33 Pips you can see right here 33 Pips so stop loss is 33 Pips now this is literally all the information
you need once you get all this information just go to position size calculator and choose the currency pair which in this case is USD JPY and then account size is $5,000 this time and the risk ratio is 3% right just 3% right here and then the stop loss is 33 Pips and just press the calculate 0.68 this is the lot size you should be using for this trade right here so we go on to metat Trader 4 and actually input the lot size as 0.68 as simple as that as simple as that right by doing
this you are able to ensure that you use the correct glock size while respecting your RIS per trade and I kind of emphasize how important this is like it is absolutely essential that you make sure you do this you do this before you take the trade no matter how like you know how good the trading opportunity is you you should not be the case where you enter like let's say on this trade you enter a one lot size right because you saw this impulse move and you start feeling this fear of missing out and you
immediately go on to your meta Trader for press USD JPY enter for a buy and you don't know what lot size to use but you just you know just say okay you know what this is a confirm win one you confirm a win this trade one so I'm going to enter a big lot size one lot size and boom end up for a trade that is the wrong way to trade you need to do this thing before you take the trade right calculate the correct position size first and then enter for the trade if you
can do this I can guarantee you that you will be profitable if you can practice or rather apply everything that I'm talking about in this risk management framework this risk mitigation framework cost and you actually apply it I can guarantee you that you will become profitable all right so before you do anything before you take that trade make sure you go to this P size calculator and just input the information so that they can just do the job and you can see it's so easy right just one button and this probably will take you only
about like what 10 second or even 15 seconds okay less than one minute all right it takes you less than 1 minute to save few hundreds of dollars even thousands of dollars so do it and just don't trade based on impulse all right trade based on rational logicality logical just trade based on rational and logical and just use this calculator here now let's talk about how leverage works next so firstly what is leverage basically let's say you have $1,000 in your account and then when you sign up for a live account or a demo account
even right the broker will allow you to choose what is your preferred leverage right there's usually options ranging from one is to 20 one is to 50 and then there's even one is to 100 right basically the broker will allow you to choose which leverage do you want now let's say you choose one is to 100 that's the leverage they choose and remember you have $1,000 in your account so if you have a leverage of 100 that means 100 time $1,000 and this means that you have a buying or selling power of $100,000 right so
essentially this Leverage is acting as somewhat of like a borrow capital that allows you to make more money by trading with a bigger account size or rather like a bigger lot size that's what I mean and it's a double H sword right Leverage is a Double H sword it can increase your wins it can also increase your loss right it's a double sort that is why you want to make sure that when you are choosing what is the correct leverage to use or rather what leverage that you want to use is not way too high
it's not too ridiculous right and my honest opin opinion would be to just stick with 1 is to 50 and not go any higher than one is to 100 right one is 100 is the max right because if you go up to more than one is to 100 where you even go to like one is to 500 one is to 1,000 right first of all those Brokers that offer such high leverage are most slightly unregulated which means they are not safe they're not licensed and they might run away with hot money second of all is
way too much right in that case you are already overleveraging you are already you know risking too much of your Capital right and let's say in this case you decide to go with a one to 100 leverage and you have a buying or selling power of 100K what this means is that you can trade up to a standard lot size which is a 0 point I mean which is a 1.0 lot size right you can trade up to a standard lot size that means every time price move by one pip guess what you are making
$10 per pip right $10 per pip but without leverage let's say you take leverage away and you only have $1,000 and it means you can only trade with $1,000 right so you have $1,000 you can trade with $1,000 in that case do you think you you will still be able to use this 1.0 standard lot size no because you need 100K inside your account in order to trade one standard lot size in this case you can probably only trade like the smallest lot size possible which is the 0.01 lot size you can't even trade a
mini lot you can only trade the smallest lot size which is 0.01 lot size where you are making literally pennies right you are making literally pennies 10 cents per Pip this just shows you the power of Leverage with leverage you are able to trade with bigger lot size right that means that you can have a very small amount of money inside your account and trade with lot size that is bigger than usual because of Leverage that means you're able to raise more money than usual and you can make more money than usual but bear in
mind like I said it's dou sword right if you want to win more money that also means that you there's a chance that you're going to lose more money so the thing about Leverage is that honestly all of this stuff would matter if you follow your risk management plan if you strictly follow your risk management plan then you won't be you know going overboard with leverage you won't over leverage so let's say stick to a one is to 100 leverage and you have a 100K account right if you're calculating a risk for trade it should
not be based on this amount here right that means that if you are trading with this like this account right here you have1 $11,000 and you deposit into this broker which offer you one is to 100 leverage that means you can trade up to 100K right you should not let me repeat myself you should not be calculating your risk but trade based on this amount here your risk per trade should be based on this amount right here which is what you have inside your account because just I talk about how risk per trade is a
percentage of your risk capital in this case this is your risk Capital right here right this is your risk capital and this is just imaginary all right just imagine this is like a imaginary risk Capital plus borrow capital from the broker so 2% risk for trade would still be your $20 right it will still be $20 on this trade so leverage doesn't really change your risk management plan it just amplifies it and give you the ability to trade with more money so they can grow that small account FAS right and actually sustain in the game
now the next thing I want to discuss which could be quite useful for you guys is actually stops and limit orders right this is just an additional thing that you guys can or rather you want to know then just just go ahead but if you don't then just continue entering into trades manually like pressing the buy or sell button manually but if you want to find a way where it's like automated that means that if price reach a certain level your broker will automatically get you in to De position either for a buy or a
sell depending on what limit or what stop order that you use so that is basically four ways where you can automate this process and that is through buy stop sell stop buy limits and sell limits let's go through one by one so buy stop is where you place a buy order above the current market price so let me just maybe draw some example for you right let's right here so let's say price is creating an uptrend right price creating an uptrend and you want to place a buy stop order right here when price break through
this High area so you place a buy stop right here so right now price is going up and you won't be in the position all right you can maybe be at a gym or spending time with your family and you're not looking at the charts so never mind go do that because you already buy place a buy stop order right here so if price reaches this area your broker will automatically get you into a buy position and that is what price did right here okay so right now you're inside the buy position right here and
this is what we call a buy stop right this is what we call a buy stop but in this case what if we don't want to trade the breakout of this high right we want to trade the pullback right oops so in that case I want to wait for price to pull back to maybe like right here somewhere right around here and then that is where I will enter for a buy verion right here in that case you can't be using buy stop because buy stop is an order that is placed up above where currently
the market is at but right now you on the enter at below where price below where the market is currently at so in that case you won't use a buy stop you will use a buy limit right it's basically an order plac below the current market price so this is below the current market price so it place a buy limit right here so once again price will come back down here your broker will get you into a buy position right here at this low point and yep just continue to watch your profits Skyrocket now on
the other hand let's just switch to maybe a downtrend right maybe don't have a downtrend let's just use another example of just a consolidation so there's a resistance area right here there's a support area right here or what way you want to call Supply zone or demand Zone all right so let's say price comes down to this area right here and it's showing a lot of selling momentum a lot of liquidity right a lot of liquidity price is just crashing down a lot and it's coming down to this area right here and you are predicting
that price is going to pierce past this demand zone right it's not going to respect this area right here and just going to crash and just Pierce past it in that case what you want to do is to place a sell stop which is an order placed below the current market price right so this is the current market price and this is where you want to enter so it's actually below the current market price so it plays a sell stop right here once again once price hits this area here broker will automatically get into a
sell position and yep that is how it works but in that case let's say price decid to reverse at this area here right reverse CR High highs high low high highs and you actually want to enter for a sell order at this Supply Zone because you know that there's a lot of sellers waiting at this Supply Zone a lot of liquidity to be grabbed right here right and you know for a fact that this is a very strong uh Supply Zone and price will respect it and reverse at this a will so so in that
case you'll place a sell limit right because this is the order and it's placed above where the current market price is which is right here so price will go up here smash your sell limit right here activated and that is when you enter for sell position so this buy stop sell stop sell limit buy limit can be very useful especially if you are trading order blocks right or supply and demand zones where you know you want to enter for the trade immediately when price touches that area right immediately when price comes back to touch this
order block are you want to enter for a buy order right here right and in that case which one will you choose will you choose a buy stop or buy limit obviously you're going to choose a buy limit because you want to wait for price to come back down here touches this area right and this order is below where the current market price is so yep use this if you want and I believe that this will be a very like useful tool where can save a a lot of time so what you see on the
screen right now is basically how price actually move on a fundamental level and I know it might looks very complex and confusing right now but don't worry I'm going to go through step by step and dissect this entire chart diagram for you so first of all price in uptrend in a bullish orderflow price will go up right and reach some sort of unmedicated Supply zone right which you can find on the higher time frame and then you will start pulling back right once you start pulling back more demand step back into the market to push
price up even further and eventually what happens next you are just anticipating or rather waiting for price to start pulling back again so when price actually break above the last swing high now creating your bullish break of structure we can expect price to start pulling back right so when price does that you know eventually come up to some sort of unmedicated Supply Zone once again you look towards your left you identify any sort of point of Interest Supply zone auto block or flip Zone whatever and then your job is to just anticipate a pullback to
happen at that point of Interest so that is what it did right here so once price start pulling back what you can do is to narrow your focus to a certain part of price so that you don't confuse yourself right so you basically do that by actually marking up your strong low and also your weak high right here which is the highest point before price starts pulling back and I almost forgot to mention but for this strategy we are only going to be using three time frames right we're going to focus on three main time
frame our higher time frame medium time frame and lower time frame the higher time frame the daily time frame we're going to use it to actually identify the swing structure to find out whether price is actually bullish or bearish whether price is in the continuation phase or the pullback phase and then also identify the swing structure like what we have done here right and we are also going to use it to mark up any sort of unmitigated Supply or demand zones so that's the purpose of the higher time frame is to allow you to build
a narrative and actually allow you to understand what's going on with the market right now and then for the medium time frame we're going to use the 4H hour or the 1 hour time frame and this is where you can identify the internal structure right what is price doing within this swing range itself and then you can also Mark up any sort of medium time frame point of interest and then lower time frame 15minute time frame or the 5 minute time frame these are the time frame that we are actually going to be executing our
trade on right so these are the time frame that you want to look for your entry models price is going to turn bearish for a short amount of time to facilitate the pullback of the higher time frame Trend the higher time frame order flow so that is when price start turning bearish in the internal structure creating a lower high you know lower low lower high lower low like I said it's just facilitating the pullback that is why price is going to turn bearish and then eventually price pulls back pulls back and it pulls back all
the way down to where your demand Zone that is Created from the strong low right so this is when price actually pivoted right and created your last higher low so at this this last high low that's going to be demand that's going to be buyers waiting for this at this a to actually push price up so that is when price get to this demand zone right this higher time frame demand Zone and at this strong low that is when we know that this pullback could potentially end soon and that is when we know that price
is going to turn bullish again right shift of structural shift of order flow flip from Supply to demand and right now the internal structure is aligned with the external structure the swing structure and yeah basically it's bulling right right now internal structure is bullish external structure or swing structure is bullish and right now you can look for price to actually create that higher high and higher low and most likely you can see price come up to our weak high that we have right here and then eventually it could break above this week high creating your
higher highs and higher low break of structure when that actually happens this whole cycle repeat itself right so this is just how price actually works on a fundamental level I did not create this this is just how price actually is when you look at a chart right the main thing you want to ask yourself is who is in control of price whether the supply or the demand in this case right here where price is actually creating That Swing structure demand is in control right price is bullish demand is in control and price is just creating
this bullish breakout structure but the minute price starts pulling back right like I said it's going to turn bearish for a short amount of time to facilitate that pullback that is when Supply take control of the market and eventually price get to some sort of demand zone right here and then demand step back into the market and Take Over Control of price and that is when price start turning bullish again to be aligned with the higher time frame outlow so yeah this is a question that you want to ask yourself at all times who is
in control of price because if you can answer that question you can be on the right side of the market and you can actually win rather than lose your hearten money and now that you have a broad overview of how price actually work your next question is okay Brett cool now when exactly do we enter on how do we actually trade this do we enter for a sell right here doing the pullback or do we enter for a buy or say right here at these lows or do we enter for a buy here or do
we enter for a sell here right where exactly can we actually trade from that is when we move on to the next part of this lesson which is your Market phases right you need to understand which phase of the market is it in right now and then deploy your trading strategy accordingly right this means different Market phases you must be doing different thing and this is the main thing that so many Traders get it wrong right a lot of Traders what they do is that they try to buy at all these weak lows right here
right they try to buy at all these we low right here right which doesn't make sense whatsoever because price is still bearish and it's still pulling back so if you enter for a buy right here you are going against the internal structure the internal range and then some people they try to enter for a sell right here where price has already done bullish that is it's already aligned with the higher time frame out flow and you're still trying to go against the trend right go against the internal Trend and the swing Trend which just doesn't
make sense whatsoever so yeah now I'm just going to explain to you how this different Market phases actually work and I mainly split it into four phases right so let's go through one by one so firstly we have the pro swing plus pro internal phas right and you can see the color of the face it's correlated to the color of the boxes so you can just match the face of the market to the color of the box right so first phase is the pro swing plus pro internal phase what this means is that the swing
structure the trend the orderflow is the same as the internal structure internal order flow right so this phase happens when price has finished pulling back right it has finish pulling back and then right now is continuing with the higher time frame a the flow right so in this case your object is very simple it's just to write the higher time frame Trend and Order flow right this means you can look for buy at all these demand zones right here demand Zone demand Zone and then after you have entered for buy at these demand zones at
these higher lows right you can Target this weak swing highs because this is where price is most likely going to gravitate towards and it's going to end up breaking past it and create another higher high and higher low right so this is one part of it another part of it is if you look towards your left after price actually create that break of structure right before price starts pulling back you can also look for some buying opportunity right here doing this push phase now doing this push phase obviously price will not just go up in
a straight line like this you'll most likely do something like this go up go up go then come out to our supply Zone and start pulling back so within this push phase with this minor correction this minor little pullback right you can actually look for a buy position right but be in mind like I said it's a very different setup if you are at entering for this buy position compared to this buy position because this is fresh right this is just fresh out of Oven price has just finished pulling back and right now price is
turning bullish to facilitate the higher time frame out the flow but over here after price created that breakout structure it's most likely going to start pulling back soon so if you enter for a buy right here bear in mind that you have to be fast in terms of taking profit right you have to get in and get out of fast because you never ever know when price will start pulling back when the high time frame order flow will come up to some sort of unmitigated Supply Zone and start pulling back so be careful and like
I said last thing is this area right this phase of the market this is where you are able to get the most highest probability trade setups because this are the phases where the internal structure right the lower time frame trend is bullish the medium time frame trend is bullish the higher time frame Trend higher time frame order flow is also bullish so you can see everything just align itself like clock work baby so this is really when you can be more confident in terms of the traits that you are taking Within These phases so the
next phase is the counter swing plus counter internal phase this phase is a little bit trigger because this is where we are going against the higher time frame autoflow and the lower time frame autoflow and a medium time frame autoflow right we are going against the trend we are going against the current of the wave in the ocean right but this is also where you are able to capture those high risk to reward ratio trade setups right you can enter for a sell here and then you can Target all the way down here at this
demand Zone but the difficulty comes when you are trying to predict the top of the market because it's very very difficult for you to actually predict the top of the market right you never ever know when price will start pushing even higher before it starts pulling back right Ure this higher time frame point of Interest give you the extra Confluence but there's always a chance that it's going to pierce past it before it starts pulling back so this is where you want to look for reversal setups all right so ideally like I said after price
created a break of structure we are anticipating price to start pulling back okay so knowing that where's price going to pull back it's going to pull back at some sort of unmitigated Supply zone so the minute price actually reach that unmitigated Supply Zone I wouldn't actually recommend you to actually enter for a sell immediately because like I said price can always just Pierce pass it so what you can do in this case is to wait for your Market shift to happen to wait for that shift of structure to confirm to you that price is turning
bearish to facilitate that pullback right and you will only get that after price create that market shift right it give you the extra confirmation so I wouldn't recommend you to actually enter for a sell here immediately once again you can do whatever you want right if you want to get that sniper entry you can actually enter here immediately but like I said always wait for the extra Confluence and please don't enter immediately if you are a beginner who is not consistently profitable yet whatsoever now when price create Market shift give up that shift of structure
we have a confirmation that price has officially turned bearish now that price turned bearish when price actually created this Market shift what happened there was a demand zone right here price comes down to this demand Zone created a fi reaction right here now when he created this fi reaction right it created a flip Zone that we have right here right so if this demand Zone were to do is job price were just going to go up even higher but no it created a field reaction created a lower high right here giving us our demand to
supply flip zone now we got demand to supply flip zone right there so that is when we can move on to phase three phase three is when you want to look for short-term selling opportunity to write the pullback because right now we know that price is turning bearish to facilitate that pullback so we can actually capitalize on this fact and actually look for sell position at all these highs right here all these lower highs being formed right here so your job your objective for this phase is to just play that pullback right or like I
said if the higher time frame permits this can even be a reversal right this can even be a reversal and price could just go down and crash all the way down and just breaking past the strong low if not then price is most likely going to pull back to the demand Zone that is at the strong low where demand will step back into the market and push price up again so within this phase like I said you are looking for quick trades very very fast trade get in and out fast right so short-term selling opportunity
you can sell here at this flip Zone and then price goes down create another lower high or flip Zone whatever you can look for another sell position here and bear in mind this is very very important when you actually put on your premium and discount Matrix you realize that Above This 50% level this is where price is at premium pricing so this is where it's Optimum for you to actually enter for a sell if you are trading the pullback and then once price actually get into the discount Zone it's a whole different story because this
is when price could potentially start reversing and go up now right because price is within the disc range and this is where there's going to be some sort of Demand right so bear in mind that is a very different story to actually sell here compared to selling say right here right because right here price has already created a market shift price has already done bullish the internal structure is already bullish so it doesn't make sense for you to actually enter for a sell right here where the internal structure and the swing structure is both bullish
right so bear in mind when it comes to this be careful okay look for short-term selling opportunity like I said short shortterm keyword here is shortterm if you want to enter for a sell here take profit at this low right here enter for a sell here take profit at this low right in and out and then last but not least my favorite phase to trade is the pro swing plus counter internal phase this is where you are able to get those high risk to drop ratio traits and is actually high probability compared to this one
which is low probability right because this is when you got that swing structure which is bullish the in structure is bearish but then it is Shifting to bullish so this is basically the start of this continuation phase so if you're able to get in right here for a buy guess what you can capitalize on such a huge move right here because price is most likely going to go up to the weak high that we have right here so this is where you are anticipating the end of the Swing pullback right so this is price pulling
back okay price is pulling back and it's going to pull back to where like I said some sort of demand Zone at the last strong low right so the Mini price actually get here to this Zone this is when you can actually look for that reversal right your reversal setups and how you do that is to wait for once again your Market shift to give you a confirmation there's a shift of structure this pullback is done the BS are out demand has officially stepped back into the market and take control and then price is going
to turn bullish and then personally until after that market shift happens get some sort of liquidity sweep and then I just wait for price to get to my point of Interest being created right here either a flip zone or an auto block or a extreme point of Interest bam get my entry and I trade it all the way up here right and yeah this is basically how you actually trade the markets so just to show you this strategy actually works I'm actually up like 5K using this strategy right this is just proof that I'm not
just sitting over here and just yapping to you guys about a strategy that haven't been proven whatsoever like I said this actually works right and yeah you can pretty much see that this is actually the trade that I actually entered on using this mechanical trading strategy and right now this is the result right making about 5k right now so I'm just going to explain the top process about this trade and how to actually apply this Market phases thing towards that trade right and like I said knowledge is absolutely useless if you don't apply it into
the market so let's look at the market and let's try to apply the different Market phases so first of all right the first phase is right here after price created a break of structureal you know price is bullish and this is when you can look for like I said your short-term buying opportunity because you know price is going to start pulling back soon and you don't want to get caught in the pullback so you can actually enter for a buy here right there's a demand Zone being form right here you can easily enter for a
buy here or another buy at this area here but the minute price actually get up to that unmedicated Supply Zone you shouldn't be looking for buy whatsoever so if you enter for a buy right here guess what your take profit will be at this Supply zone right right in right in and out fast and then also here as well right which I'm going to discuss later and then next price actually get up to that Supply Zone if you look towards your left right what do we have here Supply zone right Supply Zone this is where
smart money have entered in the past right there's a lot of Supply step into the market and push price down so yeah this is where phase two actually happened right Supply step back into the market take control and price started turning bearish to once again facilitate That Swing structural pullback right so over here we got that market shift happened right here after price actually broke through this last low right here right Market shift right and over here there's a little bit of fit reaction before price goes down even lower creating your lower high and lower
low right lower high lower low and then in this case you can actually drop your medium time frame Supply zone right here so if you want to enter for a sell right here that would be phase three right where you are trading counter swing and pro internal and this is when you can easily look for some selling opportunity right here and Bam if you want to enter for a sell here I would actually recommend you to take quick targets once again and where you should be targeting is at this swing low right here right so
this last swing low right right here or here or if you want to swing for the fen right what you can even do is to just Target this strong low that we have right here right this would be a very good setup as well but it won't be the most highest probability because if you look towards your left what do we have right here that is a demand zone right here so there's always a chance that price will get down to this demand zone right get down to this demand Zone and price will just continue
and going up like this right so that is why I will ask you if you are looking for short-term selling opportunity right here right you're trading phase three be conservative with your take profit and just take profit at the next low right and eventually price comes down right come back down to our strong low that we have right here and what do we have if you look towards your left this is your order block or demand zone right you can see this is actually an order block if you want to refine it to this candle
right here that will be be your aut block and over here we got a little bit of liquidity being swep as well right where there's liquidity being buil up below this lows price SW the available liquidity and bam that is where demand step back into the market and push price up so this is a very strong demand Zone this is a very valid point of Interest so we can definitely depend on it because there was inbalance there was lots of demand lots of buying momentum and price has also set available liquidity at this strong low
right so this is when we can look for face force trades right this is where you can anticipate that this pullback could potentially end and right now price is about turn bullish to be aligned with my higher time frame aut flow which is bullish so I can actually enter for a buy somewhere right around here and then this is where I will be targeting where my weak swing high right which is all the way up here right so yeah that is basically how you actually do it and then later on price goes up creating that
what do we have right here this is is actually your Market shift right this is the last lower high and over here we got that market shift happened just get rid of this got a market shift happened right here and after market shift price pulled back and if you notice what do we have here as well there's a supply zone right here okay Supply Zone and then it created a flip reaction right here so there's actually a flip zone right here right so there's actually a flip zone right here this is where you can actually
look for your entry right so first of all after price created a market shift and price starts pulling back this could be your first point of entry right somewhere around here you probably get the lower time frame Market shift you could have entered right here if not your second point of entry would have been somewhere right around here right started pulling back to some sort of little demand Zone that we have right here and this could be your second point of entry and if you miss this setup and this setup guess what you're waiting for
price to pull back and where is it going to pull back it's going to pull back to this flip Zone that haven't been mitigated yet right and that is when price come down to this flip Zone this could have been your third point of entry right and yeah that's basically how the different Market phases work and just to quickly explain the trade that I'm in right now I actually entered doing phase 4 and phase one right so this was my first setup so immediately after price actually created that market shift on the lower time frame
be in mind this was on like the 1 minute time frame right and then price come down to my swing low right my valid point of interest that swep liquidity my strong order block right so price comes down here that is when I waited for that market shift waited for liquidity to be swept right got all my Confluence then I enter for my first trade right here right so I was actually looking for my second opportunity but I didn't get any because price was just going up and there was no uh valid point of Interest
being created until price actually come up to this Supply Zone created a f reaction like I mentioned just now creating a flip Zone and Bam I was I'm just waiting for price to come back down to this flip zone right and then eventually price keep on going up keep on going up and then right now price has officially pulled back tap into that flip Zone that is where I look for my second position right so this is where I actually entered for my second trade so that is why if you look at a meta Trader
4 I have two trade in place running to my overall take profit which is all the way up here at this little aut block right here right so yeah that's basically how I actually trade now to keep things super simple we are only going to be using two time frames the higher time frame will be our 4 ler time frame and the lower time frame will be our 15 minute time frame so the first step is to build your higher time frame narrative what we are trying to do here is to really come up with
a story on what price is actually doing right now so that we can identify our trade buyers so the first question you want to ask yourself is is price bullish or bearish so we know that price will not just go up or down in the straight line if price wants to go up it will go up pull back a little bit and then goes up even higher pulls back a little bit and then then goes up even higher that's just how the market work right nothing will ever go up and down straight I know this
might sound super basic but people need to be reminded more than they need to be tght right so in the uptrend we know that price is going to be creating higher highs and higher lows like what we have on the screen right here so when price break through the last High it creates what we call a break of structure to the upside right so this is our bullish breakout structure so if we to map this up we see that price is creating like I said higher highs higher lows leaving us a bullish breakout structure but
we know that price will not go up forever at some point of time some sellers will come into the market and overwhelm the buyers and that is when price will come down there and break past the last higher low when this happens this is our Market shift and then this Market shift pretty much just tell us that price is reversing from a uptrend to a downtrend and right now we are about to turn bearish and if price is starting bearish price will be creating your lower highs and lower lows like what we can see on
the screen right here right you can see lower highs lower lows once again is creating bearish break of structure to the downside and then eventually price will turn back bullish again when demand Ste into the market and overwhelm the sellers and that is when we will get another Market shift where price break past the last lower high creating a new higher high and now we are officially bullish so this is just how the price moved right right this is just how the market works that's the first thing you must understand right is to really identify
whether price is bullish or bearish right now because we want to trade with the trend if price is bullish ideally we want to buy at all these higher lows and if price is bearish we want to sell at these lower highs I know you're probably sick of hearing me repeat this like a thousand times by now but you must make sure you master the basics because if you don't you are essentially building a house on S and if some natural disaster come you'll just come and wipe out the entire house right so you need to
have a solid foundation the second question you want to ask yourself is is price in the continuation phase or the pullback phase because after a break of structure we know that price is going to start pulling back and we need to have that at the back of our mind and a lot of people don't and a lot of retail Traders don't they assume that after price break through the last high price is just going to continue going up like this in a straight line and they start entering for a buy Here buy Here buy here
just for price to start pulling back and then they are wondering why the market is is going against them so on and so forth after a break of structure instead of entering for a buy immediately remember we want to wait for price to pull back and then we will enter for a buy right here because if you enter for a buy right here guess what the stop loss must be below this last higher low and your risk is essentially much higher compared to if you're entering right here and you have your stop loss below this
last low so that's the first step you identify whether price is bullish or bearish so that you know exactly which side of the market you should be trading with and then you identify whether price is in the continuation phase or the pullback phase if price is in the continuation phase I would advise you to wait for price to start pulling back and start to create that new structure then you enter for a buy because ideally you want to trade with the trend after the pullback is over so for the second step we are still on
the 4-Hour time frame and this is when you want to map out your supply and demand zones in the last video we have already taught you how to actually map out your supply and demand zones and I'm not going to go through the entire thing again but basically you want to identify demand zones in a bullish market and you want to identify Supply zones in a bearish market because these are the zones that are aligned with our higher time frame Trend and we want to be able to trade with the trend right so using this
example right here what we have was that price was going up and then it hit onto some unmitigated Supply Zone that we have on the left hand side and that is when Supply step into the market and that caus price to start turning bearish to facilitate the pullback right so once price starts pulling back eventually it goes up there and break past the last High giving us a break of structure to the upside and now we know that we are in a continuation phase remember when price is in the continuation phase yes you can enter
for a buy here and here but I would advise you to trade after the pullback is over so that you can get the optimum entry point eventually price will start pulling back again once again why is it pulling back because it hits some sort of Supply Zone that we have on the left hand side and Supply St to the market and because price to start turning bearish now once the pullback start happening you will start to see price creating lower highs and lower lows on the lower time frames and at this point of time you
must be aware of the higher time frame Trend and know that we are just turning bearish for a short amount of time to facilitate the pullback on the higher time frame Trend so you cannot assume that price is reversing into bearish right now because price has not took out this last higher low that means we are still playing within this swing range right here this is a swing High a swing low and price is just turning bearish to facilitate the pullback so in this case since we are in a bullish Market where price is creating
higher highs and higher lows we want to trade from demand zones right so based on this we are able to identify two demand zones this is the first demand Zone that was being created after price broke structur and then this is the second demand zone right which was created after price broke the internal structure right here on the lower time frame itself so now our job as professional Trader is to simply wait for price to come back down to either one of these demand zones and then wait for our entry model to present itself and
then that is when we execute our trade without hesitation reservation or fear so now this is where I will advise you to set the alert at the edge of the zone that you want to trade from and right now you might be asking me Brad so which zone is price going to respect and starts going up let me tell you the honest truth I am not a fortune teller I don't have a freaking Crystal ball I don't know which zone price is going to rest back and the thing is you don't need to know in
order to make money you just need to wait for price to come down to either of these demand zones and then you wait for your entry model to present itself and then that is when you enter for the trade so step three is where you execute your trade after price has entered into your demand zone so at this point of time before it get to ahead of ourself You Must Be Wondering okay are we allowed to trade right here where price has done bearish to facilitate the pullback yes you can right so if you are
looking to trade the counter Trend which means you are trading against the higher time frame Trend you are trying to capitalize on this shortterm pullback that we have right here yes you can enter for a sell here at all these lower highs right here but bear in mind you have to manage your expectation because the minute price enter into any one of these demand zones right here we know that at any point of time right now price is going to switch bullish and it's going to cause price to continue to go up so the best
way to trade counter Trend or rather the best time to do it is to actually enter for sell at the start of the counter Trend itself but the Min price enter into either one of these demand zones I would advise you to stop trading counter Trend and look for your pro Trend setups right look for your entry model so if you look at this there is a gray line right here on the screen and there's a black line right the black line basically represent the 4-Hour time frame and the Gray Line basically represent a 15minute
time frame which shows us what price is doing on the lower lower time frame and as you can see like I said earlier price done bearish right it created lower high lower low lower high lower low on the internal structure on the lower time frame structure in order to facilitate the pullback of the higher time frame Trend and like I said we want to wait for this pullback to be over demand step to the market overwhelm the sellers the supply that we have right here that is when we know that right now the internal structure
the lower time frame structure has shifted from bearish to bullish and the lower time frame trend is aligned with our higher time frame Trend and this is when we are able to capitalize on those high probability trade setups so in this case right what happened was that price came down into this recent demand Zone but it failed right so this demand Zone failed to do it job right if demand wanted to step into the market what could potentially happen is that price would just continue going up like this and just continue with the higher time
frame bullish order flow but that did not happen this demand Zone failed and in the end price went down even further and came down to our extreme demand zone now bear in mind this extreme demand zone right here this is the last line of defense because if you look towards the left hand side this is the last swing higher low right this is the previous swing higher low which means this point has to hold in order for price to remain bullish in order for the higher time frame structure to remain bullish because what happens is
that if price break through this last higher low what we have is a market shift which now P that price is reversing from this uptrend to a downtrend right now and I know my drawing is extremely ugly but just bear with me a little bit because it will all make sense very very soon so knowing that this is the last line of defense we can be a little bit more aggressive with our entry so the minute price actually mitigates your 4-Hour extreme demand Zone you want to drop down to your lower time frame to actually
look for your entry model now you might be wondering what does the entry model looks like don't worry I'm going to give you the secret Source right now so this is what the entry model actually looks like so we know that price has done bearish to facilitate the pullback and at some point of time we want to see signs that this bearish trend is over and right now price has shift up bullish and that is when we want to look for our Market shift right so bear in mind this is what price is doing on
the 15 minute time frame right so you want to see price goes up there and break pass the last lower high creating a market shift which signal to us that right now now the order flow has transitioned from bearish to bullish and right now we are about to go to the moon so that is the first criteria that must be fulfilled before you actually enter for a buy the second criteria is you want to wait for some form of liquidity to be swept you must understand that smart money they need to sweep liquidity before they
can cause price to start going up heavily now if you don't understand liquidity here's a quick crash cost we know that above every swing high that is available liquidity and Below every swing low that is available liquidity why because when a retail Trader enter for a buy right here that is when they will place that stop loss below this last low right so that is just available liquidity being build up that is when smart money sometimes they push price down there purposely and manipulate price to sweep the available liquidity that we have below these lows
before causing price to reverse and hit back up and the thing about liquidity Swip is that it usually comes in the form of a Sharp v-shaped reaction like this right you want to see aggressively going out and aggressively coming back in so what happened right here is that when price started reversing right here right this is when it will induce the retail traders to actually enter for a buy position thinking that price is going to reverse right now and that is when they will place a stop loss below this low right here and that is
when smart money come down there sweep the available liquidity stop them out stop these newbies out and then cause price to reverse and hit back up and that is when the rail move is starting to happen and that is what we have a liquidity sweep so after you get your liquidity sweep after you get your Market shift that is when you want to be waiting very patiently for price to come back down to the demand Zone that actually created this Market shift and that is when you enter for your buy position this is where you
get your Optimum entry point ladies and gents so you can either enter for a manual buy order or you can set the entry limit order on the edge of the Zone itself and then you need to make sure that you place your stop loss below the zone itself now looking at this entry model you might find that it looks very familiar why is that because what we saw on the higher time frame is essentially the same thing this same exact entry model can be used on any time frame be the 15 minute the 4 Hour
the daily or the weekly whatever because price is fractal whatever happens on the higher time frame must first happen on the lower time frame whatever happens on the higher time frame must first happen on the lower time frames and the same pattern t to repeats over and over again what's up bro so while editing this video I realized that I made a little mistake in the drawing itself right so basically I know you guys are probably confused why is this Cirus and I'm pointing to this thing basically just know that you are looking for this
entry model on the 15minute time frame over here right so there isn't supposed to be this little circus right here right the point of this is just to show you that okay that is a liquidity SHP that's the second criteria the first criteria is a market shift and just wait for price to pull back to the demand Zone that created this Market shift and you enter for a buy right there as simple as that now what this diagram is for is for those traders who want to analyze their charts on a 4our time frame which
means all of these will be on 4our time frame and then once price mitigate the 4H hour point of interest you will jump down to the 15- minute time frame over here the minute it mitigated and then that is when you look for this on the 15 minute time frame right but let's just keep this strategy super simple and just stick to what I mentioned which is basically look for your Market shift and your liquidity s on the 15minute time frame and then what way for price to pull back to the demand Zone that created
this Market shift and you enter for a buy right there as simple as that no need to over complicate things here right yeah so this is more of like multi time frame analysis but nah let's just put that aside for now all right now that you have understood what I'm basically trying to convey let's get back to watching the video so now that you have understood our entry model you will know that after price has mitigated our 4-Hour demand Zone that is when we want to look for our entry model right here but let's say
for some reason you miss out on this entry model right this entry opportunity right here what do you do next you keep calm and collect it and you wait for the next trading opportunity right the next trading opportunity will come after price goes up there and create the market shift once again breaking past the inana lower high and that is when you wait for price to pull back to the demand Zone that created the market shift and this is when the minute price come back down here to this demand Zone that is when you go
on to the lower time frame once again to look for the same exact entry model that is why I say price is fractal because the same thing just keep happening over and over again and ladies and gents this is where you are able to get the highight from the trade setups because now we know that the lower time frame is bullish the higher time frame is bullish and we got the multiple time frame alignment and that tell us that right now we are about to go to the moon and right now we are about to
PR print print some good ass money so what's next after you enter for the trade after you enter for the trade this is when you want to manage your trade and I'm going to show you the exact step-by-step process on how we actually manage our trade first of all you'll be placing your stop loss behind the supply and demand Zone that you actually entered the trade on and if I take profit I would advise you to either take profit at plus three R which means the minute price reach one is to three like like this
one is to three you get of the trade or you can take profit at the nearest opposing supply and demand zone so in this case if you're entering at a demand zone right we're entering for a buy at this demand Zone we want to take profit at the nearest Supply Zone and if you're entering for a sell at a supply Zone you want to take profit at the nearest demand zone right so this is when you can potentially place a take profit at this nearest Supply Zone that we have on the left hand side that
cause price to come down here and yeah that is another way we can take profit right so either take profit at a plus three r or the nearest Supply in theand zone and I will advise you to go and find out what works best for you remember data is King you need to really gather data to see which take profit method works the best for you and then stick to it consistently once you place your stop loss once you place your take profit set and forget don't micromanage it whatsoever don't adjust your stop loss don't
adjust your take profit trust your analysis because the minute you start adjusting your take profit making it wider or adjusting a stop loss making it further that is when you will start to incur large losses and small wins over the long run and that's not what we want because we want to be consistently profitable which means we want to make a lot of money and lose a little bit of money now that you have understood our three-step process let's go on to the charts and apply everything that we have learned so far to see how
we can apply this entire strategy in real time okay before that let me drink some tea now how can you have a trading geek video without somea it's like Batman without Robin or it's like having some fries without ketchup or chili it just doesn't make sense it doesn't exist your boy is is Ste all right all right so cool let's get on to the charts so over here we got a bullish break of structure to the upside because price cre a higher high higher low and then this is potentially a new high we can identify
that this is the high until price starts pulling back all right so that is when you can start seeing price starts pulling back okay cool that is when we got a new high right here now remember after a break of structure we are anticipating price to start pulling back and right now we are still on the 4-Hour time frame we haven't Dro down to the 15-minute time frame to look for our entry yet because price has not gotten into our Zone actually no we haven't even marked up the Zone yet right so we are still
on a fall time frame observing what price is doing step one building the higher time frame narrative right so at this point of time we know that we are officially in the pullback phase and price is in a bullish uptrend so you want to actually end up for a buy at a demand Zone but which demand zone are we trading from that is when you want to start marking up your demand zones right so what led to this break of structure there was this demand zone right here right this entire giant consolidation and then demand
step to the market and cost price to Skyrocket right so we know that this is uh one of our demand zone right so in this case this is the range method where we are marking up the entire consolidation or you can mark it up or rather just refine to this pivot candle that we have right here all right so that is your first demand Zone the second demand Zone that we have is potentially this one right here right so once again what do we have right here right start consolidating around here and then demand step
to the market and push price up right so you can actually Mark the first one right here but you can see price is just completely disregarded so it doesn't make sense for you to actually Mark the first one since price has already disrespected it right so that is when you mark up this recent demand zone right this is when we got a consolidation demand the market and boom demand push price up and then we also got our extreme demand Zone which is this one right here what happened was that price came crashing down right and
then it started reversing and start heading back up right there so this is our extreme demand zone so now we got three demand Zone in place right here and we know that right now we are playing within this swing range right this is our swing low and then this is our swing high so Step One is done the step two is also pretty much done because we have already marked up our demand zones and we know that in a bullish uptrend we want to trade from demand Zone and the next thing you can potentially do
is to set alerts at the edge of these zones right here so for those newbies who don't know how to actually set alerts on trading view you're dumbass no offense you just need to go to here press the alert and then press this plus button and it allows you to create alert and that is when you just want to input the price point that you want uh the notification to be triggered on and then once price get to that particular price point trading view will send you a Alert in the form of either SMS or
email that tell you hey bro right now price is at this price point you can go up there and analyze the charts that's what a alert does and then the next step is to just do nothing and wait and this is when so many Traders mess up they start taking a bunch of Trades they start forcing trades even though there's no opportunity because they're not patient enough to wait for the trade to come to them right so at this point of time let's just wait for price to mitigate either one of this demand Zone before
we determine the next cost of action boom that is when price came into this nearest demand Zone all right so at this point of time like I said this is where you want to drop down to the 15minute time frame to look for your entry model and if we don't get our entry model whatsoever that means price is potentially just going to disrespect this demand Zone and come down to the next demand zone right and then that is when we just continue waiting until eventually we get our entry model we get the market shift that
tell us that the internal structure the lower time frame structure have shifted bullish this is when you can potentially drop down to your 50-minute time frame the lower time frame and let's just observe to see whether our entry model present itself right let's see whether this demand Zone actually hold okay cool nope NOP you can see it completely just blew right past it so we know that this is not the demand Zone that we want to trade from so we can just delete it cool let's go back up to the 4our time frame and continue
waiting like I said patience is the name of the game this is what separates professionals from retail amateur Traders you guys just like to rush things because you want to get rich ASAP no just be patient all right so you can just wait price just blow right past this point of Interest as well but this is when we start getting some form of Market shift you can see this is where demand step into the market and overwhelm the sellers right just by looking at the clastics we know that a lot of demand have Ste to
the market cool let's just jump down to the 50 the time frame since price has already mitigated this this demand zone right so let's just go down there and this is when we want to look for the market shift remember we want to see our entry model present itself right so over here this is when we know that okay we got our entry model right here okay so over here price has already mitigated this demand zone right and that is when we are looking for our Market shift now how do we know the market shift
has happened we just continue to map out the the internal structure the lower time frame structure we know that this is the internal break of structure to the downside right you can see price has just been creating a bearish break of structure to the downside and since then this is the last bearish break of structure right so since this is the last bearish break of structure we can identify that the highest point is basically this area right here so this is the last swing high right so this is the last High and the minute price
actually broke past the last high that is when we got our Market shift remember for a break of structure to be valid the candles stick must close below the last low right so that is why in this case right here when price came down here break past this last low it did not close below it right it's just a Candlestick weak break so it does not count as a valid break of structure so later on price actually did close below the last low so this is the last valid break of structure and once again to
determine your last High you just draw a box right from the last low to the point where it break past the last low and then you just drag it all the way up there and you determine the highest point which is this one right here so this is actually your last lower high and since price has just broken past the last lower high that is when we got our Market shift that is the first criteria right so the first criteria has been met we got our Market shift the second criteria is that we want to
look for some form of liquidity to be swept and once again you want to ask yourself and once again you want to ask yourself where is the available ailable liquidity and remember I said that below every swing low there is going to be available liquidity right so based on this we know that over here where price came down into this demand Zone and started reversing this is when most retail Traders they will start entering for a buy position because they see price stepping into the demand zone They enter for a buy and happy gol lucky
thinking that price is going to go up right now and then they Place their stop loss below this last low right so that is available liquidity below this low right here and we know better than that we know that potentially price is going to come down there and sweep the available liquidity before it started reversing and that is when later on price actually did came down here right reverse and then came down here again swep all the available liquidity below this lows right here trigger out all the retail Traders stop- loss and that is when
price revers and hit back up you can see this is a very sharp v-shaped movement now after this liquidity sweep after this v-shaped reaction what does this tell us this tell us that the smart money they have entered into the market now as retail Traders we want to trade with the smart money we want to follow their Footprints so this was the second criteria was that liquidity sweep so now that we got our liquidity sweep and we got our Market shift the next step is to wait for price to come back to the demand Zone
that actually created this Market shift so that is when you want to identify the demand Zone that created this Market shift and you'll be this consolidation right here you can see this is where price price consolidate here a little bit before demand step to the market and push price up so this is when we know that okay cool this is the demand Zone that created the market shift and that is when you can place your entry order your buy limit order at the edge of the Zone itself place your stop loss below the zone as
for your take profit like I said you can either put it at 1 is to 3r which is somewhere right around here 1 is to 3 r or you can place it at the opposing Zone which in this case is a supply zone right so in this case I will actually mark this up as the nearest Supply zone so this is our nearest 15 minute Supply zone right there right so like I said either place it at 1 to three r or place it at the nearest Supply zone right and now we just wait for
price to come back down here to the demand Zone and Trigger us into the trade itself right so you can see price consolidating doing it thing you're still being patient you know you are trusting in your plan and boom that is when you get into the trade right there so right now your buy order has been triggered but you have placed your stop loss below this last demand Zone what next set and forget you have placed your stop loss you have placed your take profit you have done your research you have done your analysis you
have waited a few hours for this entry model to present itself now just wait for the trade to play out right once again you can see this is what makes trading so hard is the waiting the fact that you cannot do anything and the fact that the market is an irrational uncontrollable unpredictable beast and there not you can do about it so place your stop loss place a take profit set and forget let's see how this trade play out boom there we go as simple as that ladies and gents now we have hit out take
profit we can go pop a nice champagne or so and call it a day and then reset and look for the next trading opportunity now once again why is this considered as a high properity setup because the lower time frame right now has done bullish since we gotten this Market shift and the lower time frame is line with our higher time frame Trend which is bullish so if you want you can even be more ambitious to Target this 4H hour swing high but I wouldn't recommend you to to do this unless you have a lot
of experience because what can potentially happen is that price can start to turn bullish and just goes up like this and reach this Supply zone right here and then it starts coming down and just continue to consolidate around here that is when I don't want you to be stuck in this little consolidation for weeks right I just want you to get in and get out of the market fast but not too fast and yeah that's basically how you utilize this three-step simple system so now let's say for some reason you actually didn't manage to get
an entry here what's the next window of opportunity the next window of opportunity is once again to wait for price to pull back because right now we know that right now price has turned bullish right and we know that this is our new higher high and this is our new higher low and right now price just created another bullish break of shock structure to the upside and after breakout structure we know that price is going to start pulling back and where is it going to pull back to it's going to pull back to some sort
of demand zone right so in this case this is the entire demand Zone that led to this break of structure right so that is when you can place another buy order right here at this new demand Zone and then simply wait for price to come back down mitigate this area right here and that is when you enter for a buy is the same thing like I said earlier price is fr if you look at this we literally did the same thing on the 4our time frame right so just wait for price to come back down
to this demand Zone that created this break of shock and then for you to get triggered into the trade so this case just wait wait boom that is when you get triggered into the trade right here at the edge of the Zone once again and you place your take profit either at plus three R right like what we've done right here plus three r or at the nearest Supply Zone which would be this Supply zone right there and then just wait for price to play out and there you have it as simple as that guys
I'm literally not kidding when I say that this is how you really capture those High property setups right because what happens is really the lower time frame right now is bullish the higher time frame is bullish and that is when we are able to capture this nice nice nice setups when I pull up a blank chart just like this the first thing I want to do is to build a narrative of the higher time frame I want to know what's the overall order flow of the market what is the higher time time frame Market structure
doing what is the lower time frame Market structure doing whether it is bullish or bearish or whether price is in a push phase or the pullback phase so right now like I said our job is to really look at a higher time frame to see what sort of range we are playing in right now and you can see right now we're in a daily time frame and if you look at the market structure price is in a bearish order flow how do we know that price goes down pull back goes down and then pull back
creating a lower high and right now price seems to be creating a new lower low so price has just broke through the last lower low which is this low right here right this is the last lower low and price has just broke trade creating our break off structure so right now what we are basically seeing is downtrend Market structure price is in a bearish order flow on the higher time frames on the daily time frame so at this point of time after price break structure what are we expecting price to do we are expecting price
to pull back okay because remember price will never go down in the straight line or go up in a straight line has to go down pull back a little bit go down and pull back a little bit and then go down even further breaking through the last low and then starts pulling back so that is basically what we are expecting price to do after price has just broke structure and at this point of time you must be asking yourself where is Price going to pull back to and where is Price going to start pulling back
that is when we make use of our supply and demand zones right price is is most likely going to pull back to a supply Zone that actually created the lower high right here so at this lower high there's going to be some sort of Supply zone right that cause you know Supply to step into the market and the sellers to push price all the way down here so there we have probably some sort of Supply zone so we are basically expecting price to pull back up to this Supply Zone and then continue with the overall
bearish order flow right this is when Supply was step back into the market and push the price down to go down even lower to create your new low now that is where price is going to pull back to next thing you must ask yourself is where is Price going to start pulling back and it's most likely going to start pulling back at some sort of demand Zone that we have in the past unmitigated demand zone right maybe there's a demand zone right here that cause price to push up right so this demand zone is basically
going to cause price to start pulling back right and that is basically all you need to know in terms of Market structure and supply and demand I just simplified that in like freaking one minute which is crazy so what happened right here is after price broke structural you are anticipating that pullback and like I said where is Price going to pull back too you look towards your left and you basically try to identify all the demand zones that we have right here so I'll go down to like the 4our time frame to see you can
see that is a demand Zone at this area right here this is when price push starts pulling back consolidate a little bit before demand step into the market and push price all the way up here so this entire range right here would be your demand Zone but as you can see price has already bypassed that right so I would wouldn't really regard this as a valid demand Zone anymore since it has been completely taken out now you ask yourself where's the next demand Zone once again Zoom back a little bit and just go back a
little bit and you can see this is where your imbalance step into the market you can see right here there's a lot of imbalance right here where buyers step inside the market push the price up and resulting in this huge move right here after price goes up pull back and then goes up even further so what we can do is that we can Mark out like a little this range right here this would be your demand zone right so this is the next point of interest that price is potentially going to go to and you
can see price is already at that point of Interest right price is already at the demand zone so now our job is to observe what price is going to do next we don't want to enter for a sell here because if you enter for sell here your stop loss will be above the last lower high which is this one or even this one right here and your take profit could maybe just be at the next point of Interest the next demand Zone which is right here and you can see how this is a very bad
RIS to reward decision this is a very unprofitable a low quality trade setup a low probability trade setup because right now price is in the demand zone and right now we are expecting price to pull back and what you can also do to keep things really Simple and Clean is also to identify the swing trading range that we are basically playing within right so I'll basically just zoom in to see what price is doing right here because you don't want to be carrying about all these noise that we have right here all of these are
just noise all of these are just distraction so zoom into what price is doing right here and you can mark up the swing high that we have right here this is your swing high so I'll put that as a swing high right there and then I'll place like a normal line right there and then that is your swing low that we have right here so basically we are basically going to be playing within this range right this is your high and this is your low so we are basically going to be focusing on what price
is doing within this range and once price starts pulling back at this area right here creating that higher high and higher low right then we can anticipate price to put potentially come up to this swing high that we have right there to mitigate it so at this point of time once again we have identified our swing range we know that the overall higher time frame order flow is bearish and we know that price has just broke structured and right now we are anticipating that pullback to happen so I'm just going to play price forward a
little bit to see what price does and you can see okay you can see this is a sign that tell us that you know what maybe the Bulls are about to enter into the market at this demand Zone to push price up the pullback is about to start happening right so right now this would be your counter Trend trade setup right if you're entering for trade over here a higher probability TR setup would be to enter for buy position because you're playing that counter Trend pullback and you know for a fact that price is going
to turn bullish for a short amount of time to actually facilitate that pullback before price hit the some sort of higher time frame Supply Zone and continue going down even further so that is basically what we are visualizing in our head so at this point of time I'm going to see what price does at this demand Zone that we have right here at this swing low being form right there so right now we in the 4our time frame and I can see where is the last lower high right based on minor structure the last lower
high will be this one right here right this would be the last lower high that we have right there this one I can just get refine it to like like this yeah we just put it like that so at this point of time this is the last lower high so in order for price to turn bullish I believe that price has to break through the last lower high to confirm to us that the boosts have officially stepped into the market and then maybe start creating a pullback and then go up even further then that is
when you can look for your long positions your buy position so at this point of time I'm still going to be waiting but this is a very good sign that tell us that demand have stepped into the market and if you look closely guess what we also have our liquidity sweep right here right remember below a swing low like this that is going to be liquidity build up below this swing low why because a lot of retail Traders when they see price reversing at this demand Zone they will immediately enter for a buy right there
and they're going to be placing the stop loss below this low right there and when that happens look at them they just got stopped out smart money was able to come down here sweep the available liquidity below this low and then potentially going to push price down I been up so right now let's continue to see what price does but we can just mark up a liquidity Swip happened right here first right there so you can see price goes up and creating our Market shift a shift of structural which tell us that right now this
bearish trend that we have right here is gone right the bearish order flow is gone and right now we should only be looking for buys we should play long positions we should basically stack our buy setups right so at this point time we know that the structure has shift from bearish to bullish and price has flipped from Supply to Demand right so I can Mark out my market shift right now so right now I'm looking for my entry since price has already gave me a confirmation that the market has shifted bullish bullish bullish yeah bullish
so at this point of time I don't want to enter right here once again because price can easily come up here and this could just be a liquidity sweep on this highs right there and then continue to go down even further I want the extra confirmation after price actually comes down here create that higher low this give us that extra confirmation for us to actually enter into the trade so at this point of time I'm still waiting to see whether price comes down here and most likely I'm going to be marking some sort of point
of Interest right here to actually signify my entry a so I'll go down to the 15minute time frame to look for my entries and you can see there's a area right here this will be your demand Zone the demand zone right here this would be basically an a where there is also a flip Zone because this is where price actually reacted from this Supply Zone and then come down here and creating a flip zone right there right and actually shifted from Supply to demand so there's also a flip Zone there as well so at this
point of time I'm waiting for price to come back or rather pull back to this point of Interest then I'll look for my entries so I'll see what happens next and you can see price starts pulling back right this both time is starting pulling back to this point of Interest right here and I almost forgot but this is the first point of interest and then there is also a extreme zone right here there's also an extreme zone right here extreme point of Interest right here because this is also when price actually had that huge mitigation
right that huge demand step into the market and actually pivot and hit back up so this is a very strong a will as well strong demand zone or order block whatever like to call it right so at this point of time the question I'm asking myself is which one is it going to react from it could come down to this a right here and react from this a or it can even come down all the way down to this area here and then react from this a and the truth is I don't have a goddamn
crystal ball I don't know which one is it going to react from but what we do as Traders is to react to the market just like what Bruce Lee said be water my friend what does Bruce Lee mean when he said that be water my friend that means you need to be flexible in terms of your approach you need to be adaptive you need to adapt to what the market is showing you rather than imposing your buyers onto the market itself so at this point of time right price has come down to this area right
here so I'm seeing to see whether price actually react from this area that we have right here here or no so you can see price is coming down even lower tapping inside this Zone and boom it completely bypassed this area that we have right here this demand Zone that we have right here and let's just pull back a little bit right it completely bypassed this demand Zone that we have right there so we can just remove this and right now since it's completely disregarded this where should we expect price to go next to this extreme
Zone that we have right here so at this point of time you can wait you can see boom price step into the extreme zone right now this is where I will go down to the one minute time frame to look for my sniper entries the key is in the details this is where you get the sniper entries guys if you can go down to the one minute time frame and execute this successfully you will be able to get those High RIS throughout ratio trade setups that you see your favorite Trader does you know those one
is 20 RIS throughout ratio one is to 30 RIS throughout ratio trade setups right so go down the 1 minute time frame and you can see what price is doing at this demand Zone that we have right here be in mind this is when there was a large amount of demand stepping into the market that we can see right here right large demand step into the market and if you look towards the left there is also your liquidity Swip right here where price actually created a vshape reaction and then right now price come back up
come back down to this Swip Zone that we have right here and then reacted from it so at this point of time we are at this strong point of Interest where we know for a fact that demand have enter into the market at no we know for a fact that smart money have entered into the Market in the past at this point of interest at this price point so we can expect smart money to actually enter into the trade at this price point as well so at this part time I'm going to be observing to
see what price does here at this demand Zone and you can see price creating this low right here once again liquidity build up right here and then this is when price swept the available liquidity that we have below these lows and then where is the last lower high right this would be the last lower high right here that would be the last lower high and right now since price actually broke trade it pretty much confirmed to us that price have shifted from bearish to bullish and right now the 1 minute time frame structure is aligned
with the 15minute time frame structure which show us that price is turning bullish to facilitate that pullback of the higher time frames so at this point of time right I'm looking for my entry slowly slowly you can see this somewhere right around here this is when you can potentially look for your entry trade setup right here you know you got that Demand Being buil up right here you can wait for price to actually pull back to this a right here and that is what I'll potentially do you can see you can see that pivot happened
right here after creating that market shift and right now I'm waiting for price to pull back to this demand Zone here right you can see right now it's still building up at this demand area right here and you can see we got a very nice pullback right here so this is where you can potentially look for some nice entry trade set up but we'll wait and see okay you can see price is reacting to this extreme Zone first right extreme Zone first once again the extreme order block that we have right there seems to be
reacting to it and we'll see what price does right there and boom somewhere right around here what we have is your Mitigation Of Demand right where price actually pulls back into this area here mitigate this extreme area right here and then goes up and actually creating this demand Zone that we have right here where there's a lot of imbalance of demand step into the market so this is a sign that tell us that price is turning bullish no price is already turn bullish this is a sign that tell us that price is going to Skyrocket
right so at this point of time you can look for your entries somewhere right around here where price actually created this imbalance or if you want to be even safer you can wait for price to actually pull back to this area right here right but but this is honestly a good sign for me to actually enter for the trade right where price actually mitigated this area right here and most likely I'll be placing my stop loss below this lows right there and this is when you can Target the next swing high on the 15-minute time
frame right this is really where you are able to get the sniper entries right we enter on the 1 minute time frame and then right now on the 15minute time frame we can look to Target at this swing high that we have right here right so if you look towards the left this is where price actually goes down pull back give us a Supply right here consolidate at this area right here and then push down even further so this is a supply Zone that you can potentially Target right there or if you want to swing
for the fencers you can even Target this high that we have right here and this is where like the interesting thing really happens right if you go all the way up to the four hour time frame right or rather the 1 hour time frame you can see that what we have mentioned just now price is turning bullish to facilitate the pullback on the higher time frame order flow so we are expecting price to pull back to where to this Supply Zone that we have right here so let me just mark up this Supply zone right
here you can see this entire area right here this is your supply zone right this is where large amount of suppli steep into the market and push the price all the way down here leading to a break off structure right there so right now like I said price is going to turn bullish to facilitate that higher time frame pullback because bear in mind the higher time frame outlow is still bearish right everything is still bearish everything is still going back down but right now price is just going to turn bullish for a short amount of
time to once again pull back to where where is it going to pull back to to this Supply Zone that we have right here before it wreck from this area and potentially goes down there and create a new low this is really the key guys right now that is basically tell us that okay the time frame the immediate bias is bullish on the higher time frame on the 4-Hour time frame it is bullish on the 1 hour time frame it is bullish on the 15 minute time frame it is bullish and on the 1 minute
time frame it is bullish all the time frame is aligned to our favor so what you can potentially do is that instead of taking profit at this this like little swing high that we have right here right you can even swing for the fences by targeting all the way up here at this higher time frame frame Supply Zone that we have right here and this will be a 1 is to 72 RIS to R ratio trade set up right just look at this number right here I will drag it out but it's it's just so
ridiculous right this is completely insane you don't know how insane this is this is like risking $100 to make $7,200 can you imagine that risking $100 to make $7,200 or risking $1,000 to make $772,000 you know how insane that is it's freaking insane that is why I tell you guys if you can Master this sniper entries and you trade like a sniper you will be able to bank consistent profits and increase your win rate and increase your risk to ro ratio and you will be able to really maximize your profits right but this is really
the best case scenario where there is no draw down whatsoever after price just goes just goes up like this right that's the best case scenario but more ofer than not this is obviously not a very realistic trades out right this is just like swinging for the fences you know what price can potentially do is it could go up there and then come down here tap into this area again before going up even further in that case you would just get stopped out so I wouldn't personally do this but what I'm saying is that you can
right you can do this if you get really good at entries this will be the type of entries that you get but let's say that you're not so good yet let's just Target at this area right here this last swing high that we have this last Supply zone right let's just be realistic first because because right now you're broke your next goal is to not be broke is not to be rich but not be broke is to break even is to stop losing money that is your next goal all right so at this point of
time we got ta into the trade right now this on one minute time frame you can see we got tap into the trade and right now can observe to see what price does here okay this is going to take forever honestly Maybe not maybe it's not going to take forever but this is the one is done which is still not bad right you're risking 1% to 133% and 133% is actually pretty good because if you think about right 133% in one month that is like better than professional Traders professional Traders get like 5 to 10%
return on investment per month so 133% is pretty damn good yeah as you can see eventually price goes up there and smash your take profit right there you can see if you go on the one minute time frame you can see price has already smashed your take profit and that is how you get those sniper entries ladies and gents now what if you know what this is good you close this one is 1 re through ratio trade set up you are happy what's next for me when I win a trade I don't just sit there
and celebrate with champagne whatsoever I'm thinking about what's next I don't rest on my victories I'm thinking about what trade setup what is the next opportunity that I can potentially take so one is 13 right here you're up 13% Happy Days boom gone all right we just move on to the next trade setup so at this part time M mind we are seeing what price is doing at this area right here right and remember price haven't officially like start creating the higher time frame I mean no the higher no the bullish orderflow when am I
speaking price have not officially started creating that higher highs and higher lows yet it is still within this consolidation that we have right here right so it's still consolidating once again this very good right this is telling us that this bearish momentum is gone that is why price is consolidating around at this area right here and this is also your accumulation phase where it states that smart money could be just stacking their buy orders at this area right here they are buying here they're buying here they're buying here buy Here buy Here buy here they're
basically stacking their buy orders at this demand zone so that eventually when price push back up there guess what they make a lot of profits so at this point of time right I'm observing to see what price is doing right maybe price will come down into this area again or maybe it could not right so you can see what price is doing maybe it will go down to the one hour time frame for all time frame you can see right here right here this is when your demand have step into the market right there's a
demand Zone being formed right there you can see price seems to be mitigating this demand zone right here and right now price has officially starting the up move right this is the next swing high that we are looking forward for it to play out right price can potentially go up there and break through this high right there create a new higher high and then pull back to a and create a new higher low and then create a higher high and higher low higher higher higher low like this that higher time frame know that bullish order
flow right the bullish Market structure so this of time I'm still seeing see what price does and you can see price is respecting at this demand zone right here so what you can potentially do is that you can endle for a buy somewhere right around here if you want once again Target this area right here this would be a much more realistic trade setup right there right again that's something you can can do right you can see price step into that the demand Zone demand step into the market push price up and up and up
and up and right now it's creating it just created that new higher high because price just broke through the last high that we have right now to create a new higher high at this point of time after price create a higher high what are you expecting you expecting price to start pulling back on the lower time frames you expecting price to start pulling back to some sort of demand Zone that we have right here tap into it and then create that new higher low and goes up even further creating a new brish break of structure
and then create a new higher low so on and so forth that is basically what you are expecting price to do right so at this point of time price is going up and up slowly is going up you can see it's creating new demand zones right this is the last demand Zone and there's a new demand zone right here so once again you can look for another entry somewhere right around here where price actually mitigated this demand zone right here and then once again Target this area right here you can see price is just slowly
playing in your favor right now right goes up even further right tap into this Taps into it okay boom right here this is when price comp spping the available liquidity that we have below this lows right there right so let's say in this case you got stopped out it's okay we move on to the next trade we asking ourself whether our trade idea is still valid whether price is still bullish and you can see price actually came down here to mitigate this little demand Zone that we have right here right this demand zone right here
mitigates it and then go and you have also SW the available liquidity that we have below these lows right there so this could be a much more better entry right there below this theand Zone and take profit at this area once again and you can see or you can even take Profit just at like this swing high that we have being buil up right there right you can see this is basically my top process when I am trading okay one is the trade not so [Music] shabby and then price goes up smash your take profit
or once again you can take partial profits here and you can have your overall take profit here whatever you like to do to actually manage your trade setup that is basically the case right and you can see price just goes up and up and up and up and up up maybe you go up to the 4our time frame and you can see eventually price will most likely get up to this area right here right once again it's just going up creating the higher highs and hello and boom you smash your take profit right there ladies
and gents this is how you do it basically what you are doing is that you are essentially waiting for that lower time frame structure to align the higher time frame structure and and you are play basically focusing heavily on Market structure on the higher time frame and then you going down to the smaller time frame like the one minute time frame to look for your entries right and that is really how you get those sniper entries right guys if you can really Master this strategy like I said you will be able to massively increase your
rest ratio and Bank profits consistently once again you are going to be very patient right I ENT up for this trade set right here because I had all the confluences in the world that tells me that okay we are in that pullback phase we are in that bullish order flow phase and we have multiple Confluence we also have price at this demand zone right here where we know for a fact that demand is stepping into this market right so like I said you need to understand why the market move how the market move in order
to trade not trade based on those stupid chart pattern stupid retail trading Concepts following some Candlestick patterns or whatnot no you have to understand why price move how price move and trade with a purpose and that is how you win in the markets consistently so in this scoping strategy we are only going to be using two time frames the higher time frame to build our narrative and the lower time frame to execute our trade when we see our entry model firstly let's talk about the higher time frame now it really all comes down to just
three simple questions firstly ask yourself is price bullish or bearish and then once you have identified the trend Direction determine whether price is in the continuation phase or the pullback phase if price has just created a breakout structure we are anticipating price to start pulling back and the last question you want to ask yourself is where is the available liquidity in the last lesson we talk about inducement so this lesson we will actually start applying it right so over here we know that when price goes up pulls back and then it goes up before it
actually went up it actually did like a minor pullback just like this creating a new swing low right here so we know that below every swing low that is going to be available liquidity because retail Traders the going to be entering for a buy right here and they're going to be placing their stop loss below the swing low so that is just available liquidity being build up right there so in the future we could expect price to come down there and take out all this available liquidity before we get that real move in price so
looking at a bullish scenario after this break of structural we are anticipating price to start pulling back and then once price starts pulling back we know that okay now we got this near demand Zone and then we also got this extreme demand zone right the extreme demand zone is that last line of defense that must hold in order for price to remain bullish because it's literally at that last swing low right so when price is pulling back firstly it's going to pull back to the near zone right so when it pull back to the near
demand zone right here observe what price does okay sometimes what could potentially happen is that price could just come into this near Zone and then just starts going up right but I'll say eight out of 10 times that doesn't actually happens price usually comes down to the extreme zone why because it needs some form of liquidity before the real move can actually happens and right now where is the available liquidity your third question and if I look towards the left hand side I would know that there is available liquidity below this swing low right here
okay so that was your inducement so this is when once again a lot of retail Traders they will try to enter at the near Zone thinking that price is going to go up right now and they're going to be placing the stop loss below the near demand Zone and when this happens guess what this just generate more available liquidity so now we got liquidity right here on the left hand side we also got liquidity on the right hand side now this is where the fun part actually happens right so price actually goes down who's back
right F out all the retail Traders before price comes down even further to this extreme Zone swe all the available liquidity from the left side and the right side before we get a strong move in price okay so this is pretty much how you really determine your higher time frame objective you always have to be asking yourself these three questions right here always make sure you are able to Iden ify available liquidity because if you cannot identify liquidity then guess what you are the liquidity so always wait for that liquidity sweep before you actually enter
for the trade so once price hits your point of Interest whether it's the near demand zone or the extreme demand Zone you want to drop down to the lower time frame to look for your entry model which I'm going to show you later after I actually went through this bearish scenario and then once you find your entry model on the lower time frame that is where you can just execute the trade with confidence without hesitation reservation of Fe now before we move on to talk about the entry mods let's just go through the barish scenario
quickly so firstly price goes down pulls back and then when price is going down to to break that last low right to create a new swing low it created like a minor pullback just like this right and that just created like a little swing high that we have right here and we know that's going to be available liquidity above this swing high so right now after the break of structure we anticipating price will start pulling back and that is where price starts pulling back to the near Zone first remember is always going to pull back
to the near Zone first once it pull back to the near Zone this is where you want to observe what price does that is why I say that it's very important that you look for your entry model before you actually enter for the trade you don't want to enter for a sell immediately right here because price St into this Supply Zone because sometimes price can just do this right this could just be like a inducement to induce retail traders to enter for the trade early so you always want to make sure that you get the
entry model before you actually enter so in this case right here we know that this is just available liquidity being buil up on the left hand side on the right hand side and then later on price comes up there Swip the available liquidity from these highs right there before we get the real move okay so once again even though this is the extreme Zone there is no guarantee that it's going to work okay there is still a chance that price can just blow right past it and then we get a market shift and then price
just shift bullish so you always always be patient look for your entry model on the lower time frame after price step into your point of Interest hey it's future Brad here so before I let you continue watching this awesome awesome video I've got a very important announcement to make I've created two new YouTube channel first of all bread gold trades this is where I will be documenting my live trades and next year I plan to make a million dollars in profits so I'm going to be documenting all my live trades on this exclusive Channel bread
gold trades the second channel that I'm going to be launching is bread go unfiltered this is where I'll be posting raw reality videos right like uncut videos just like this where I just tell you guys what it's really like to become a 22y old millionaire and just give some motivation on the way to get there right to help you get there so yeah these are the two new YouTube channels so please go and subscribe show some love what's there for you to lose you are literally broke you are penless you have nothing to lose so
just go subscribe get some free value I'm going to do my absolute best to make 2025 the best trading year for you so yeah go and hit on the Subscribe button and once those two channels hit about 50k or even 100K subscribers I'm going to be doing a massive giveaway going to fly one of you guys out to Singapore and have like a three days fully paid vacation all right so yeah now you can get back to watching this video and learn about the awesome entry models that I'm about to show you so here's the
secret entry model it's called the flip plus Swip entry model this is one out of six different entry models that we have inside the 1% club right so after price step into your point of interest that is where you want to drop down to your lower time frame to look for either one of this entry model before you actually enter to the trade right so for your lower time frame you can either use the 5 minute time frame or the 1 minute time frame now I would advise you to actually use the one minute time
frame unless you are very experienced because trading on the one minute time frame is like a whole different ball game because there's so many different false signals so if you're like a beginner or even if you're like an intermediate Trader you should just stick to the 5 minute time frame first because if you cannot Master the 5minute time frame you will not master the 1 minute time frame all right and once you get enough experience eventually then you can dive deep into the 1 minute time frame so when price steps into a demand Zone in
the bullish scenario or a supply Zone in the bearish scenario on the 15-minute time frame that is where you can drop down to your lower time frame which is the 5 minute time frame and you look for this pattern or this pattern right here let me explain when it comes to this entry model you always want to make sure that you get the liquidity sweep before you actually look for your entry when price is approaching point of Interest it usually create inducements just like this where price comes down here it creates some form of dou
bottom or just like reverse like this once again this is so that they can bit all the retail traders to enter early just to build up available liquidity below the lows so next thing you know price comes down Swip all the available liquidity before creating a Shar v-shaped reaction so that's the first thing you want to look out for that sharp vhip reaction which tell us that all the retail Traders they have been stopped out they are gone from the market and that is where the strong move the real move is potentially going to happen
very very soon so after you get the liquidity sweep what you want to look for next is some form of flip zone so flip zones are basically those zones that cause other zones to fail here's what I mean so when price is going down just like this we know that there's a supply zone right here because at this point of time this is where Supply step to the market and cause price to go down just like this and the next thing you know price comes up to react to this Supply zone so if this Supply
Zone would do his job price will continue going down even further right taking out this low but in this case we got a failed reaction where price reacted from this Supply Zone but it failed to take out this low right here and it just went up just like this when this happens we know that a flip zone is formed remember the reaction is key because this reaction shows us that this Supply Zone did this job but it did not follow through there was not enough Supply to cause price to actually take out this low right
here which means at some point of time demand actually overpowered the Supply right here when this happens this is where we got our flip zone right here but remember this is the flip plus Swip entry model this is not a flip Zone entry model which means once again you want to wait for liquidity to be swept before you actually enter so in this case right here when this flip Zone was formed when we got the FI reaction guess what a new swing low is formed and we know that at this swing low that is going
to be available liquidity below the low so now instead of entering right here we want to wait for price to create that flip plus Swip zone so price later come down here Swip the available liquidity below this swing low give us our flip plus Swip Zone before we get price goes up there and creating that market shift which confirmed to us as a shift in structural and price has officially shift up from bearish to bullish demand has overpowered Supply and right now we are about to go now so after this flip plus Swip zone is
formed you are just simply waiting for price to pull back after the market shift to your flip plus Swip Zone and that is where you enter your trade right here and you can Target three now I know all this might sound super overwhelming or confusing but it really all boils down to four simple steps you wait for your liquidity Swip you wait for your flip plus Swip you wait for your Market shift and then you enter at the flip plus ship Zone before we go into the charts to look at some examples here's what this
entry model looks like in the bearish scenario so once again we got price approaching the higher time frame point of Interest the higher time frame Supply Zone on the 15-minute time frame right when this happens guess what there is going to be inducements right this is once again to bit all the retail traders to enter early later on price comes up there Swip the available liquidity above the inducement before we get that Shar vshape reaction remember we need that sharp VAP reaction to confirm to us liquidity has been swept once that is done step two
wait for your flip right so once you got a flip right here we got a f reaction where price actually reacted from this demand Zone but fil to take out this high right here that is where we are patiently waiting for the liquidity above the flip Zone to be sweat to give us our flip plus Swip zone so price let go up there Swip the available liquidity above the flip Zone and then that is where we got our flip plus Swip zone is formed and that led to the market shift right here so now all
we are doing is to wait for price to come back up to our flip plus s Zone and bam that is where we look for our entry so this is what the entire sculping strategy looks like at a high level so if you want a copy of this you can just go to the description and just download it there's like a link below it yes you can download it for completely free I'm not going to charge you like $49 for this or something it's completely free Link in the description now let's go to the charts
and apply this scoping strategy so first of all we are on USD JPY we on a 50-minute time frame this is where we want to determine our higher time frame objective right so we know that price is pulling back right here after price has already gave us a break of structure to the upside just like this and when price actually created this break of structure it did not just go up immediately you know price actually goes up pulls back create like a minor pullback just like this before the real move actually happens so we know
that there is your extreme demand Zone and then that is your near demand Zone that we have right here okay and right now you can see price has completely disregard the near uh Zone and it's going down to our extreme zone so we can just pretty much erase this right this is why I say that the near zone is is always quite unreliable this is not to say that the near zone is not going to work because sometimes it does work sometimes we get price moving up immediately after hit into this near Zone rather than
the extreme Zone but I'll say like based on statistics most of the time it tends to come down to this extreme Zone because that is where you know liquidity gets swept so one surprise steps into this extreme Zone you must understand that this is indeed the last line of Defense because this is that last swing low that led to this break of structure so if price actually come down and take out this swing low price is Shifting bearish right price is literally taking out this last swing low shifting bearish and right now we're going to
start creating lower highs and lower lows so in order for price to remain bullish on a 15-minute time frame this demand Zone has to hold so once price step into this extreme Zone that is where you drop down to your 5 minute time frame to look for your entry model so let me just go right to the 5 minute time frame right there okay so right here what do we have we got price reacting right demand stepping into the market and look at what price does price come down there take out some good old liquidity
right before actually getting that real move so when this happens we see a very very sharp and obvious vshape reaction which tell us that price has officially s the available liquidity that we have Bel below this swing low right here okay so this is our liquidity Swip that's the first thing you want to see from this entry model itself okay and then right now this is that last internal lower high so if price create a market shift takes out this last internal lower high and create a market shift that is where price is going to
shift from bearish to bullish on the internal structure and right now we know that price is going to start going to the Moon okay but at this point of time look at what we got price is reacting from this little Supply right here okay but before that actually happens I want you to observe what price does over here this was a supply Zone how do we know this is a supply Zone because after this Supply Zone lots of supplies step into the market and cause price to go all the way back down okay so right
now the next thing we want to see is obviously that that flip zone right we want to see that fil reaction then then we want to wait for that flip Zone to be swept before we actually enter for the trade okay so let me just go down to the 1 minute time frame a little bit okay you can see price comes down here okay you can see this flip zone is doing its job right we got price goes up creating that flip okay you can see a flip right here before price actually potentially could start
going up right there let me just continue to see what price does there we go right you can see what happened over here just a quick recap Once that price goes up pulls back creating that fi reaction and then Laton price goes up there and we know that that is available liquidity below this low right here and then Leon price comes down Swip all the AV liquidity below these lows before we get that strong Flip plus Swip right there so at this point of time I have identified my flip plus Swip Zone I know that
this entire area this entire point of interest that we have right here was our flip plus Swip zone so that is where I'll just put this blue zone right there and then we know that this liquidity has been swept as well and now we are just waiting for the market shift but in this case right the market shift has already happened where price went up there and closed above this last high right here so now looking at this we pretty much got all our criterial check so now it all comes down to just waiting for
price to pull back to my flip plus Swip Zone that we have right here and then that is where I can look for my entry I'll place my stop loss below this flip plus Swip zone right there and then I'll place my take profit at 3 R just like this okay so later on price comes down boom tap us into the trade right there very very beautiful entry and then bam that is where we got out very very fast once the three hour just like this and this took place in less than an hour l
so but no this actually took place in less than 30 minutes right so within 30 minutes you just caught this once to three hour trade as simple as that now before we move on to the next example here's a quick recap on what what just happened so we know that on a 15-minute time frame right price is pulling back after this break of structural and it pull back to this extreme Zone and we know that this extreme Zone has to hold in order for price to remain bullish so once price into this 15-minute Zone we
jump down to the 5 minute time frame to look for our entry model and what happened was that we saw a liquidity Swip in price and then later on price created a flip Zone but remember we don't want to enter on the flip Zone we want to enter on the flip plus Swip right so we waited for that flip Zone to be swept and then we also got our Market shift which confirmed to us there a shift in structure and this internal structure has done bullish before we finally get our entry we price step back
into that flip plus sweep Zone just like this place our stop loss below the flip plus Swip Zone and we targeted three up so the second example is going to be a bearish scenario right so what we have over here was that price goes down pulls back and then goes back down right so we know that this was a bearish break of structure to the downside and you must be asking yourself what actually led to this break of structure we know that there's going to be some form of Supply zone right so you look towards
the left hand side you see that this entire range right here you can draw this as your supply Zone okay so this be our 50- minute Supply Zone and then drag it all the way up here and you can see price has already mitigated that Supply Zone cool so this is a little bit too early so let's just maybe jump back right here okay so when price is approaching this Supply Zone remember sometimes it's going to create inducement just like this to bit all the retail traders to enter early right so retail Traders enter for
sell right here they're going to be placing a stop loss Above This high right here immediately and when that happens we know that that is just available liquidity being build up right here which is going to be swept later on so later on price goes up boom sweep the available liquidity once again sharp vshape reaction that is where our first criteria has been met now once price actually taed into this 50-minute Supply Zone we would have already jumped down to the 5 minute time frame to look for our entry and that is where after that
liquidity Swip what are we waiting for we are waiting for that flip plus Swip to be formed and if I look at right here I know that there is a demand zone right here this is our 50-minute demand that cost price actually goes up there so right now we want to see that fail reaction we want to see price react from this demand Zone goes up but it fails to take out this High okay remember this reaction is key without this reaction we cannot tell that this is there actually a flip zone right so once
we actually get a fil reaction that is where we wait for price to Swip the available liquidity Above This high right here before we get that real move price comes down potentially create a market shift and then we just waiting for price to pull back to this flip Swip Zone and then we get our entry right there okay so now let's just continue to play price forward and see what price does boom fi reaction is being form right here you can see beautiful swing High being form right here okay we know that there's available liquidity
right here wait for that liquidity to be SW as well okay you can see right there price actually s the liquidity above this swing high right there that is where we have our beautiful flip blast sweep zone right there ladies and gents and then that is where you are waiting for the next quite well is the market shift right remember all of this might sound good but if you don't get the market shift you cannot be entering for the trade right Market shift is essential because it tells you that the internal structure has shifted right
it has shifted from bullish to bearish which tell us that this pullback is over and right now Supply is going to come into the market and cost price to start going down and the lower time frame trend is going to be aligned with the higher time frame Trend so yeah that's how important the market shift is I never actually enter I never ever enter for a trade without some form of Market shift okay so later on price comes down there okay wait no this is actually the flip plus ship zone right so right here this
was just a flip Zone see this is why you must be very patient when it comes to entry you don't enter here no no no you wait okay so price reacted from this demand Zone F reaction price comes down there and then he went up there sweep the available liquidity above that flip Zone real flip plus slip zone is being formed right there and then we got that market shift to the downside right there beautiful sorry so yeah this is where we actually wait for price to pull back to this flip Zone and then that
is where we enter at the edge of the flip Zone itself okay so price goes down okay goes down we are very patient right we are not doing anything we are not rushing to enter for a sell right here because if you enter for a sell like right here your entry is going to I mean your stop loss is going to be all the way up here right so that's not really ideal for us remember we want to get those sniper sniper entries we want to trade with Precision right so we wait for price to
pull back to our desire point of Interest which in this case is a flip plus Swip Zone before actually looking for the entry okay so Leon price goes up eventually pull back up to this flip plus Swip zone right beautifully tap us into the trade place our stop loss Above This flip plus Swip Zone and that is where can Target just three R right just three R which is just just like this okay and then boom price goes down we are in profit beautiful beautiful beautiful people and this trade took a little bit longer but
I believe it eventually played out very very nicely right there right so this one took about a few hours right so this would actually been like a more of like an intraday trade but obviously you could have gotten like a much better entry on the 1 minute time frame and make this like a sculp trade right so let me just show you what that would look like so when price actually step into this point of Interest right what you could have potentially done is to go down to the 1 minute time frame right you could
have refined this flip plus Swip Zone to just this extreme zone right here right you can see you keep it very very refined right there and then you enter when price actually tapped into this Zone on the 1 minute time frame once again same thing you place a stop loss Above This zone right and you just Target wants to the three out which is just like this okay so in this case let's see what price does okay price step us into the trade right there okay you can see this is how we really get those
sniper entries right and price goes down price goes down and eventually goes all the way down to our TP right there okay so you can see this trade was this happened in less than an hour or so right less than an hour we manage to take profit and get the hell out of there right and this is really how you get those sniper entries so yeah you should only do this when you're like quite experienced because like I said if you don't have any experience whatsoever you're do not go down to the 1 minute time
frame because you will literally suffer from all these different Force breakouts and just going to be super dup loss right so don't do that but if you're more like an advanced Trader you know what you are doing then yeah this is where you can go down to the 1 M time frame look for that sniper entry and enter with Precision so what we have on the screen right now is the simplified mechanical trade plan on the right hand side and the charts on the left hand side so usually when I'm marking on my charts I'm
going to be having the trade plan open right next to my chart so I can just refer to it and ensure that I go through the checklist inside the trade plan itself right and if there's a trade that meets the criteria I'll take the trade and if there's no opportunities that I'll just stay out of the market it's really important that you have some form of structure in your trading because if you want to get consistent profits you need to have consistent actions right so having a mechanical trade plan just like this allow me to
trade with confidence Lear without guess work or emotions whatsoever so first of all when we look at this chart on your USD understand that for this simple strategy we are only going to be using one time frame and that is the 15minute time frame so you can see the first step right here is to identify the 15-minute structure and the trend right so we know that price went down pull back and then goes down there and break past that last swing low that we have right here giving us a bearish break of structure to the
downside now once we got this bearish break of structure this is where we can identify our 50-minute swing high and our 50-minute swing low right so this is the 50-minute swing High because this is the highest point that led to the break of structure okay so this will be our new 15minute swing low right here so in a downtrend just like this we are expecting price to break past the low right just continue creating lower highs and lower lows so right now we have identified our 15-minute structure we know that price is bearish and right
now now since price has just created a break of structure we're anticipating price to start pulling back now based on this where is Price going to pull back to okay it's most likely going to pull back to some form of discount and premium pricing okay so let me just change this order right here in the checklist there we go so in a downtrend we expecting price to pull back to the premium pricing and in the uptrend we expecting price to pull back to a discount pricing so now let me just draw the premium and discount
from the swing High to the swing low just like this and you can see right here this is the premium pricing and this is the discount pricing so as usual we expecting price to pull back into this premium pricing since price in the downtrend and then this is where more sellers will step into the market and cause price to go down even further so at this point of time we are still waiting to see what price does we are still waiting for price to pull back to the premium pricing you can see price just consolidating
right here and eventually it starts making that massive pullback into the premium price pricing okay so we check off the second box right here now the third step is to determine where is the available liquidity right so I'm looking at this swing range right here we know that there is available liquidity above every swing high and Below every swing low and in the downtrend just like this we are looking for available liquidity above the swing highs to be swept So based on this we saw that price went down pulls back and then goes down even
further right so this just tell us that there is available liquidity above this swing High itself so that is why I put a liquidity indicator right there to tell me that right now price could potentially come up there and set the available liquidity Above This high before it actually goes down okay so based on this we can also draw our supply zones so this is a supply Zone by itself because at this point of time large amount of Supply step into the market and then there is also an extreme Supply Zone that we have right
here okay so this extreme Supply zone right here is really the last line of defense because it's also our 15- minute Strong high right so this Zone has to hold in order for price to remain barish okay so now we know that there is available liquidity Above This High an additional step would be to look on the left hand side to see where the price spp liquidity previously right so if I look towards the left hand side right here I saw that price went up pulls back goes up pulls back again and then goes up
pulls back and then eventually goes up there and then does like a sharp down move right have like a sharp vshape reaction just like this and this is where we saw price sweeping the available liquidity from these highs right here before we get a strong move to the downside and that strong move led to a break of structure right so based on this I know that this right here price has already swept the available liquidity Above This highs and then Supply step into the market at course price to go down just like this so this
is not just an ordinary Supply Zone this is a high probability Zone because it swept liquidity right so we have determined where the available liquidity is right here which means when price actually comes up and approaches into this particular Supply Zone we want to see this liquidity to be swept first right and just as expected price did not hold at this Supply Zone whatsoever because once again this is where all the retail traders who ENT up for sell right here place that stop loss Above This highs right here so remember smart money need some form
of liquidity before the real move can actually happens okay so now this Zone has been demolished price has came up here and swep the available liquidity that we have above this swing high this is where price has entered into our high property Supply Zone that swep liquidity right so this is a high proper Zone remember we want to preserve our capital for the high property zones we don't want to take trades at low properity zones we don't want to waste our Hoten money on low quality setups which do not work whatsoever we want to trade
at a high property Zone and trade with Precision so the minute price enter into the 15-minute High property Zone that swept liquidity what you could have done is that you have placed like a sell limit order right here okay just like a sell limit order right here at the edge of the Zone itself and then in that case you'll place your stop loss above the zone and then for your take profit you just place it at three R right so you target three r just like this okay very very simple trade right so if you
just go back why one can of stick by you can see the minute price step into this Zone you place your entry limit order right here you are into the trade right so at this point of Time Boom you trigger into the trade right here and then price just starts going in your way and just like this you've gotten out the trade within like 30 minutes or so you have closed the trade with a three out profit literally as simple as that and just like that we have went through all five boxes right and that's
really how you carry out this entire trade process okay so another bonus tip would be to actually go down to the 5 minute to refine your Zone if you want right so based on this you can see right how we draw this 15-minute Supply Zone was that we took this entire range that we have right here but if you go down to the 15-minute time frame you could probably refine this range right here to like this particular Candle by itself right so if you do right look at this you have gotten like a much better
risk to reward and this is really how we get those sniper entries by going down to the lower time frame and refining The Zone making the Zone even tighter so that your stop loss is also tighter as well right so yeah that's that so now what's next right what's next Before I Go and show you more examples I want to explain to you what are the rules that we have inside this simplified trade plan so this is the trade process right here which I've already explained to you and this is the trade management rules that
we have which states that we are taking full take profit at three R itself okay and we are also going for the set and forget method that means we are not trading our stop loss we are not moving our stop- loss we are not taking partial profits whatsoever once we enter for the trade we place our stop loss we place our take profit we just let it run right we trust our analysis and if you look at this trade plan right here the last thing that we have is our what Capital management rules it's imperative
that we have some form of rules to actually protect our downside to protect our Capital right so that we can actually reduce our losses just by reducing your losses you are already halfway there to becoming a consistently profitable Trader so our Capital Management rule states that we are only going to be risking 1% of our total Capital per trade so if we have $100,000 in our Capital that is where we will only be risking one ,000 on each trade right so based on this I will go on to a lot size calculator and determine what
is the correct version size that I should be using based on my stop loss and based on my resp trade the next rule is Max three losses per day right by having some form of Max loss rule this allows me or rather this prevents me from over trading or Revenge trading because the last thing you want is for you to lose one time and start getting angry at the market you start punching your monitor and the next thing you know you enter another lousy trade and you lose even more money and you feel even more
angry and just go into this downward spiral of Revenge trading and overtrading so set a rule to limit the amount of losses that you can incur per day so for me that's three losses right which means I essentially have three bullets per day right so I have three trade opportunities per day if I trade three times and I lose all three times I'm done trading for the day itself I'm going to be closing the laptop I'm going to be going to the gym going for a walk in the park or I don't know just sit
down there and watch Netflix or something if if that if that's the what you like now I also have a rule that says that my stop loss has to be minimum two Pips right so it cannot be less than two Pips the reason being when you are sculping right when you are participating in high frequency trades right you're entering on the lower time frames and that is where you can have like this insane stock loss like for example right here if I entered on a one minute time frame I plac my stop loss like this
right when he so godamn tight you must be very very careful because remember that is a spread that is a bit an up spread that you actually pay to the broker when you actually enter into the trade itself right so by having like a minimum two pip stop loss this takes into account the bid and R spread as well right to ensure that I don't get stopped out because the broker is being stupid so yeah for the of God give your stop loss at least a little bit of breeding room make it at least two
Pips and as for the P that I'm trading I'm going to be trading the most commonly traded pairs EU Au and gu and as for the time this is in Singapore time but this is actually the London session or the New York session itself right so if there no opportunity in the London session sometimes I will trade doing the New York session so yeah that's pretty much the entire simplified mechanical trade plan now let me show you some more examples now after you have got out of this trade right here what I'm going to do
is that I'm going to erase this and I'm going to start reevaluating the situation right so I probably just get rid of all these little drawings that we have right here because I have ch OCD because yeah I'm just a a a tidy freak all right so yeah let's see price goes down okay price goes down boom there we have what do we have we got another break of structure to the downside now the minute this actually happens that is where we know that what is price going to do right now price is going to
start pulling back right and once price starts pulling back that is where we can identify once again our 15 minute swing high right here and then also our 15 minute swing low okay so you can see just by having this mechanical trade plan you have so much structure in your analysis in your top process right so based on this we saw that okay that's the first step under 550 minute structure and Trend cool now price is starting to pull back right price starting to pull back that is where where do we want price to pull
back to actually we want price to pull back to our discount and premium pricing okay so based on this I probably mark up my premium discount from this high to this low right here just waiting for price to pull back to the premium discount there we go okay there we go the minute price put back into the premium discount just like this the minute it cross above the equilibrium right here this is where I can just check the second box third step is to determine where is the available liquidity once again right here look towards
the left hand side right here what do we have price goes down pulls back goes down pulls back and then goes down even further right so there is Swing highs right here so we know that there is available liquidity Above This High itself okay so based on this we can also identify that there is also our supply zone right here and then that is also our extreme Supply Zone same as that the previous scenario that we have right here and and as usual we are not going to be expecting this near Zone to hold because
this zone right here is just for price to smash right through it to grab available liquidity above these highs before price could potentially come into this extreme Zone and then we got the real move to the downside itself okay so let me just remove that once again okay so that is where we can check off the third box now the fourth step is to enter at a 50-minute high prop the zone that s liquidity right so if we look to the left hand side did this Zone swep liquidity yes it did because what happens is
that price goes down pulls back goes down pulls back goes down available liquidity is being buil up above this highs right here for my ugly drawing but you get the point before price comes up there sweep all the available liquidity Above This highs right here before we got a sharp down move that sharp vshape reaction which we love so based on this we know that this is our 50-minute high property Zone that swept liquidity right it's a high property Zone baby so it's time to go all right it's time to go that is where we
want to place our entry limit order right place our sell limit order at the edge of the Zone itself place our stop loss Above This Zone and then place our TP at 3 R right potentially three R right here or in this case I probably just Target like right here at this last swing low right here because we expecting price to take out this swing low as well okay now you can see this is one of those scenario where the stop loss could be a little bit wide right so this is where you can really
jump down to the 5 minute and refine the zone right so in this case IA just refine the zone to like this particular Candlestick like this and I'll place it at the edge of the Zone itself right so how I usually refine the zone is that I just refine it from the entire range to that one single pivot candle that led to that down move okay so based on this let's see what happens next can see right here price come up there tap us into the zone right here tap us into the trade right here
and let's just see what price does eventually price comes down collapsing and boom smash our TP as simple as that guys and in this case this is a one to 4our trade right so yeah based on this you can see we have not utilizing multiple time frames like we usually do we are just using one time frame and just having this simple five-step process it keeps things simple keep things mechanical and most importantly profitable okay so as usual once again after I got of this trade right here just going to clean up the drawings reevaluate
the entire situation and right now we saw that there was another break of structure to the downside right so as you guys know right here we just trading with the trend right we are not looking for counter Trend trade setups we are not trying to buy in a downtrend we are just trading with the trend itself okay so once you just restart this entire process that is why these check boxes are so useful because once you are done you can just uncheck them and then you can just redo the entire process okay so you can
see right here this one was a very sharp one so you can see this one was a very very fast one if you were too slow you have missed it all right so let's just go back a little bit right here and see what exactly happened okay so based on this price goes down pulls back goes down pulls back goes down pulls back so based on this we saw that there was like a little downward trend line right and we know that when there is a trend line just like this that is just available liquidity
being buil up because what happens that all retail Traders they are trading the trend line they are selling right here placing a stop loss Above This High selling here placing a stop loss Above This high so there's a lot of available liquidity above all these highs right here and then based on this we saw that this is our extreme Supply Zone once again that swep liquidity on the left hand side and then this was that that available liquidity right so based on this we are waiting for price to Pro back to the premium discount right
there and this is that particular Zone that we want to enter on and Bam you can see boom this is why you got to be quick you got to be fast you got to think on your feet right the minute you got off the trade just clean up everything and reevaluate the entire situation right don't sit there and celebrate no no no you got to keep going bro you got to make as much money as possible so at this point of Time Boom you could have easily been tapped into this trade Right Here Sell limit
order at the edge of the Zone itself tp3 R right here boom Another Day Another W another day another trade another trade another W within 30 minutes itself you just hit three R just like this what you do before you start trading is actually very important is as important as what you do when you are trading so my pre-market routine consist of me doing TR things and this premarket routine I'll do it like right before I trade or one one to two hours before I trade so I'm usually trading like the London session so it's
probably about 1: to 2: p.m. Singapore time right so that is where I'm going to be doing my pre-market routine so three things that I do is firstly I review my trading plan remember trading is a very boring sort of thing right it's like you have to go through your mechanical rules and you have just to stick with them like that is just the truth of profitable Trading you just need to create mechanical rules that works and then stick to them right so that you don't actually you know regret the trades that you never take
and become a hindsight Trader second thing is that I will actually go look at Forex Factory for any upcoming news so that I can you know prepare myself for it and most likely I will stay out from completely trading news the whole main reason why I don't like trading news at all is because it is extremely volatile and is prone to news manipulation right it is literally the best opportunity for smart money to manipulate your trades so the last thing that I would do is actually analyze and mark up my charts like I said trading
preparation is key right you need to prepare yourself and when how you prepare yourself on the charts is by actually going through the charts going through your watch list analyzing the charts mark up your Market structure your identify overall trend Direction look at the autoflow of the market and looking for any available liquidity for the smart money and stuff and that is what we are going to do right now so just going to quickly walk you guys through my entire thought process when I'm analyzing the charts so as you can see first thing is that
we identify the overall trend Direction on the higher time frame whether it's bullish or bearish and whether price is in a push phase or the pullback phase right so over here on the higher time frames we saw that price was in a bearish out flow right price was just going down here and the thing is this overall trend is like a bearish trend right it's bearish Trend price is going down and we should be potentially looking for any sort of sell but position unless price to get a very strong you know price get to a
very strong demand zone or the point of Interest so the overall trend direction is varish and then you see I mark up my market structure right here break of structure here break of structure here like I said I'm just going to speed run this stuff and then price must be at like a 4our point of interest and you can see price finally get down to this 4our point of Interest I've drawn right here this mon Zone and this auto block right here and take that and I will potentially be identifying any sort of inducements being
formed you know any sort of traps and you can see there's like a trap right here right there some sort of inducement being formed at this area here yeah this is definitely an inducement where price actually come into this Supply Zone and it never Taps into it and instead it just touches it and it start creating that double you know that double top right you can see that being form right here inducement being form there available liquidity Above This highs right there so there's inducements and then this is potentially be a liquidity spp in price
where price comes into this Supply Zone and Swip the liquidity Above This highs and then right and we want to see the V ship reaction to confirm that this is a liquidity SHP so I want to see price actually you know sharply mov down and that confirms to us that that is the liquidity Swip and when that happens I'm looking for that market shift you know a shift in structure that tell us that this overall uptrend this little retracement is about to be done and right now price is about to go down right now right
so that would be your Market shift and then I will enter after you know price actually get to like a some sort like a flip zone or something so it like create the market shift right here right so that is what you will look like let me just show you so price will actually potentially create that the market shift right let's say this is the high low and then come down here create a market shift and then you will actually come back up to retrace to the aut block that created the the market shift or
some sort of flip Zone that we have right here and then show momentum and that is when you can enter for that sell and place a stop loss above these highs and take profit at the next swing High which could potentially be right here somewhere right around here and that would be basically my entire checklist all being checked and before I even enter for the trade I will actually quickly go through my entry criteria right so I'll go down to the 15minute time frame and then once I see that opportunity I'll actually go to see
whether that was po inducement being formed that was liquidity sweep and then whether supply has flipped to demand or demand has flip to supply and whether a shiing structural and strong momentum at a flip zone or a block and yeah that is basically how I just went through the entire strategy within like three minutes and I'm pretty sure this three minutes is more valuable than any trading video that you see out there so right now we are actually journaling our trades so like I said just now there's a pre-market routine and then there a trading
routine where you actually analyze the charts and then the postmarket routine is basically what you are doing after you're done trading and believe it when I say that time off the charts it's often more important than time you spend on the charts especially if you get to a a point where you know you have been trading for quite some time now then you do need to take time off the charts to gain more clarity in your mind and stuff so yeah like I said journaling is like a very essential part of my entire process right
so basically what it does is that it helps me to be very aware of the mistakes that I've been committing and basically the lessons that I need to learn in order to grow as a Trader right and I always tell my students or one of the 1% club members that the most valuable information about your trading it is your trading right so if you don't Journal you are gambling because you are just aimlessly charting every single weak and most Traders they don't want to journal because we humans we want to avoid pain right and we
want to avoid the cold hard reality that you know we are still not profitable we are still losing and that is like it's just painful to actually like confront the losses and stuff and actually learn from them right but actually the thing about trading is that like reviewing your trades that is where the true growth lies so you have to review your trades in order to take your trading to the next level and stuff so right now just in the in the works of actually going through the trade setups the wins the losses if I
lose a trade and then I'll just put down like a entry screenshot right there entry screenshot and then also like the reason why I enter for the trade and my thought process when I'm entering and then basically an exit screenshot of the screenshot that I took after I got out the trade and then why I lost and usually it could be du to some stupid mistake or it's like a successful trade because like I follow my plan and trading is like a probability game and I still end up losing then in that case even though
it was was a loss it was a good loss right and to me I will count it as a successful trade in my playbook because I follow my plan I executed my plan and the market is just random and it just so happens that I fell on the wrong side of the market right it is what it is we move on to the next trade and then we're going to go on to the next day and just continue trading you know just just pretend like everything's all good and if I win what I do is
that instead of getting complacent and celebrating my my wins right like this this was the one to five trade on Euro sh right very nice one is the five trade made about I forgot how much I made 5K or 7K but anyways this trade came and it was a very beautiful trade we got a very nice sniper entry after the liquidity sweep you know everything was good happy days and yeah what I do after the win is that I just think about how do I replicate this win again so that maybe so I could like
maybe like repeat the same trade when I see a very similar setup or what I could have done better right because I always think that whenever I win that it's always that one tiny thing or that 1% that I can improve on yeah so I just thinking about how I can do this batt and that really allows me to transcend as a Trader right allows me to really grow a lot as a Trader yeah so that's the importance of journaling and this is usually what I do after I am done trading for the day right
so bear in mind this is the essential if not this is like the crucial part of your entire trading journey and yeah like I said this is where your the true growth lies so go out there and journal even though you so go out there and journal especially if you do not feel like doing it because that is where the true growth lies and that is where you are able to improve your Edge as a Trader and actually you know get better and make more money and eventually you will get to the point where you
are consistently profitable and you will only get to that point once you have built the enough self-awareness of what are your drawbacks as a Trader what are your weak and formulate a plan to actually overcome this weakness all right yeah so in addition to journaling and actually reviewing my trades after I'm done journaling right what I also do is that I do this monthly and quarterly and annually review right which means I review my trading performance every quarterly so right now q1 just ended right so q1 was January to March it just ended recently and
I recently did did like basically like a entire quarterly review where I actually look through you know all the monthly reviews for January February and March and then I compil all of them into the quarterly review this is the the q1 review right there you can see our net profit was about plus 10.7 r not too crazy right not too crazy but it was just like a rough start to the year so yeah 10.7 R is not so bad and then what drives you to succeed as a Trader for me is my parents and impact
you know the 1% Club because I believe that the more I improve as a Trader the more our students improve and the faster everybody get results so I basically write down things like what have I done this quarter to actually improve my trading performance what are the major lessons that I have learned things like Capital preservation using trade management setting realistic profits avoid low property setups you can see right here major lessons I've learned in gen so uh I basically do this like trading performance reviews because like I said I want to be a professional
here which means that when I am trading I want to make sure that I can you know get better as a Trader and how are you going to get better if you don't really understand your trading performance right how are you going to even get better if you don't understand you know what are the things that you can do to improve on what are your strength what are your weaknesses you know it could be what trading strategy that you are using maybe you need to switch to intraday or swing trading which could be more suitable
for you so it's really all about like thinking about how you can optimize your trading or rather your entire performance like trading performance or rather for me I optimize my entire life to make sure that I'm like the best Trader in the world right to make sure that I reach my fullest potential as a Trader and it comes down to things like the Sleep Quality you know whether I exercise whether I have a clean diet so I can think with a clearer mind so I don't have brain for and all this stuff yeah so all
of these things are things that I really do to do like you know just optimize every single tiny part of my life so that I can succeed and I believe that is what it takes to win so the question comes do you have what it takes to win right because like I said trading is a zero sum game right you can either win or you can lose and chances are you do not want to be the losing one you want to be a winner right we all want to be winners we all want to you
know stay in nice penth houses with a beautiful view and make money get jacked get women get status you know we all want that stuff so do have what it takes to win because what it takes to win is to actually reviewing your Trading performance and continuously optimize and your trading performance it could be things like refining your entries and exits to make it even tighter so they can have the higher risk to drop ratio higher win rate so you go on to the community you see our students sharing their certificate their funded certificate they
getting their first payout second payout they're making thousands of dollars and you sit there wondering what the hell are these certificates why are they getting so much much money and it's all because of pro fir all right hear me out right I'm just going to explain everything from the start so that you as a beginner to prop firms we understand how the entire process is going to be like first of all you need to understand that in trading you need money in order to make money I know this might sound obvious right now but most
Traders they don't really understand this they still think that it just comes out from thin air and just like fall down from the sky magically no you need money in order to make money which means that if you are trading with $100 account how the hell are you expecting yourself to make $5,000 tomorrow it doesn't work that way or if you are trading with $5,000 how can you expect yourself to make $50,000 tomorrow once again doesn't make sense you need a large amount of trading capital in order to get a large amount of profits if
you are trying to follow the risk management rules so most Traders they suffer this tragedy called under capitalization and it basically means that you like sufficient Capital that's what it means right very simple most retail Traders enter the market under capitalized which means that they don't have enough trading Capital to trade with in order to make a leing from Trading example today you venture into trading and you have quit your job you want to pursue this fulltime now remember you still got your bills to pay you still need to pay your mortgage AG you still
need to put foot on the table right so if you are trying to make a living from Trading you should be at least earning $5,000 to $10,000 per month at least if you want to make a leing from Trading and you cannot make $5,000 or $10,000 per month if you are trading with a $100 account if you are trading with $1,000 account doesn't make sense whatsoever if we are trying to follow our risk management rules which is no risking no more than 1% per trade and right now you are are trading a $100 account that
means if you risk 1% that is what $1 and you are potentially risking $1 to make back $3 $5 how are you going to make a leing when you are trading with such a small amount of money doesn't make sense whatsoever right that is why I say that most of you guys are under capitalized most of you guys are broke right that's the go hard truth if you are broke then you are expecting yourself to generate consistent income as a full-time Trader it's not going to work out as so result they end up taking on
excessive risk on each trade in order to get big returns right next thing you know you are trying to flip this $100 to $11,000 because you need to pay your mortgage and as a result you B like a standard lot size right you Bor a trade that is way too big for your account to handle all because you are focused on flipping the account you're trying to make as much money as possible now if you're able to trade with a larger Capital it'll be so much easier for you to follow your risk management rules and
as a result trade with more peace of mind right just think about it if you are trading with $100 account and you risking 1% per trade that is $1 if you are trading with a $100,000 account and you are risking 1% per trade that is $1,000 which means you will potentially make $2,000 $3,000 $4,000 $10,000 on a single trade and you can see the risk management rules is the same we are still risking 1% is just the difference in the account size you are trading with a larger Capital as a result you are able to
make a larger amount of profit it also allows you to endure losing streaks and give you a higher chance of surviving long enough so you can actually experience those winning streaks right when you are going through a slum uh a bad week guess what you're going to take a bunch of losses and if you are trading with like a $100 account and you are over risking you're overleveraging is going to take you like a few trades and then you're going to blow the account right so having a larger Capital allows you to really have more
room to play with and as Traders like I said we want to play the long game right we want to focus on Capital preservation as a result then we can finally make profits yeah so having a large am of capital give you more room to brief and it give you more safety net so to speak so a propriety trading firm is basically a company that provides Capital to its Traders in exchange change for a percentage of the profits that they generate with the company example if a prop firm give you $100,000 to trade with and
they ask for a 6040 split that means they could potentially take 40% of the profits that you have made and then you get to keep the remaining 60% that's what it means so examples of platforms are funding Pips Alpha Capital group fund and fdmo and once again there's a lot of PLS out there that is potentially like 50 more or something 50 more platforms out there to trade with right but these ones right here are the ones that we personally recommend the ones that our students most commonly use right ftmo funex Alpha Capital this three
actually right so if you have to choose one if you are asking me for a recommendation I would say go with fdmo because this is always the most legit is the most wellestablished and it's the most trustable and safe one that will not go wrong yeah so fdmo so the rise of PLS lately have allowed retail traders to gain access to a large amount of trading capital from $110,000 to over $400,000 yes you had that right you could potentially trade half a million dollar or you can even scale it up to a million dollar in
trading Capital imagine trading of a million dollars right if you RIS 1% that is what how much is that that's is that like $10,000 yeah that's like $10,000 per trade yeah so yeah really by having these PLS it's kind of like a blessing in these guys in the sense of the fact that yes it's providing all these retail Traders with a large amount of trading Capital but the thing is these PL Firs if you want to join them it's not easy I'm going to explain more about the rules later on right obviously the prop foms
will not give you the money immediately because you have to prove your worth by showing them you actually know what you are doing before they will entrust you with a large sum of capital right they are not stupid they are also investors right they also want to make money so that is why when you join them right they expect you to be somewhat profitable already so that you can actually generate profit and then they get a percentage of the profit split therefore you will be put onto a test before you can officially join the program
and receive funding right you have to go through a test not just one time but two time once again I'll discuss more about this later right for now let's just quickly look at some pros and cons of prop fir right so uh the pros is obviously more Capital equal more profits right like I said trading with a $100 account compar that to trading with a $100,000 account you are definitely going to make the more amount of profits because you're risking more amount of money and there is limited downside because for PL Firs right when you
lose money you are not liable or accountable to the losses that means that you will not lose $5,000 or $10,000 on your trading Capital no it's their Capital that you are losing and it doesn't really affect you whatsoever they are not going to come after your ass and sue you whatsoever no they are liable for all the losses right so that give you a limited downside the only Reas that you have is the up fund fee right the up fund fee which I'm going to talk about later lastly access to useful resources like causes journal
and tracker right you are able to get access to Cutting Edge technology where you know you are able to track all your trading data all the trades that you have taken in one place yeah so this is very useful as well now the cons is obviously the upfront fee right so when you join the prop fir right actually before you officially join them you have to pass a test in order for you to even qualify for the test you will be required to pay a small fee right so example a small fee could be okay
if I want to get a $100,000 funding I need to pay about $11,000 okay that's just for me to enter into the test not even for me to pass the test and receive the $ 10000k no just for me to enter in the test so if I fail the test I will lose the $11,000 that I gave them if I pass the test they will refund me the $1,000 so technically it's kind of risk free right but obviously there is always the risk that you are going to lose the the fee if you are a
bad Trader or you are not consistently profitable and you just and are breaking the rules once again we'll discuss more about this later and there's an increased pressure from hitting the profit Target yep you heard that right there is a specific percentage or rather a specific Target that you need to hit every single month lack of stability since you can lose your funding if you break the rules right at any point of time they have the power to actually remove you from the program and take away your funding right if you break their rules you
lose too much money you underperform they will just take you out right so there's lck of stability right there okay if not let's go and learn more about the rules of PL forms and how it actually works and we are going to look at fdmo because that's really the the most trusted platform out there right now okay so you can just search uh Google fdmo just search online and then you can just find the first option this is it right so yeah once again has been established for over 10 years now right almost 10 years
right now so yeah Master trading skill blah blah blah okay cool let's scroll down and let me show you guys what we got right here these are the trading objective that you need to meet first of all you can see you can choose the balance right how much funding do you want do you want $10,000 in funding or 25k or 50k or 100K or 200k you can choose them right obviously you can see the refundable fee that I'm talking about the upfront fee that you have to pay them in order for you to qualify for
the challenge is going to increase the higher you go right so you can see 10,000 is about €89 €200,000 it's € 1,080 100,000 is about € 540 right so yeah I can see there's different price point for different funding obviously 200k it requires at least 1,000 bucks is quite reasonable honestly yeah but let's look at this uh by the way you can change the currency right here as well right let just stick to USD Okay cool so let's say today you decide to get funded with 100K because you want to be a six figure funded
Trader all right so in that case first thing you need to do is to go and buy the challenge right so you go here start fmo Challenge and Bam you'll be directed to like some sort of checkout link where you have to check out and pay them € 540 once again this is not so that you can get the 100K no this is just for you to qualify for the challenge if you pass step one and you also pass step two and then you become a fdmo Trader that is when you finally get access to
this 100K okay so let's go through step by step let's look at step one first okay so after you pay them the $540 you will be given metat Trader for loog in details or metat Trader 5 right login details uh you know you type in your your password all that stuff and you will be required to actually connect your meta Trader for to dial broker once that is done that is when you can start going right start attempting the challenge right so that is the first thing that you need to do is to attempt the
fdmo challenge right so doing this challenge phase once again the trading period is unlimited right which means you have as much time as you need to reach your profit Target and the profit Target is basically this one right here so in order for you to move on to the next phase you need to make $10,000 so if you look at this this is $ 10% of 100K right so if you're thinking in terms of percentage your goal is to make 10% and once again they didn't limit the amount of time right they they they they
they give you that breeding room last time we didn't have the breeding room last time if I uh was going to get funded right I needed to make $10,000 within 30 days right so nowadays it's like much more easier right but now yeah unlimited like I said you can take as much time as you need to reach your profit Target okay cool okay next is the minimum trading days right four days right you must trade for at least 4 days during the current duration cycle at least one position must be open on each of these
days a trading day is defined as a day when at least one trade is executed if a trade is H over multiple days only the day when the trade was executed is considered to be trading day I believe this is very self-explanatory you basically just need to take a trade for 4 days and it doesn't have to be in a row it can be like any four days next is maximum daily loss right so this one is there's a little bit of formula behind it right so your maximum daily loss is 5% right you can
see 5,000 that is about 5% of your initial account balance yeah so this is the formula results of your Clos position of the day plus the result of open position this is very important a lot of Traders neglect this right now here's an example right here initial account balance 200k max daily loss limit is $10,000 if you happen to lose $8,000 in your closed traits your account must not decline more than $2,000 this day it must also not go $2,000 in your open floating losses and this includes commissions and swamp now you can see very
important it doesn't just include the Clos trades right so in this case right here on the 100K account let's say you lost $4,000 today and right now you still got two trades open right now those two trades it cannot go into a draw down of more than $11,000 right that means it cannot go into negative uh 1,1 1,002 once that happens bam you're out you're out of the challenge and you lose your refundable fee and you fail this Challenge and yeah you are out yeah so that is a rule and they also mention that okay
if you profit $5,000 in one day then you can afford to lose one uh 15K so you can see the profit whatever you have earned it give you the extra buffer to play with yeah but once again just to remind you Max day loss counts your open trades as well by the way this one resets at midnight yeah Central instant time yeah so take not of this okay so that's the maximum daily loss rule that is why inside the Capital Management module I asked you guys to risk 0.5% right when you risk 0.5% it's much
more easier for you to actually pass this challenge compared to risking 1% because you have more room to play with you have more buffle okay next rule is maximum loss be mind this is maximum daily loss right so this is the maximum amount of money that you can lose on particular day within 24 hours itself before the midnight central eastern time okay next is maximum loss now as for your maximum loss this is the total amount of money you you can't afford to lose during the entire duration of your challenge okay basically your account balance
right it cannot go below $90,000 that's it right that's the bare minimum right it cannot go below $90,000 once it Go below $90,000 you out of the challenge yeah so that's for maximum loss right once again this very self explanatory yeah Equity must not at any mov during the account duration decline below 90% of the initial account balance right you can see yeah 100 K the lowest possible Equity is 90k right if you go below 90k no goal and once again this is also including the open position as well same thing as the max daily
loss it takes into account the draw down as well right how you calculate this is the same as the max daily loss it's just that this one is not limited to one day but the entire duration of the testing period yeah once again includes the commissions and Swap and yeah next is the profit Target like I mentioned is $0 % right so you need to achieve 10% in the challenge phase right in order for you to move on to the next phase yeah so you must make $10,000 in profit right here okay after you complete
the first test let's say magically miraculously after you have follow our mechanical trading plan you have used our exact funding blueprint right to get funded that is when you pass this first phase you make $10,000 and you move on to the next phase before I move on I just want to point out the fact that for the profit Target right different platform have different profit Target in this case fdmo requires you to make 10% but right when you go on to fund the next another platform and you scroll down you can see that this one
the profit Target is 8% that's the difference you can see different platforms have different profit Target ftmo require you to make $10,000 well fundex required you to make $8,000 8% right and you can see the minimum trading days is also different once again different PL Firs have different rules all right take note of that okay if not just get back to this so yeah phase one you have made $10,000 congratulations but that's not the end that's only the beginning you move on to the next phase step two this is the verification phase once again if
the if you look at the rules it's the exact same rules as step one it's just that now they make your life easier by requiring you to hit the profit Target of 5% right so instead of 10% you just need to repeat the same thing and just hit the profit Target of 5% right and once you're able to hit that profit Target of 5% that is when you finally pass phase one phase two and you move on to get funded and that is when you will gain access to the $100,000 in trading Capital cool congrats
now you're fmo Trader your job right now is to maintain consistency is to maintain that funding and not lose your account because bear in mind there is still certain rules right there is still the $5,000 max daily loss there is still the $10,000 ,000 maximum loss if at any point of time you break either of this rule right here you are still going to lose your funding once you have made it pass these two phase right your refundable fee this fee that you have paid them at the start you will be refunded to you yeah
you heard that right so so you pretty much got this entire challenge for free now for the mindset part I just like to split into two two things right confidence and discipline you need the conf confidence to execute your traits without hesitation reservation or fear that's very important and how do you gain that confidence it only comes from competence when you have a proven Edge that actually works you have back tested it you have forward tested it you have tried it on your life account then we know that it works yeah so once again actually
go through this well uh inside the systems and processes model we talk about how the back test forward test everything yeah so that is how you gain confidence like I said you will not get confidence by shouting affirmations in the mirror or even by reading the Alchemy yourself 2.0 right you will not get confidence by reading oh I'm a professional Trader oh I can make money trading is easy it doesn't work that way you need to put in the work and that's how you really build confidence next is discipline as for discipline I like to
split into three ways discipline is important not just when you are trading but before you trade during your your trade and after you trade so before you trade you need the discipline to go through your trading plan right go through rule by rule and then you also need the discipline to actually create the trading plan in the first place or even decide which trading session to trade and stick to it and then when you are trading you need the discipline or rather the patience to wait for price to get to your point of Interest your
supply and demand Zone wait for price to sweep liquidity right to tell some sort of signs that the smart money the financial institutions have enter into the market very important so yeah and after you trade the discipline to journal your trades right Journal your trade review and record your trading data find out what works what doesn't works so these are the four main things right like I said you need to have every one of these if you don't have any one of this don't try to get funded all right don't try it's just you wasting
your refundable fee and it's it's not cheap right let's on $600 is not cheap for me I fil like four funded accounts in my first two years before I finally passed one yeah and then once I passed that one I I lost it like within one month yeah so funding Challengers it's not easy right by by no shape of form is it easy it's very difficult honestly yeah but like I said if you follow this group print it will work okay next is tips and tricks to achieve funding now here's are just some tips like
I said pchas a funding account with a refundable fee that you can afford to lose so like I said man if you cannot afford to lose $600 maybe try to get a 10K account or even a 20K or 50k account right which cost like I don't know a few hundred or less than $100 yeah and only take High property setups and always look for confirmation so let's say price is going up like this and then then first things first identify what phase of the market is in right is it in a pull back phase or
is it in a continuation phase so after a break of structure we know that price will start pulling back we don't know where exactly but we know it's going to happen soon and what I like to do is just look towards the left the left side of the chart see if there's any unmitigated Supply or demand Zone okay once we see price entering into the Zone anticipate not really anticipate but kind of like know that price could potentially pull back soon okay so okay now we know that price is a pull back phase right so
so like I it's very simple it's either in a continuation phase or the pull back phase or just like a consolidation where price is going sideways right there is no alternative it can't fly it can't do anything else it's just up down sideways that's it right identify the trend Direction mark up your Market structure do a top down analysis mark up your point of Interest the next step is to just wait for price to get your point of Interest right depending on what type of Trader you are are you a scalper if you're scalper then
in that case you'll be analyzing the charts on the 4 Hour the daily no 4 hour and 1 hour and you will be marking on your point of interest on the 50 minute or even a 5 minute and then you wait for price to get to your 5 minute or 15 minute point of interest and then go down to 1 minute to execute your trades basically once you mark a point of interest you just wait for price to get your point of Interest that's my plan right so for me I'm mix between intraday and swing
trading right so I'll just mark my point of interest on the 4H hour the daily and even the 1 hour time frame and then I'll set alerts right you know trading view got a function to actually set alerts and what what price point you want price to go to and then you will trigger the trade the alert right and it will send you a notification in SMS or email yeah so set alert at a point of interest and do nothing do nothing go about your day go gym go interact with your family you must understand
that why do you start the trading in the first place is for Freedom you are not here to stay at the charts all the day I mean you can do that but I believe San know that is this Des to do that you make money in the agan session you give back the profits they you make in the London session and then New York session you lose even more money so it's about finding the sweet spot right so like like I said I always preach that just focus on one trading session be London New York
or Asian yeah so once price get to the point of Interest trading view s me alert okay cool Brett go and analyze the charts all right cool it's usually around London session I'll get the alert right if it doesn't happen if I don't see my trading opportunity doing the London session I don't trade yeah I don't trade what if you know price doesn't reach your point of Interest doing the London session and it reaches doing your New York session cool you can take the trade but for me personally I don't do it because I like
to stick to my plan and another thing is like I said you just need data if you have the data to actually back up that okay London session and New York session both works fine for you then you can do that like I can say okay yeah just s the trading London session but doesn't make sense for a swing Trader you know you're a swing Trader depending on what time of the day maybe the price goes in the point of interest in the agent session is it'll be kind of stupid to not take the trade
as well if it works for you right yeah like you're are taking a swing trading approach you know price doesn't really go to your point of interest in the London session even though your plan says that you should trade the London session I will advise you want to trade both or do what you do basically whatever price get to a point of interest you enter the trade do that for one month build the data right once you got the data to actually back up that okay that actually works then yeah stick to it by all
means yeah because I think is everybody's trading approach is different right there's no one size fits all when it comes to trading once price get to your point of interest you know your alert sets off what next you look for your entry model on the lower time frames be the 15 minute or the 5 minute or the 1 minute whatever time frame that you're entering the trade on look for entry model for me this is where I get my confirmation now remember once price get to my point of Interest I don't want to enter yet
because there is a chance that it is not a high probity point of interest and there's a high chance that it might fail price will just blast right through it so that is when you guys learn about RIS entry and Confirmation entry RIS entry is you you place your your limit or order at the point of Interest once price step into that you are inside the trade confirmation entry is you wait for price to get to the point of interest and then you still wait for your entry model to form before you actually get in
for the trade confirmation entry will always give you a much higher win rate because you get the extra confirmation yeah so as for the confirmation once price get a point of interest you look for entry model there is three confirmation I'm looking for First Things First Market shift Market shift is goddamn important I can't emphasize how important it is because it shows you that there is a shift in orderflow of the market whether price is going from bullish to bearish or whether demand have stepped into the market or Supply is still overpowering the market market
shift second thing liquidity I need to see some sort of liquidity Swip and when does liquidity Swip usually happen either the London Q zone or the New York Q Zone either of these Q zones yeah so that is when you able to find the most amount of trading opportunity especially if you're sculping yeah so those are the two main confirmation for now it's just liquidity and Market shift and as for the entry model I believe you guys have seen the six entry model right that's like the flip Zone flip plus Swip Zone all that stuff
yeah I'm not going to B you guys the details okay so yeah that is what I mean when I say high propy setup High propy setup is basically a setup that aligns with your trading plan and for me I sometimes like to add the extra criterial where I have to look for confirmation next is fully accept and embrace the loss or risk including the challenge fee what does it mean to fully accept and embrace the loss I believe Sanji talk about it a lot just now yeah you got to fully accept it no no it's
not just about knowing that losses are good it's about really accepting the fact that you will suffer losses it is inevitable even professional Traders h funds they still go through losing streaks they have down months they have down quarter it is completely normal it's really what you do during this losing streak because the hard part about losing is that when you lose you're not just losing your own Capital you are losing a little bit of your confidence to execute the trade that is why after you you lose a bunch of Trades the next trade you
see that lines up with a trading plan you don't take it because you feel like this fear this hesitation you know the solution is very simple every single trade idea is not related if you flip a coin you will never ever know whether it's going to land on hits or tails right you never ever know the sequence of the trade outcome whether the next one is going to be a win or next one is going to be a loss so what you can do is to just execute your plan and if you have back tested
it you know you have like a solid win rate right like 70 not 7% but like 30% to like 70% or 80% that's good enough right you know that you will be profitable in the long run so that is where you really fully accept and embrace the loss and the risk because you know that every single loss takes you much closer to a win next is journal every single trade both loss and win yeah just joural honestly just Journal like I said it's it's really really building the data and just think about how good you
will be three years down the road you look back on your trading journal and you see like the stupid beginner mistakes that you committed 3 years ago it's it's a gorgeous feeling right sometimes when I look back at my trading journal I see notes from like 2021 2020 and it's me like overtrading Revenge trading and emotion trading all the stupid beginner mistakes and I just look look back and and just appreciate how far I've came because like right now I know that I don't feel these emotions anymore and that's the thing about emotions you start
to get numb to them when youve been trading for so long you have you start to get desensitized to the numbers the profits and the loss that you see on the screen okay cool if not we can get back to the funed strategy I've drawn a little diagram right here now what this diagram shows is that okay right now this is where I start right if you join a Prof firm you want to get fun with 100K 200k whatever it is first phase is usually the funding phase yeah funding phase and then next one is
the verification phase or something yeah but anyways first phase you are required to reach a profit Target of 10% right which means you need to make 10% and right now there is an unlimited amount of time for you guys to reach that profit Target back then we didn't have that privilege we have to reach that % in 30 days yeah that was at a yeah quite quite a few years ago yeah so 10% unlimited time right the key point is unlimited time that means you don't need to rush right be very patient wait for price
to reach your point of Interest execute okay so this is the strategy in order to reach the 10% Like I said it's not easy right it's very difficult to actually reach 10% but like what I say in self Transcendence your Paradigm literally detect everything right if you think it is difficult it's going to be difficult if you think that trading is a scam you're going to self-sabotage yourself if you think that trading is easy you put in the effort to actually do it and learn and master the craft so it's all about Paradigm like I
always say your belief leads to your actions and your actions lead to your reality yeah so Paradigm very important but most important is really the strategy so for this funded strategy that you will learn it doesn't require you to have a high win rate you don't need to have like a 80% win rate or 90% win rate you just need like a 30 or 30 to 40% win rate right which means out of 10 trades in a row you are winning about three to four trades don't need High wi rate so it's very doable for
each and every one of us here so the minimum of R multiple on each trade is 1 is three I actually recommend you guys to strive for at least one is to three but aim for one is to five always aim for one is to five is to Rod never settle for one is to three but this is really the bad minimum right like if you have no choice one is to three is the bad minimum very simple we do this because we always want to ensure that we are getting back three times more four
times more or five times more on what we are risking so first things first you have your strategy knil down like I said before you get funded make sure that's your Edge and really make sure that you have a proven Edge before you even try to get funded but once you got that sorted out next is the risk management once again this is where majority of Traders fail right they are not able to nail this part down right so this is where I want you guys to risk 1% until balance gets to 98k or 105k
okay there's a rationale behind this it's going to make your life a lot easier like I said just now we will suffer losses it's part of the game is you cannot avoid it you will suffer losses let's say the first trade that you take you're unlucky or maybe you you disciplined you execute a trade but you still suffer some form of losses so you lost the first trade all right cool so you're down 1% on the first trade they take okay cool do you give up no it's part of the process we have learned that
right so what happen next is that let's say you still are going through a slum like a losing streak or something you lose another 1% okay now now remember every time you lose it's harder to get back to break even it's always going to be harder to get back to break even okay so you lose 1% you lose another per. okay cool now we are at 98k now we have lost 2% of our trading account this is where you start to deis you decrease your risk from 1% to 0.5% now the reason why we do
this is very simple remember this is your room to brief right this is essentially the amount of bullets you have if you raise 1% per trade you have 10 bullets before you get out the challenge so once we get down to 98k let's just put this uh -2% right there stop to deris right St to deris and drop your risk down to 0.5% so inste in of risking 1% per trade you risk 0.5% on each trade okay cool 0.5% next trade bam you still lose it right you seem to be going through this slam you
don't really know what you're doing it's okay it's okay we can recover back from this because right now you're only down - 2.5% right and it's recoverable right negative - 2.5% we can we can recover it we just one trade with a one is to three R this is why we do what we do with just one trade you're able to get back to break even and actually get a little bit of profit 0.5% so I believe if you use our trading strategy you have lost three trades in a row you are most likely going
to be more cautious on the setups that you take and you start taking High propy setups right you you finally start a sh together it's not taking hype of these setups as result the next trade you RIS 0.5% because we have D RIS remember we have D RIS so you win the next trade okay you win the next trade so that's about 0.5% and it's a three yeah it's 1 three so it's 1.5% so right now you make about 1.5% you went from -2.5 to1 what do you do right now right now the balance is
99k you go back to risking 1% because as long as it gets below 98k you der but right now you're back to 99% so you can R 1% let's say for some reason you reach 1% here it doesn't work out you lost this range right so 1% now you're back to -2 2% okay cool you're back to square one right you're back toga 98k same thing continue to deis back to 0.5% right so we back to 0.5% that's you want the next rate okay this is like a hypothetical scenario I think this is a very
realistic scenario because you're not going to win every trade but you're also not going to lose every single trade like any guy can just click the buy yourself button and start winning a bunch of Trades yeah you def need to have a trading strategy that's just how much blowing trading is right so let's say like I said you have a solid trading strategy and you decide to win the next trade so right now we are in negative 98k risking about 0.5% and we get back to 99k okay cool get back to 99k and now you
start gaining your confidence your motivation your your ability your morale back okay cool at this point of time you have take five trades let's look at the win rate of this 1 2 3 4 5 you know 1 2 3 4 5 6 okay we take tra six traes what is the win rate okay we lost one we lost another one we lost three we lost one two three and then we won one and then we lost one and we won another one so that's we won two traes yeah and then we lost four like
I said 33% win rate right that's that's what we are aiming for anyways next trade you win next trade so like I said back to 99k you are risking 1% right now so you make about 3% okay 1% okay okay so you at 102k so about 2% right there okay cool so right now you are at 102k you're up 2% but you cannot increase risk rate yet because like I said only increase risk once you reach 105k okay once again next trade let's say you are on a rad you win the next trade okay cool
right now we are at the 5% Mark now okay this can happens in a lot of ways right you can lose the next trade and then go back down but just just just stick to the plan like literally once get below 98k theis if not just continue risking 1% until you reach about 5% okay so let's say the next trade you got lucky and you win the next one 2% you make about another additional 3% because you get a one to three reach to ro right and now you're at 5% okay now you're up 5%
but the profit Target is 10% in the first phase is 10% the verification phase is 5% if you are in the verification phase congratulations you f but you are in the first phase which means you need a 10% right so now to make your life simple this is where you can start increasing your risk from 1% to 2% and I put here optional is completely optional it's really up to your risk tolerance if you want to do this you're feeling a bit of risky you're feeling a little bit of adventurous do it all right I
actually recommend you to do it because what happens when you increase your risk to 2% you win the next trade chall you pass the challenge you pass the challenge just like this that's why I always say you're one trade away you're just one trade away from from winning the trade yeah okay once again this is something optional right if if you don't increase a risk let's say you you don't have to by the way right like you continue risking 1% and you make about 3% on the next trade right and this is if you are
just getting three out on each trade I believe you can get five R 10 R we see some people got one is to 50 r i i i can't do it either for me it's like I need to gain and out for me the max is like 10 yeah so we get back to this let's say like I said you don't follow this you just continue risking 1% so recover this you just continue risking 1% okay you it might take you a little bit longer but like I said what is you you get 5 R
what if you get 5 R in the next trade like I said you aim for 5 R right you pass the challenge as well right you RIS 1% you make 5% so yeah I'll leave it up to you optional but I actually recommend you to do it because it makes your life much more easier cool so that's about the first pH that's the 10% right the yeah the first one the next one is 5% dude the next one is 5% so use the exact same strategy you don't deviate from your plan your plan works just
stick to it the verification pH is the same thing right it's just that it's the exact same rules it's just that the profit Target is 5% yeah so not going to go through it again but yeah you get the G of it just stick to the plan [Music] okay now once you get funded right you pass the first two phases you're officially a funded Trader and you do have 100K in your account or 50k whatever what's next let me tell you something this is only the starts do not get complacent do not get overconfident and
start taking a bunch of low quality trades continue to be disciplined continue to follow your trading plan continue to do your pre-market post market and and your Market routine right continue being disciplined very important because if not at any point of time you can lose the funding your job right now is to maintain your funding right is to ensure that you don't break any rules that will actually cause you to lose the funding and also you are not you know like aiming for unrealistic returns a lot of new beginner Traders what they do is that
after they get funding they try to aim for the moon and try to get 10% because if they make 10% on a 100K account that is $10,000 per month and that's the magical number right we all want to make 10K per month now do not be pressured to do this because if you do that right if you try to rush it and you try to make 10% within one 2 weeks you are going to be prone to taking a bunch of low quality trades and then you're going to lose and then you going to draw
down and trust me going to a draw on a funded account it is not fun right at this point of time your sole focus is capital preservation you should not be worrying about making a down of money no no no you should be focused on not losing any money all right so at this point of time like I said your job is to maintain funding don't break any rules right respect the draw down reduce your risk exposure and I would advise you to aim for plus 5% return per month right don't need to aim for
10% no no no just just aim for plus 5% this is very realistic and this is very possible I've done it the coaches have done it students have done it very possible right so if you think about it right on 100K account if you make 5% per month that's an additional $5,000 in income and that's on top of your current job right now maybe let's say you working and you're making $3,000 per month if you make 5% per month that is $5,000 in additional profits right so that's just something good to have right don't need
to aim to make 10K per month right I would say the problem with this is that like I said you are going to be more emotional you are going to deviate from your plan more because you're obsessed with the money when I always say focus on the process of becoming a good Trader because what happens when you become a good Trader when you become a better Trader that is when you can start to scale your account all right that's why I say if you want to make more money right you want to make 10% no
no no the problem is not with the returns it is your Capital you are still considered as under capitalized if you are trying to make 10K per month in that case you need to focus on getting more Capital rather than risking more but trade or aiming for unrealistic returns right so in this case let's say this is your first 100K account right and then you find that of $5,000 per month that's not enough I want to make 10K per month I want to scale right in that case don't worry about that first maintain your funding
right at least try to be consistent on this existing fun account for a few months right two three months before you attempt another 100K challenge right and what I would advise you to do is to reinvest your profits right take the profit that you earn from this funer account the payouts and go and purchase another funding account that is when you can really start scaling your trading account right so once that is done you purchase another 100K account and then you bu the two phases because you follow our risk management strategy you follow our mechanical
framework bam you got two 100K in your account right now I mean you have two different 100K funded account so you are managing about 200k in total capital in this case if you're making 5% of 200k guess what is that that is your magical 10K per month right so you can see you're still aiming for 5% it's just that you have more Capital to play with right now right and you are also disciplined right because you don't need to rush to make 10% you just need to make 5% on both of these accounts right so
that is really when you can start scaling right and then eventually you scale all the way up to having 400k in capital the best case is having 2 million in your trading Capital but let's say you really become a professional Trader right you know what you are doing you have good risk management rules in place you have a proven profitable trading strategy you are consistent then you can slowly start to skill to 400k like I said when you're in D just follow the timeline that I gave you in the previous lesson right the funded road
map yeah So eventually you scale up to 400k and make 5% on 400k how much is that that is $20,000 additional $20,000 per month bro at Le of time you are eventually like like six figures Trader because $20,000 and if you make that over 12 months I don't know how much is that that's like 240k yeah and if you make 10K per month for 12 months that is a good 120k so if you can just make 10K per month right you are essentially like the top 3% of Traders already right yeah like I said man
5% per month on 100K account is good enough man that's like $60,000 a year bro that's like additional income so please guys do not focus on you know making unrealistic returns because like I said yes you can make 10% right this might just be a limiting belief you can make 10% but no that it's going to be very difficult to maintain making 10% per month every single month it's going to be much more easier to make 5% per month every single month and also last thing I forgot to mention right is to have a buffer
of 2 to 5% that you leave in your account so they can take losses right because like I said when we are funded officially we want to focus on Capital preservation which means we don't want to risk too much on our trade we still want to continue risking 0.5 to 1% per trade continue doing that just that right now we don't have to increase our worries or or what not so that we can pass the funding challenge because we already got the funds right in this case your focus is to not go below this black
line right here so when you do make profits right let's say you up about 8% over the span of two months right so this is month one and then this is month two now you're up 8% do you want to withdraw all of these 8% you can right but if you do that be in mind your account go back to 0% right and it's going to be easier for you to drop into this draw round like I said this is the zone that we don't want to handle in that case what I recommend you to
do is to have a buffle what I mean is that if you're up about 8% maybe you can withdraw 3% of that profits and then you leave another 5% remaining in your account so that your account balance is 105k at all times right so that you can take a few hits before you drop down to the draw down zone right so yeah that's something you can do have a buffer once again this is completely up to you but I would actually recommend you to do it because if you want to maintain your funding don't withdraw
everything that you have made right leave it to compound also as well and also leave it to have some sort of buffer right that will protect you that will show you from the losses that are inevitable because like I said eventually or at some point of time you might encounter a losing streak if you withdraw all your profits you go back to 0% guess what the losing streak is going to cause you to tremble down and it's going to be quite difficult to recover psychologically right because this is really like real funded account this is
no longer like a challenge account or a verification account no this is actually a fun account so trading psychology is going to be a little bit bit more tough I get more done in one day than most people do in weeks or even months and that's all because of this one thing called Focus every single millionaire out there self-made millionaire has this particular skill they understand the ability to focus and they focus all their energy towards one thing now what does it mean to truly Focus right that is a few ways which I'm going to
teach you how to focus like if you able to get into the FL State and actually does deep work for like 4 hours straight every single day without fail trust me you're going to accomplish a lot in a very short amount of time so basically let's define what is focus first so let's say there's guy a right here and then there's guy B okay so they both are doing the same task right maybe that could be they want to start a business right they want to start a business so guy a right here he spends
probably about 8 hours hours working on the business guy B right here he spends about 4 hours working on the business so like less than half right basically less than I mean it's half right they spends half amount of time working on the same business now here's the differentiating factor guy a has probably like a I'll say like a three out of 10 Focus which means that when he is working he is going on to Instagram scrolling through social media looking through Tik Tok and also going to YouTube and constantly distracting himself from what he
needs to get done which is the business now guy B when he Focus doing this four hours he's extremely focused doing this four hours that means during this four hours he solely focus on working on a business and nothing else he's not thinking about uh what girl he should message on Instagram or what his thinder match message him he's not thinking about any of that he's fully focus on the business so you have like a it of 10 focus it off 10 Focus so in reality if you look at this who do you think is
going to get more done guy a which is kind of distracted is kind of like not really going all into his business or guy B who's going on into his business and he's having like he works less obviously guy B because he's able to focus better so that is what I mean when I say that focus is a multiplier right focus is a multiplier that means that let's say instead of guy a right we switch to guy C guy C he works for eight hours on the same business and this time round he has a
eight of 10 Focus as well he's able to focus solely on the business itself in this scenario right here compare guy a guy B guy C guy C is going to achieve the most he's going to be the king simply because he was able to work more than his competition and he's able to focus better than his competition so that is why it is essential that you actually direct your focus towards the project that you are working on so you can truly outwork your competition and actually win them now now that you guys have understood
what is focus I just want to show you what actually Focus looks like all right so this is your input right so this is your input and all that stuff and then they're going to f it into one thing and this is your focus and then this is your output so as you can see right here this is your input and this is your focus and then this is your output right so whatever energy they can single-handedly focus on it will directly leads to your output so if you can increase your input you can increase
your output and how do you increase your input you can't increase your input because your input I mean you can increase your input by doing things to optimize your time energy and attention but at some point of time these things are limited your time energy and attention these things are limited these things are finite so you will eventually run out of that thing during the day itself and in that case you need Focus to multiply that and compound that time energy and attention once again it's a multiplier focus is multiplier so if you are able
to have a solid input and you times your solid Focus like you actually Focus very very well on the task that needs to be done and then guess what your output is going to be insane your outut is going to be off the charts and stuff so now that you have understood the importance of needing to focus The Next Step becomes how do you actually Focus right let me tell you what what my like schedule actually looks like every single day without fail I work at least 4 hours I have at least four hours of
De work blocks that means doing this 4 hours I'm working continuously focusing on either trading or on the business or making content or communicating with my team members through meetings or whatnot basically every single day I spent at least 4 hours on the business and that's like the low end most of the time I spent at least 12 hours working on my business every single day and I'm at that stage where I could easily just not do anything right I could easily just you know what it you know go for a vacation I'm already a
millionaire so why am I still working so hard it's probably because I enjoy playing the game and I just find that life is just a game and you just have to win it right so that is why you need to be able to learn how to focus because if you cannot focus there's no way you can work 12 hours a day and your competition guys like me who are working 12 hours a day are going to absolutely kick your ass that's the honest truth because the guy who's able to work more than you he's going
to achieve much more than you and you will never be able to reach him he will always be running laps around you so the question becomes how do you exactly Focus right there is five factors five keys that I use to actually amplify my focus and help me to get my ass down on the chair and actually Focus for 12 hours a day just like a millionaire so now I'm going to show you exactly how to do that the first factor is actually your morning why do I put the morning first if you can win
the morning you can win the day the morning is the most important factor inside these five factors why let me give you a scenario this is what I do last time by the way you wake up you grab your phone your alarm rang you hit the snooze button bam go back to sleep and then your alarm ring again after about 30 minutes the time now is 900 a.m. and your alarm was supposed to rank at 6:00 a.m. and now it's already 9:00 a.m. and then you finally decided to not snooze the alarm anymore because you
are finally energized after slipping in after snoozing the alarm so you grab your phone first thing you do you scroll to Tik Tok second thing you do you open Instagram to see what your friends are doing and then you CH upon this girl with beini with her ass checks out and you start to get urge to go to the dirty website so you go to the dirty website and then you spend another one hour trying to find a Perfect Video boys you know what I'm talking about trying to find the perfect video and you start
dispersing the energy boom you just lost your energy for the day how the are you going to conquer the world where youve just lost all your energy in the morning not even at in the day or not even in the afternoon not even at night in the morning the first thing you do is to voluntarily throw away your energy your time and your ATT attention when you start your morning that way you will not be able to focus for the entire day so it is important that you actually win the morning because if you can
win the morning you can win the day right so what does a perfect morning routine actually looks like to me remember a morning is important because it give you or rather it give your subconscious the ability to go and conquer the day it lets your subconscious know that I'm stacking up wins after wins in the morning so I'm going to continue doing that throughout the entire day so this is what I an ideal morning routine looks like to me first things first my morning starts the day before so I would plan the day the night
before right it is very important that you actually have some sort of to-do list right so what I like to do is that the night before I will actually plan up my day and actually write out exactly what needs to be done the next day in order for it to be a fruitful and productive day and that is where I have my get done list right basically I'll try to schedule say that okay I have this meeting that I need to meet I need to uh trade at this particular timing I need to you know
work on the business right so I have three tasks then those are the three tasks that I need to accomplish the next day so I plan the day the night before before I go to sleep make sure I plan the day and then I don't really like to scroll through my phone right before I sleep because it give you like this blue light and it's going to affect your slep quality and it's going to make you much more harder to sleep so what I do is I actually read a Kindle or a book before I
sleep right so that I can really sleep much more better and stuff improve skill Sleep Quality and stuff so I try to get about 6 hours to 7 hours of sleep right 6 hours of 7 hours of qualtity sleep now the keyword here is quality quality slip right ideally in order to get quality slip you need to get into this Ram State I don't really know how to explain it because I'm I'm not a neurologist or whatsoever but you need to get quality sleep and you can get quality sleep by what I do is that
I have blackout curtains so I'll just like completely have a room that is Pitch Black and then my airon is also set at like the perfect temperature which is about 24 degrees CSUS for me right that's that's for me personally it's not too cold but it's also not too warm so that's what I do right to gain quality sleep and I make sure that I try to sleep on time every single night even though it's quite hard but try to have a consistent sleep schedule if you can have a consistent sleep schedule and your a
to have a much more high quality sleep and you're going to wake up with much more energy and much more Focus so 6 hours to 7 hours quality sleep and then some of you out there is going to be taking huh 6 hours but you have to sleep eight hours a day bro how the can you sleep when you are broke I genuinely could not sleep when I was broke when I was poor I would literally kill myself if I sleep more than 8 hours I will feel so shameful because sleep is a luxury it
is not a I mean 8 hours of sleep is a luxury it's not a necessity 6 hour sleep is all you honestly right this yeah I'm not a side this I don't recommend this to anybody who is not a high achiever this is what I do I'm just showing you guys what I do honestly so this is the night right this is the night so this is the moon right so this is at night so I'll probably sleep about 10:00 a.m. I mean 10: p.m. wake up around 5:00 a.m. right depending on what time I
wake up I just make sure I have 6 hours or 7 hours quality sleep once I wake up first thing I do is to actually go wash up right actually wash up brush my teeth wash my face and right just for me to get ready for the day and then most importantly I'll make my bit it is extremely important that you actually make your bait 90% of people don't make their bait because they are either lazy or they're snobs because when you make your bait it acts as like a subconscious win for you and also
at the end of a long day you want to come back home to a bit that is well made right the last thing to do is to come back home and see your bit is Messy as because you don't throw your blanket and then you still had drinks from last night from your one I stand or what not right ridiculous make your bit this is exactly why in the military right we actually make our bit every single morning and I can tell you that because that is what I do back in the military when I
was serving I will make my bed every single day and I could see literally every single one else will be making the bed also because because it is a requirement right to make our bit in the morning because if you cannot make the bit if you can even make your own bit how the are you going to change the world so make a bit in the morning so wash out make my bit and then what I do is I have this two non-negotiable called meditate and visualize right I'll talk more about meditating later because it's
one of the factor to improve focus but meditate and visualize visualize is where I'll close my eyes sit there and visualize myself reaching the goals that I've set up for myself to achieve this year so this year I want to make $5 million so I'll visualize my bank account balance having $5 million this year I want to reach 1 million subscribers on YouTube now I'll visualize my YouTube subscriber count into 1 million and there'll be like a smile in my face right visualize is very important because everything happens twice first in your mind second in
reality so whatever you can believe in whatever you can conceive you can achieve it if you direct all your energy onto the thing on the destination that you want to move forward to so meditate visualize and also make sure that I will drink water right because you have been well as slep for like what 6 hours 7 hours so you need to some sort of water to hydrate yourself once again so drink water and this is pretty much my morning routine if I'm not wrong yeah this is pretty yeah this is pretty much my morning
routine very short morning routine which can be done within 30 minutes right within 30 minutes imagine this guys within 30 minutes you're able to get focused for the entire day and all you need to do is just spend 30 minutes doing these things and you are able to focus your entire day right so that is for the morning and like I said it is extremely extremely important that you don't actually go through the the shitty bad habits right because this is what the how this is how the mind works right so that is two types
of wavelength your chaotic wavelength and your peaceful wavelength so if you wake up in the morning and the first thing you do is to actually scroll through Tik Tok and then you start scrolling through Instagram and then you start responding to emails and then you start looking at your WhatsApp messages and start looking at telegram you start looking at uh YouTube recommended videos and you start viting the Forbidden websites this is what your wavelength look like it's completely chaotic right and when your wavelength is so chaotic you will not be able to move and start
working and when you do actually start working after you did your shitty morning routine which is go through all this bunch of you won't be able to focus on your work anymore because that is how your mind work your mind cannot Transit from chaotic wavelength to Peaceful wavelength if it's chaotic if you start off the day with a chaotic wavelength chances are the whole day is going to be chaotic and the wavelength is going to be up and there's going to be a lot of Chaos in your structure and you won't be able to focus
on your work but however if you do this you will have a very somewhat like a very peaceful wavelength right like a Zen wavelength and when you have a Zen wavelength your brain is not filled with all this dopamine your brain is not filled with all this like degeneracy you will be able to focus much more better and when you're able to focus much more better guess what you're going to make much more money because you're able to get much more work done in a day so that is the first thing I want to talk
about which is actually the morning right morning like I said guys I cannot emphasize how important it is to actually win the morning you need to win the morning because you can win the morning you can win that day so stop being a freaking whip stop being a loser and actually do something in the morning right and by way I forgot to mention but after I've done with this I will do my 4our de book blog I will actually do my 4our deep work blog until about lunch time and then that is when I break
for lunch so that is pretty much how my whole morning goes right so Okay the reason why I want to emphasize on the ability to focus or rather I want to show you guys and prove to you guys that I'm able to focus by making sure I record this whole video without getting distracted and having like a very smooth trend of thought right so the second one is what I CAU your awareness this is the second factor to focus now what the this awareness awareness is the ability to be aware that you're having intrusive thoughts
you know that feeling where you are working and then you start to check your IM inbox and then you start to go through your Spotify playlist and change the music at the point of time you must be aware that you're doing like this and you are not focusing on the work so you can direct your focus back to the work itself that is awareness that is awareness or another thing another scenario is you could be having a meeting with your team members and then start to think about what you should have for lunch later at
the part time you need to direct your focus back to the meeting that is awareness so how do you build this awareness because if you don't have the awareness right you will go through this rabid hole of distracting yourself from your work and I heard this beautiful quote the other day the magic you are looking for is in the work that you are avoiding so if you can just do the work you will be able to feel much more better right and like I said if you don't have proper awareness you are just going to
go through this Rabbit Hole where just constantly distracting yourself with useless and meaningless distractions that does not benefit your life or your business and you're just going to waste a lot of time energy and attention so how do you build awareness by doing this thing called a 10 minutes meditation meditation has been proven and has been tested and we all know that meditation actually helps to improve focus and it actually helps you to build mindfulness and mindfulness itself is awareness right so how do you actually meditate I'm not telling you to shave your head b
or go to the the mountains and just sell off all your possessions and just sit there and just close your eyes and breay to God every single day no that's it's not how meditation Works meditation is actually simple I can't how important or rather how simple meditation is and the thing about meditation is that we all know that it's beneficial for us but we just don't want to do it like just lazy for us to do it right we are just extremely lazy okay so let's just go through step by step all right so first
of all the length of the meditation it could be 10 minutes it could be 20 minutes it could be 5 minutes whatever works best for you if you're just a complete beginner I would actually recommend you start off with 5 minutes and then slowly move on to 10 minutes and then 20 minutes and eventually you can go through like those meditation Retreats where you stay inside the The Retreat for like 3 days and just meditate the whole day which I don't know how people do it but yeah you can probably go try that next time
but you can start off with 5 minutes meditation right make it very simple for you because if you start off with 20 minutes meditation right you're going to meditate for one day like today you meditate for 20 minutes and then tomorrow you might do it again but eventually you'll find it very hard to consistently meditate because that it's just it's just too hard it's just too long right it's 20 minutes it's too long you don't want to do it but if you start off with like a easy 5 minutes meditation chances that you're going to
do this much more consistently day in day out right so start off easy 5 minutes and gradually progressively overload when you are ready to do so so how do you actually meditate it's actually quite simple first things first find somewhere quiet right and just draw a meditation M right here so first things first find somewhere quiet right it could be in the room or can in your living room or it can be in the office partt or whatever it is just find somewhere quiet because the last thing you want to do is to be meditating
at a party right nobody meditate in the club it's extremely stupid so what I need to do is find a place that's quiet and secondly I actually recommend you to get a noise cancelling headphones right this is what I have get a noise cancelling headphone so they can like just shut yourself away from all the distraction and just focus on inwards yourself next sit there right close the eyes close your eyes buddy yeah so actually sit there and what I want to do is to start breathing in start breathing in and then breathe out breathe
in breathe out just do this this is it just do this just sit there close your eyes see find some place quiet and then just breathe in and breathe out and just do that for five minutes but what makes meditation is so hard is because you're going to get intrusive thoughts you're going to start thinking about oh why should I have breakfast later oh uh yesterday I qu with my friends and I said something that I don't mean you're going to start thinking all these intrusive thoughts and that is when mindfulness come in whenever you
have all these intrusive thoughts right you need to bring your focus back to the breath all right it could be the sensation of the air going into your nostrils and coming out of your nostrils so bring your focus back to that or it can even be the sensation of your diaphragm or your stach going in and out in and out it could even be that sensation but basically you just focus on all these sensation and just be mindful and just stay present stay in the present moment so that is how you can really build awareness
and when you are able to do this right you will be able to be much more aware when your emotions come along what I mean by that is that if you're able to do this and be very mindful when you are meditating right you will realize that you are not going to blame yourself for having these thoughts you're just going to acknowledge them and then move on right just okay I see your thought acknowledge it and then move on right there is no point of you actually blaming the thoughts so don't do that just acknowledge
them and then put your focus back to your breath and just sit there and do it for 5 minutes or even 10 minutes and then slowly the key part here is do it for 21 days straight if you can do it for 20 21 days straight you'll become a habit and at first it's going to be incredibly hard let me tell you first I have been meditating for like 3 years right now and at the start it's hard to meditate right it's goddamn hard to sit there for 10 minutes straight if I sit there for
10 minutes straight trust me now this whole 10 minutes I'm going to be either thinking about something or falling asleep I will not be able to focus on the present movement and just focus on breath but right now I'm in my third year and yes I still get thoughts I still get intrusive thoughts it's normal every single human does this but what I'm able to do is to have this awareness to have this space where I can just pause when I have some sort of intrusive thought and then return my focus back to my breath
so that is really how you can build awareness right very very good point meditation there's other ways where you can build awareness like Detachment and all the stuff but really the root of building awareness is really through meditating if you can just do this for 21 days straight I can guarantee you your life will change man your life will transform in a way that could never ever comprehend you'll start to realize that you are actually much more focused when you are working and you are also much more Mindful and present and you're able to be
much more calm and in control of your emotions all of these are side effects that you'll realize only when you start meditating now the third one the third factor is actually your diet now for diet right I don't particularly have like a specific diet to recommend to you guys because I probably never really tried all this Carnival tiet Kettle diet vegan d i I never really try all this all this right what I do is very simple right I eat protein and I eat organic foods I've been doing this my whole life my whole life
I've been eating animal protein and organic foods so organic food can be things like fruits and vegetables right basically a healthy and then animal protein could be things like beef pork chicken right even salmon fish right so for me my diet is actually very simple I eat chicken breast and some vegetable and some rice and some sort of Cups right but the thing is I actually wouldn't recommend you to consume too much cups because when you consume cups right do you realize that it makes you feel very groggy and very like sleppy like it makes
you feel like very sluggish is because you con consume cups that is why I don't really like to consume too much cups yes I will consume cups if I need energy to do so but won't I overdo it right so mostly I'll just be focusing on animal protein right naturally protein sources like your beef your PK your chicken and your salmon and stuff yeah so my diet is quite simple just chicken and vegetable and rice or salmon and vegetable and rice sometimes I have a stick and sometimes I have some FK right but most of
the time just chicken and salmon and some eggs as well guys look at some eggs right so the reason why you cannot consume cups is because that if you consume cups your body is going to spend more energy digesting the cups rather then working you want to direct all your energy into working instead of to digesting whatever that you just just consume for lunch right so no cups or rather not no cups you can have cups but have it in duration don't eat too much of it and also this is a massive noo junk food
processed food canned foods Maggie noodles instant noodles all this that tastes good right just try to stay away from them right fried chicken or french fries all this it makes you a fat and when you become a fat you lose all sort of motivation and you lose all sort of selfesteem and self-confidence so just completely g off all the junk food it does nothing but makes feel good at the moment and fast food is not necessarily fast or cheap you can find food that is cheaper than fast food like chicken and can cook it in
a way where it's healthy right so just get a junk food reason why is another thing same thing as similar to cops but junk food is actually worse than cups right when you eat junk food you not only feel like your self-esteem also goes down because you know that you're not supposed to eat this food but you eat it anyways and you feel like a loser and it feels like a weak and dorsal so get of junk food another things that I don't really like is also sugar right sugar I know if you guys can
see right here sugar let's move this here sugar yeah sugar junk food cops no go sugar because like when you eat sugar it just give you like this energy boost for like 5 Seconds and then you crash that is why there's the THM called the sugar crash or some right basically you feel good for a short of time and it starts crashing and it got to start feeling more than ever and you start to Crave the sugar again and just end up consuming more sugar and crashing and more sugar and crashing so completely diet is
very simple we already know what's the proper diet that we need to eat right we look at the health pyramid and you know the plate sh Show you like the portion that should be eating like this should be the meat this should be the vegetable this should be csri we all know that that is the formula to a healthy diet and a very good health and is able to make you live longer but the thing is we still don't do it we end up indulging in like this which does not actually help you at all
and you're just putting poison into your body now completely just putting poison into your body let stick to animal protein organic food that's it as simple as that keep it as simple as possible no need to complicate yourself and do like ketto diet or vegan diet or Carnival diet right you can go experiment with them if you want maybe it improve your focus but for me I've been doing this and he has made me like a lot of money just by sticking to this diet so I just continue doing this but I know that's one
thing that actually is like my diet hack that nobody actually kind of knows about or nobody really talks about is this thing called intermittent fasting once again I've been doing this for since I was 17 years old so probably about four five years right now I've been doing intermittent fasting and this is where I have a 16 to8 window that means I will only be eating for 8 hours like doing this 8 Hour window I'll be eating and then doing the 16 hours window I'll be fasting I wouldn't be eating anything so for me what
I do is that I will probably eat from 12:00 p.m. lunch timeing to around 8:00 p.m. so before that timing before 12:00 p.m. and after 8:00 p.m. I wouldn't be eating anything I will only be drinking water right the reason why I do this is because it has been proven to actually increase your testosterone and it's has also been proven to actually improve your focus as well right for me I don't really like eating breakfast so this is a good key to me right I don't like eating breakfast because I feel like after earn that
breakfast right you cannot be waking up and immediately you got access to food compared to me I wake up I'm extremely hungry but I just go straight to work and I just get motivated to finish my work so that I can actually consume my lunch at 12:00 p.m. and this takes a lot of discipline to do but if you ever do it you can have a much more clearer and better focus so for diet like I said just don't need to complicate things right you can go experiment with the all types of different diet if
you want but this is my personal diet I just stick to intermittent fasting I stick to a very clean and organic diet where I consume animal protein and organic food and also drink lots of water I drink about 4 liters of water every single day and yeah I try to stay away from fast food and all this unhealthy as much as possible and that is simply how I use my diet to actually Focus right it should be quite simple quite straightforward no jger no fluff no right so next diet morning awareness next I want to
talk about what we call or this is actually one of my principles all in or nothing this seor is what I really have or is like a philosophy that is within me whenever I start any project I have to finish what I started if I start this project to start this business I have to finish the business if I start this gym session I will finish the gy session without missing a single set if I start running this Marathon I have finish this Marathon no matter how tired I am no matter how many blisters are
on my leg and whether my leg can't even move anymore I will still completely This is How I Live all in or nothing it's either I go all in into this one thing or I just don't even start at all this is my mindset and this is the mindset I always translate to my team members as well either you put 100% your effort into something or just don't bother doing it at all right you going to be half this thing and expecting it to actually work you're going to be half your gym sessions and expecting
to become incredibly Jack within 6 months is absolutely delusional right you're absolutely delusion if you can do that so o or nothing means you must finish what you started is to finish what you started so it could be simple things like if you listen to a Spotify song listen it from the start to the end or if you watch a Netflix show watch it from the start to the end or if you read a book try to read it from the start to the end at least read from the start to the end for the
whole chapter instead of reading like halfway through the chapter and then throw away the book and then move on to the next book finish what you started if you can do this you'll able to follow through why is important to follow through is because that most people what they do is that they start something and then they encounter some sort of obstacle or some sort of problem and then they quit and then they will start another thing it could be another side hustle and then they encounter obstacle again and then they quit and then they
start again obstacle again and quit this is the Vicious Cycle because if you think about it this guy just started three things and he half everything because whenever can encounter any sort of resistance actually give up compared to this one guy who actually started this one thing and he focused all his energy into overcoming all the obstacle that stand in his way and he actually don't quit right instead of spending all his time on trying to find the next project to work on he spent all his energy on concurring the obstacles eventually he will win
because he was able to direct all his focus into one thing and he got extremely good at the one thing he's able to eliminate all the obstacles and adversity that he face along the way all the challenges he's able to overcome them eventually he wins so this is what it means or rather what it takes to win to go all in or nothing it's either you put your 100% effort into whatever that you want to start be trading or business or entrepreneurship or YouTube or whatnot follow through follow through all the way until the end
all in all nothing now this is more of a philosophy rather than than like a factor because Okay the reason why it helps to improve my focus is because I know that when I start something right when I start my de work session I have to finish the task that needs to be done for the de book session then that means that during that period of time during that Peri of deep work I will not be distracting myself with temporary pressure or all the instant gratification and useless that does not benefit me at all like
scrolling through social media or looking at my Gmail inbox when I'm not supposed to do so the final factor is your environment now for environment there's two types of environment your physical one and then there's also your electronic environment so I'm going to talk to you one by one first things first your physical one the physical one is very simple look at the table that you're sitting on right now is it messy is it complicated is it filled with coffee from yesterday is it filled with your snacks wrappers all around is it f with like
a thousands different books on your table which you have not read before physical right that is your physical environment it's basically everything around you physical environment right it could be split into two things right basically your work space and second thing is your external environment external environment could be things like you cannot control like right now if you're sitting over here and then there's a window right there or whether you are sitting in front of the window working right and you start seeing a bird flying pass and they got to get distracted by the BL
and then you start seeing your your colleague knock you on your door wanting to enter into the office they get distracted by office in that case that is interrupted work already it's not deep work now that is something that you cannot control I mean you can do things like you know maybe not look at the window like like have some curtains on it and I put like a do not disturb sign on your door or whatnot these are things you can do to actually control your exeler environment now your internet environment or rather your workspace
is basically things that you can definitely control let me tell you something you cannot work if you have a mess desk right now the desk that I have right now is just my laptop and my phone or right my camera and that's it I have nothing else I have no like uh rep snacks wrappers or sweets or snacks on my table potato chips none of that all these are distractions right so remove anything that does not help with your focus so clear out your work space make sure that it is neat and tidy so that
you're able to work better and you actually enjoy working more right nobody enjoys working on a desk which is extremely messy we are humans right now this is for your physical one physical very simple another thing that I'll do is actually my phone right I would not want to have my phone on the table at all on the table is just my laptop and that's it right now the reason why my phone is there is because I'm using my phone as the camera but once I'm done with this video I'm going to lock my phone
up in a coverboard because I don't want anybody to reach me when I am working I want to be extremely focused when I am working because the last thing I want to do is to be working and I have like 10,000 different notifications on my phone ringing every single minute Bing binging binging shut the up so that is for physical environment for electronic environment is basically what you do to prevent yourself from all the distractions for me this is something that's very extreme I delete all my social media if you look at my phone right
even though I'm very popular on all the social media Tik Tok YouTube shots Instagram reals or whatnot I'm very popular on all these platforms you see my videos everywhere but my team handle all of that I don't manually post a single video because my phone does not have any sort of social media not a single social media and when I do that guess what I'm extremely bored I don't even feel the need to use my phone anymore I only use my phone if I need to message my team members or I need to check my
email when I'm outside or whatnot that's the only way I use my phone or even take some photos here and there because I don't have social media on my phone and if I don't have social media on my phone I'm not not going to be impulsively like checking my phone every single minute and that also means that I won't have notification beinging into my phone every single minute yeah another thing is that I have all my notifications on my phone turn off so the only way to reach me is if I actually manually go into
the WhatsApp group and actually look through the messages I didn't have notification on that is how extreme I am but you do have to go at so extreme what you can do is to install like some sort of ad blocker right for me I use opal right I use this app called opal and it's available on the app store by the way you can just download it and then it just allow you to set a time limit to the app it could be you only restricted to use Instagram for 5 minutes and then after this
5 minutes Instagram is locked for the day so you won't really be able to access Instagram anymore right same thing this is what I use for the phone and then for your MacBook or your computer whatnot I believe there's other apps like app blockers as well that is able to help you focus better for me I use things like focus of Freedom right so these app blockers or one of these website blockers will prevent me from visiting websites or apps that I don't really want to visit when I am working because when I'm working I
only want to be focused on doing work and also what I have on my electronic is also things like uh unhook or some I don't know what's the name I think it's unhook it's basically it hies all the thumbnails on my YouTube recommendation home homepage you know when you open up YouTube and you see your homepage it's F like 10,000 different thumbnails with like different colors and it's super like stimulating and you start getting curious you start watching one video on the homepage and then YouTube start recommending you more videos and just continue binge watching
your videos and just end up wasting a lot of time so what unhook does is that it remove the homepage right it doesn't really remove the homepage but what it does is that if you go to your homepage with unhooked on on you realize that there is no videos on your homepage right so they can only use YouTube for business or whatnot right so that is basically your electronic environment right one thing I forgot to mention is that I like to put my phone on airplane mode so that nobody can reach me when I'm working
and yeah if um available then that is when I can turn off app mode so electronic you got ad blockers like focus and freedom and unho and I actually recommend you to have some sort of focus music right some sort of focus music right if you're like me right I I don't really like to work with like very quiet I mean I can work when it's very quiet but I work better if there's some sort of focus music right some sort of B neural beads or some sort of bin. FM music which allows you to
be able to be Focus much more better right it it's probably better if to use this thing if you have like ADHD or some because I think I have ADHD because I I can really focus very very well in that case I need focus music to ensure that I actually drawn out the noise in my external environment actually focus on the work that's in front of me right now on my computer right now and just focus on getting done so yep those are the five ways that you can do to actually improve your focus as
a millionaire these things are what I do on a daily basis and they allow me to work for hours upon hours on end like I can literally work for 16 hours without fail right that is how productive I am and it's all because of these five factors right here so yeah I hope you enjoyed this lesson and just be in mind that focus is extremely important you need the ability to focus and most people don't even have the ability to watch through a long video like this anymore because they are just constantly on Tik Tok
and in the attention span and all these dopamine ad is just going around and just ruining your life so yeah I wouldn't recommend you to or I would recommend you to actually go ahead and delete your social media once you delete social media your life is going to be 10 times better trust me on this the mindset and the habits of the top one% for all 100% Freedom okay think about this is that this is a very some of like a boring topic to teach but it's the most important thing that you can learn as
a Trader trust me this is what's actually made me profitable it's not the trading strategy that actually make me profitable this was the urea moment when I was able to develop the mindset of a top 1% Trader and as boring as this is right I want you guys to focus I genuinely want you guys to focus because I believe that this will have the ability to to change your life and change your trading I've already pretty much taught you guys everything I know about technical analysis through my trading blue 2.0 C and also through the
past two master classes this lesson will be fully focused on the mental part of it right to really sum up these three master classes talk about risk management talk about trading strategy talk about fundamental analysis also the last thing I want to cover is the mindset the trading psychology start so let me just briefly like share you guys my mindset and the habits of one Traders first things first is to lose money lose money yes that's the mindset of a top one person Trader is to focus on losing money and not making money right now
you might be wondering why why would you focus on losing money first things first before you enter any single trade you need to think about okay this is too big let me just let me just say it to you before you enter any single trade you need to think about how much money you can potentially lose on this trade instead of how much money you can make in this trade most of you guys before you enter for the trade you you look at the race to drop ratio you see oh my God one is to
five w sounds good and then we put okay if I uh win this trade I will make $500 but you never ever think about oh if I lose this trade I might lose $500 that is why your job as a Trader is to minimize your loss and you can only do that when you think about how much money you could potentially lose before you enter for the trade and also to make every trade in terms of R multiple now what does it mean to make every single tra are multiple like I said just now just
now do you notice how I talk about my trades I talk about how okay we risking this per to make this per you're risking 10% to make 30% you are risking uh one R to make three r i don't talk in terms of capital let's say you have two guys right here two Traders Trader a make $20,000 while Trader B only makes about $1,000 okay Trader B RIS $50 to make $1,000 right this was a super long swing trade a super high risk to drop ratio trade well Trader a RIS about $20,000 to make $20,000
which one do you think is more impressive Trader a or Trader B the guy who reach 20K to make 20K or the guy who re $50 to make $1,000 obviously this Trader right here this Trader was me was able to reach like a small Capital to make a large amount of capital to RIS a small percentage of their total Capital to make a large return that is why when I say that you should focus on the r multiple and actually look at it in terms of R multiple what I mean by that is that before
you enter the trade always think about how much are are you risking so the rule just I said for you guys is to risk 1% to 2% on each trade so if you're risking one r your goal is to make two r or more your goal is to at least double the amount of money that you're risking at least and that is why the concept of risk to ratio you should aim for at least one is to three or at least one is to two right one is two is the minimum for me is the
minimum if the trade is less than one is to two to ratio I will not take the trade just stay out of the market at all like I said yes you can have the best prop setup the best setup we can have all the confluences in the world but if the trade is a one is to one to ratio I will not take that trade as simple as that I don't care how confident I am in that trade I would just not take that trade I stay true to my risk management plan so think in
terms of R right now don't just think in terms of oh I'm trying to grow this $100 account how can I take this $100 to turn it into $200 oh you know what maybe I should risk $50 to make an additional $100 no think in terms of ah if you risk $50 how much R is that that's 50 R bro you're risking 50 R to make 100 R you're risking 50% of your account that means what happens if you lose this 50 R then you let 50 R in your account you you let 50% of
your capital in your account and if you lose this again guess what you just wiped out you're clean you have no money inside your account anymore and just blown your account congratulations so genuinely go think about this for a minute think about the r multiple and make every single trade an intelligent RIS to your decision so right now I'm still talking about the mindset part later I'll talk about habits this is still more on mindset right firstly think about how much money you can lose instead of how much money you can make and also make
every trade an intelligent risk reward decision is to look at the are multiple what else should I say uh lose money and protect the downside is the same as this um okay another thing I talk about losses losses I'm very very fascinated with this because this is where you find true growth you don't find profitability from analyzing your wins you find profitability from analyzing your losses and figuring out what went wrong and figure figing out how we can improve as a Trader losses you need to change the way you think about losses at the start
of trading I always think that losses are bad it's literally nothing good about losses oh if I lose this money guess what I just lose my high money which I could have bought McDonald's or or this Nike sneakers of it there's nothing good about losses But as time passes I've been trading for what three four years now I learned that losses are actually good losses are the ones that are actually helping me to improve as a Trader is not the wins so generally look at your losses whenever you lose a trade look at it and
think about how you can not commit that same mistake again so I want you guys to understand this okay think about this uh when you look at loss ask yourself this why did I lose this trade not just this why I lose this tra and then what can I learn from this loss and how can I prevent myself from committing this mistake again when you ever you encounter any sort of loss look and ask yourself this question here ask yourself these questions because if you can ask yourself this question and you can actually answer your
these questions right guess what you unlock you unlock a Hidden Gem you unlock a Hidden Gem and as time passes you make more and more mistakes you lose more and more money and you just unlock more hidden gems and eventually you'll be so wise and so good at trading and it's all because you lost money and also trading will be extremely boring if you don't have losses if you win every single trade what the is the point of trading anyways losses is what makes trading somewhat rewarding is because you know that trading is extremely difficult
and you've lost a bunch of money that's what makes the end goal worth it that's what makes the profit feel good because you have experienced the opposite part or opposite side of the spectrum so change the way you think about losses okay that's the third lesson maybe let me just give you guys one more lesson in terms of mindset emotions when you're trading your hard earned money you will experience a ton of emotions like fear greed fomo even doubt all these emotions will arise when you are trading with h and money the question becomes how
do you control your emotions there's two models that I created inside the trading blueprint that will help you learn about that big performance trading big performance mindset I mean big performance mindset and also uh my trading psychology modu those two modules if you want a inp g this go study those two modules but let me just give you one important point when you get emotional this is the brain by the way is the brain when you get emotional right there's two parts of the brain I don't know the exact signs of this all right pry
F cortex or or what what not I don't know the exact signs but I know this when you get emotional the emotional part of the brain the part of the brain that actually give you that emotion actually over take the logical part of your brain isn't this quite fascinating this is why when you argue with your partner or okay let's say you're man all right you argue your girlfriend and you can't explain to her okay this is the rational way this is The Logical way but she still continue arguing with you and telling you that
she's right and then she arguing with you until eventually you give it and tell her okay you know what you're right why why does this happen because the emotional part of the brain take over the logical part of the brain right she is not thinking logically anymore she is thinking emotionally and why I find this so fascinating is because in trading we learn about trading psychology and we learn about how we need to control our emotions when we are trading but when these emotions arise we cannot control them because the emotional part of the brain
takes over the logical part of the brain now in this case what do you need to do what you need to do is first step is to be aware is to take a step back and be aware of your emotions when they arise oh I'm feeling green oh I'm feeling formal oh I'm feeling doubt and then when that happens take a step back and reevaluate re-evaluate the whole situation and think whether you should actually enter for the trade or not if you shouldn't enter for the trade then don't end up for the trade all right
so be aware when the emotion Ares and actually re-evaluate the situation and I think you should in introduce some sort of pattern interrupt that means once you're aware that okay you are experiencing fear right stop trading right stop trading and actually go for a walk or take a deep breath uh I'll just do something else other than look at the charts and then re-evaluate the situ with a clear mind that is when you can really learn how to control your emotions somewhat control your emotions I never really like this work what control your emotions I
always think that it's not about controlling your emotions it's about mastering your emotions and this is how you can generally master your emotions by being aware and reevaluating the whole situation as a whole now all these lessons right here this mindset lessons are lessons that I've learned for the past four years and I think they are the most important thing that you can genuinely know as a Trader because if you can implement this these are things that will help you sustain in the game for the long term if you're planning to trade for the long
term this is it these are the keys and another thing about trading psychology mindset is okay one last point I promise you one last point is plan and actually talking about plan let just move on to the habits of the top 1% Trader we have talk about the mindset now let's talk about the habits of top 1% Trader first habit like I said is plan what does it mean to have a plan most importantly have follow a trading plan I talk about this like thousand times on my YouTube on the course a thousand times and
yet a lot of you guys still will not follow this to follow a trading plan is to develop a Playbook that means you must know exactly what will cause me to enter for the trade okay what's my entry triggers what setups should I enter for should I look out for so I can enter for the trade and then even when I do enter for the trade where should I get out and the thing about where you should get out there's two points right e your take profit or your stop loss you need to plan both
before you enter the trade remember what I talk about you should always start going in it with the mindset of thinking about how much money you can potentially lose that's why you focus on choosing a stop loss first right place your stop loss let's say this is a trade like this let's say you're trading at like a demand zone right here demand zone right here and you enter for a buy right here and you place a stop loss below this demand zone right here this your stop loss next you place your take profit maybe at
the next Zone which will be somewhere right around here so you enter for this trade because you have your four confluences because this was the highy setups right and then place your stop loss below place your take profit above now in this case inside a trading plan you must also contain what is the minimum risk to reward ratio that will cause you to enter for the trade and if it's less than this minimum risk to R ratio you will not enter for a trade for me it's one is to two for you can be one
is to three 1 is to 4 in this case right here if my risk to ratio is 1 is to one it means I'm risking this much to make this much the same amount I will not take the trade but in this case it seems to be I'm risking 1% to make about let's say 4% so this was a w trade and I will take that trade okay so these are the things that should be inside our trading plan that's obviously other things like um which currency to focus on which trading session to trade and
I actually have like a full trading plan for you guys and if you go to the Vault you will know that I have this plan called the winning trading plan is like a full trading plan this just like a summary out of it so go to the full trading plan and actually download it create your own trading plan and actually TW it if you need to because what works for me might not work for you you might have a different trading style sculping swing trading or whatnot so take the trading plan and then follow it
just follow it every single day and execute consistently that's the first habit of a top 1% Trader second habit will be to journal your trades it's to journal your trades right I said this is very important because like I said just now losses are extremely important and extremely valuable so you need to make sure every single loss count and do that by actually journaling down your trades so what I do is that after after the end of each trading day after I'm done trading for the day I will open the trading journal that I have
and then just trck down my trads and what do I Journal whatever I mentioned to you guys over here why do I lose this trade what can I learn from this loss how can I prevent myself from committing this mistake again so this is for a loss if I lose a trade today and I'm journaling I will reflect about these few questions now if I win and I actually win a few trades in a row I will think about just one question how do I replicate this win how can I ensure that I you know
replicate this win okay very simple is to look for the same setup again right look for the same setup so loss and win and that is what you need to put inside your trading journal next habit would be to track every single data you need to have some form of like data tracker you need to be able to track like okay on this date on this date I enter for this trade with risking about this percentage and also if a one is to tr ratio and then uh and then this trade was a profit so
basically you need to be able to track your data and have like this information inside your tracker I recommend you to actually do our Excel shet and actually yeah just make sure that you track all this data and I am actually working on the data tracker right now and once done I'm going to upload it inside the vog so that you guys can use my own uh data tracker the the basically the spreadsheet I use to track my data and stuff so we talk about following a training plan we talk about journaling your trades we
talk about tracking your every single data thir thing is to back back T consistently now why this is so important is because the markets are changing the environment is always changing and what works for you now might not work for you later there's a few phases of the market there the volatility of the market there's a uh okay so let's say there's a boo market and a bare market right so bare Market could be like a huge downtrend long-term downtrend and then boo Market could be a long-term uptrend within this BL or bear Market there
is two phases your volatile and also your quiet so a bull volatile Market could be like this a bull quiet Market could be like this a bare volatile Market could be like this bare quiet Market could be like this right basically there's different phases of the market and that is why one trading strategy might not work for all of this phase right maybe your price action trading strategy could work for this bu volatile Market this setup could work for this bull B market then you might look for pullbacks doing this bull volatile but then what
happens doing the B volatile how you going to trade B I mean uh bullir how going to trade doing The Bu chir environment okay in this case you need to switch up your trading strategy this is when maybe you can use your supply and demand demand zones right take advantage of all supply and demand zones so you can see right depending on the market environment that you are in you need to use a different trading strategy that is why I preach back test consistently because Market environments are changing they're always changing and you cannot control
that only thing you can control is your own trading strategy and how you trade that is why you should adjust your trading towards the everchanging market environment so do just that and and make sure that you always back test you can back test on trading view or you can back test on the Forex Testa 5 there's a lot of softwares out there they can use to back test right so back test consistently follow your trading plan General your trades track every single data [Music]
Related Videos

58:16
How to Master Trading as a BEGINNER (2025)
The Trading Geek
437,793 views

1:43:15
MrBeast: If You Want To Be Liked, Don't He...
The Diary Of A CEO
2,109,068 views

20:59
What Kaitlan Collins saw during fiery Trum...
CNN
4,218,306 views

53:50
I Bought an Abandoned House on a Remote Is...
Skote Outdoors
4,287,119 views

3:11:08
Joe Rogan Experience #2281 - Elon Musk
PowerfulJRE
5,306,501 views

1:07:10
AMERICAN visits IRAN for 10 days (this is ...
World Nomac
597,992 views

20:52
The World's Highest Security Prison: CECOT...
Ruhi Çenet
53,453,424 views

1:41:30
The ONLY Technical Analysis Guide You'll E...
Ross Cameron - Warrior Trading
236,811 views

2:28:47
The Savings Expert: Are You Under 45? You ...
The Diary Of A CEO
4,669,175 views

1:03:02
Russell Peters | Act Your Age LIVE Abu Dhabi
Russell Peters
2,289,269 views

28:33
This SNIPER Entry Strategy Will Make You $...
The Trading Geek
446,803 views

53:05
Tom Lee’s 2025 Playbook: Bears Sound Smart...
RiskReversal Media
83,315 views

26:43
Scalping SECRETS they don't want you to know
The Trading Geek
105,327 views

48:15
Reading Candlestick Charts Was HARD Until ...
Ross Cameron - Warrior Trading
1,300,107 views

17:03
Lawrence: Trump humiliated again on the wo...
MSNBC
5,768,163 views

16:17
Craziest Animal Encounters of All Time
Daily Dose Of Internet
687,084 views

1:03:23
If you want 2025 to be the BEST trading ye...
The Trading Geek
35,160 views
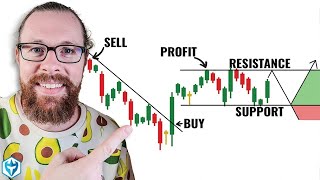
55:18
How to Read Candlestick Charts (with ZERO ...
Ross Cameron - Warrior Trading
3,172,004 views

16:37
I made a Copper Ice Press that Turns Ice i...
Robinson Foundry
723,119 views
1:02:03
how to trade like a pro so you can get ric...
The Trading Geek
451,249 views