New Scalping Indicator With Accurate Buy And Sell Signals
30.43k views1449 WordsCopy TextShare
Bitmoni
For Forex and Synthetic traders: 👇👇👇
Sign up on Deriv Forex Broker: https://bit.ly/3C3V9tm
✅ Min...
Video Transcript:
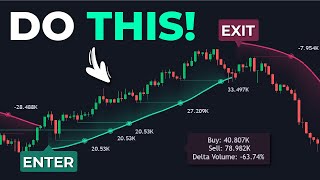
in today's video I'm going to reveal one of the best indicator for both scalping and day trading I will also reveal a strategy that you can use with this indicator to make massive profit in trading so if it is something you are interested in kindly hit the like button also subscribe to my channel and turn on the notification Bell to stay informed each time we make new videos now let's get started [Music] Buy Low sell high as a Trader you always want to buy at a market bottom and sell at a market Top This is
a market bottom as identified by this indicator let's take a Buy and see what happens place a stop loss under the channel of the indicator Target a 1 to 1.5 risk reward ratio let the trade run and it was profitable now here's a market top which means we're supposed to open a short position place the stop loss above the upper Channel take profit at 1.5 times the risk let the trade run and as you can see the trade was profitable ladies and gentlemen this is the top G indicator by big Beluga it's a tool designed
to identify Market tops and bottoms helping you to spot Trend reversals with ease now we're going to go over what this indicator is and how you can use it in your trading to add this indicator to your chart first go to trading View and then open any trading security that you like on any time frame next click on indicators Tab and type in top G indicator then select the one by big Beluga now you may be thinking what exactly is this indicator the top G indicator by big Beluga is a technical analysis tool designed to
assist traders in identifying potential Market tops and bottoms it's Simplicity and focus on Market extremes make it particularly useful for Traders looking to time entries and exits in trending or ranging markets as you can see it's a super simple indicator made up of the following components first we have the trend Channel at the top of the channel we have the upper band and at the bottom we have the lower band at the center we have the middle line these bands serve as key reference points for analyzing price movements they can be used to identify potential
areas of support and resistance helping Traders decide whether to enter or exit trades with greater confidence when the price approaches the upper band it may indicate overbought conditions and a potential reversal or resistance Zone conversely the lower band signals oversold conditions and potential support the midline serves as a dynamic equilibrium helping Traders gauge whether the market is strongly trending or consolidating within a range the main components of this indicator are the top and bottom labels this is the top label and this is the bottom label whenever you see this it basically means the Market is
likely reaching a high probability top or an overbought Zone it signals a potential reversal to the downside making it a good point to consider exiting long positions or entering short positions this label is based on price action dynamics that indicate Market exhaustion or resistance on the other hand at the bottom we have the bottom label marked with the G sign this indicates a high probability bottom or an oversold Zone it signals a potential reversal to the upside making it an ideal point to consider entering long positions or closing short positions this label reflects conditions like
low volatility or momentum shifts suggesting that the market may be preparing for a rebound then we have this carrot and its inverted version these are called intermediate signals this one indicates potential bottom areas but with less certainty than the G labels these are secondary signals useful for Traders monitoring reversal opportunities on the other hand this signal identifies a potential top area but again with less certainty than the top label providing additional context for Traders trading in range-bound markets now how can we use this indicator to trade well I'll tell you but before that let's take
a look at the setup and see how customizable it can be on the input tab we have the length with a default value of 150 this determines the number of bars or periods used to calculate the indicator's range and dynamic bands a higher value like 150 results in smoother bands with fewer signals as it captures a longer term view of the market on the other hand lowering this value makes the bands more sensitive to recent price changes generating more signals but potentially increasing noise here we have an option to change the main color of the
indicator for me I'm going to leave it at default for better visibility and the length is going to remain at 150 on this tile tab I'm going to disable the midline for a cleaner look after that click okay next let's add the macd indicator so we can cross check the strategy double click on it to open the settings on the style tab disable the Mac dline as well as the signal line options then click okay now that we've set everything up let's go over the conditions for taking positions the idea behind this strategy is to
use the top G indicator to identify Market tops and bottoms before taking positions at these tops and bottoms we look for divergences on the macd indicator as extra Confluence now for a long position you first of all want to identify a bullish Divergence on the macd this unique type of Divergence requires three things first you want to look for your initial macd low forming a clear trough and then let the macd histogram move upward and create several green bars after that the histogram must form another Mac dowlo with a series of red bars you want
to ensure that the first Mac dolo is lower than the second Mac dolo confirming a bullish Divergence now on the chart you want to draw a line from the middle of the first Mac DLo to the middle of the second Mac d low and compare this to the price if the price creates lower lows while the macd shows higher lows this indicates a Divergence now within the Divergence you want to look for a G label signaling a potential Market bottom and further increasing the odds of an upward move now once you see the macd histogram
turn green again indicating bullish momentum you enter a long position place your stop loss right under the lower band and set your takeprofit two times the risk let the trade run and in this example it turned out profitable now how do we take a short position well it's going to be the opposite of what we did here now condition number one is you want to identify a bearish Divergence here as you can see I've drawn it and this is the explanation the macd created two highs with one low in between the first high was higher
than the second high and while the price was creating a higher high the macd was creating a lower high giving us a Divergence now looking at this we can see it's the exact opposite of the bullish Divergence that we used for the long position once we have the Divergence we need to Mark the beginning of it all the way to the end of it and then in between these two lines we need to look at the price and see if there is at least one top label printed and right here we can see a clear
top label printed indicating that the price may be overbought and due for a bearish reversal once this is confirmed we just wait for that macd histogram to shift to Red to Signal an increase in bearish momentum then we take a short position stop loss above the upper band and take profit to be set at two times the risk let the trade run and as you can see it was profitable in summary the top G indicator by big Beluga identifies Market tops and bottoms using Dynamic bands and labels paired with macd divergences it helps Traders spot
high probability reversals and execute trades with clear entry stoploss and profit targets and that's been it for this video I really hope you found some value if you did remember to leave a like or even consider subscribing to stay tuned thanks for watching see you next time
Related Videos
8:34
Best Indicator With Accurate Buy And Sell ...
Bitmoni
10,052 views
9:55
This Zero-Lag BUY SELL Indicator Makes All...
PineTrades
220,653 views

30:19
I Never Shared This Scalping Trading Strat...
The Secret Mindset
263,917 views

39:19
Support And Resistance Didn't Work Till I ...
Rayner Teo
2,081,395 views

28:37
🔴 This Trading Hack Makes PROs RICH (Insa...
Trader DNA
66,956 views

11:28
5 TradingView Indicators I’d NEVER Share P...
Magic Indicator Strategies
41,766 views
9:12
Best Pullback Strategy For Profitable Trading
Bitmoni
30,617 views
44:00
Best RSI Indicator Trading Strategy - Wyse...
Wysetrade
2,934,798 views
8:36
Best Price Action Pattern To Make Consiste...
Bitmoni
7,221 views

8:39
20 EMA High & Low Trading Strategy – Live ...
GeekOnDaily
81,217 views
8:05
I'm Giving Away My Secret Trading Formula ...
TradeGenius
16,820 views

19:26
My Scalping Strategy is Boring, But Makes ...
Scarface Trades
179,053 views

10:32
This Indicator PREDICTS Market Bottoms wit...
Data Trader
140,053 views

21:49
Convert TradingView Indicators into Strate...
Michael Automates
1,023,355 views
20:00
🔴 STRENGTH INDEX Trading (Say BYE-BYE to ...
Trader DNA
232,066 views

8:19
Buy Low, Sell High! This Indicator Shows M...
PineTrades
79,321 views
12:42
1 Indicator, 3 Uses! Most Powerful Trading...
PineTrades
557,255 views
![The Only TradingView INDICATOR You EVER Need [Secret GEM]🔥](https://img.youtube.com/vi/gpmkj_AbyMk/mqdefault.jpg)
9:05
The Only TradingView INDICATOR You EVER Ne...
TRADING OF DK
17,854 views
11:49
Best Tradingview Indicator For Day Trading
Bitmoni
14,767 views

5:32
Secret 1 minute trick and 100% accuracy in...
Katie Tutorials
166,087 views