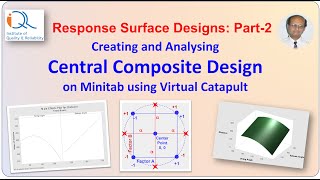
Tutorial: Central Composite Designs with Minitab
23.27k views1246 WordsCopy TextShare
Luc Dewulf To Be Deleted
Luc Dewulf teaches you the basics of central composite designs with Minitab.
Work conducted in the G...
Video Transcript:
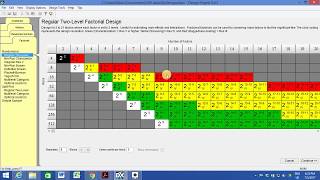
a wonderful hello I'm dr. wolf at the time of presenting a student in the green nanomaterials research group at the University of Sheffield and this tutorial will cover the basics of central composite designs with Minitab this video follows on from the previous one on two-level factorial designs so feel free to go back to see the entire story central composite designs are part of the design of experiments framework goe is a statistical tool box that offers systematic designs and efficient item analysis methods to solve multivariate problems in an empirical and statistically sound way the general strategy
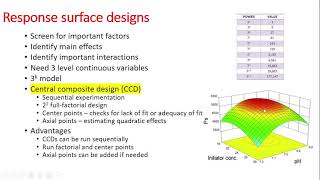
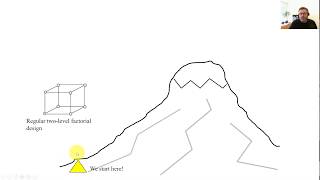
consists of first constructing an experimental design secondly to perform the experiment accordingly and thirdly to statistically analyze the experimental observations what our sample composite designs see CDs are part of the response surface methodology called this way because the resulting models are especially suitable for robust mapping of the response the increased precision in forecasting is a result of the higher order polynomials and therefore C CDs are used for optimization purposes in the previous video we saw the two-level factorial design for screening purposes which can create at most a first order model to relate the input factors
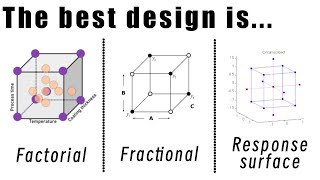
X to the response Y the advantage is that they only require a small amount of treatments that will composite designs have enough treatments to come to construct second order polynomials but therefore they are also more elaborate the most efficient approach would be to first construct a factorial design to test if a first order model is sufficient and if curve H is present or if optimization is required then a central composite design could be run to obtain a second order model CCDs can either be ordinary central composite designs or face centred central calm citizens let's take
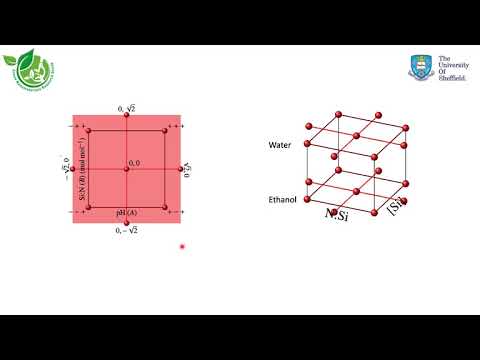
the experiment from last time as an example just to recap it was a chemical reaction with the factors pH of the reaction then the ratio of two of the reactants silicon and nitrogen and from last time we found out about the silicon concentration factor was the least significant it's time we wish to obtain a more precise secondary model second-order model instead of just a first order model for our response the product be T surface area and we also wish to extend the design space to cover a larger experimental range and we will try to do
this using a central composite design now we will turn to Minitab as always on the top there is in the tool bar on the left is the navigator at the bottom is the data payment with its worksheets and centrally is the output pane to create a central composite design we go to the stat DV response surface and create responsive s designer we check that we have the central composite design and we select two continuous factors and zero categorical factors continuous factors are factors that are that have quantitative numerical levels such as the behave if it
is varied continuously categorical factors on the other hand are factors that have qualitative or text levels such as different types of reagents when only continuous factors are present a single design is created but when categorical factors are present then a new design is created for every level of the categorical factor for example if we wanted to test the reaction in water and ethanol then the design would be separated out into two designs because mathematically we cannot treat categorical factors as if they were continuous factors we don't face this scenario here therefore we move on to
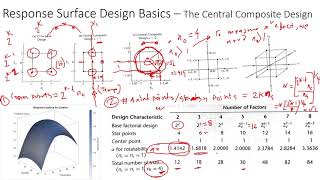
choose the design and we wish to do it in just one block to evaluate the value of alpha is not the level of significance but the distance between the center point and the outermost points and it will depend on the number of factors used by default this design does not contain a center point but we choose to include one to get a better predictability of the model at the center of the design so number of center points within the cube one in the next step it is possible to choose whether we wish the ordinary face
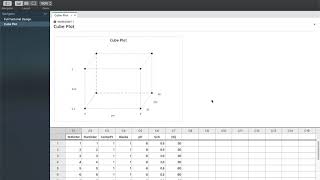
centered so the ordinary central composite design of the face Center to come visit central composite designer we stick with the ordinary one and we'll also choose to do two replicates of the entire design click OK then type your factors factor a was pH in fact it was the silicon to nitrogen ratio the levels of the factors are going to be the cube points which was page six and pH 8 from the screening experiment in the previous video and the confirmation ratio is 0.5 and 2 under options we choose not to obtain a randomized design although
in practice it's good to randomize the experiments to avoid bias okay as we can see click OK as we can see we have 9 treatments but because they are duplicated we have 18 experiments in total which are also shown here in our worksheet after designing the experiments the next step is to perform the experiments and to collect the observations and then lastly to analyze the observations and to construct a mathematical model that explains our chemical system we enter the collected values for the BT surface area and then we go to stat do we miss from
surface analyze response surface design we select the BT surface area as our response and now under terms we can see that the CCD is able to handle second-order models because a and B have squared terms under options the analyst is required to enter a level of confidence the most common ones are 90 95 and 99 the level of significance alpha which is 100 minus the confidence level is the probability probability of committing a type 1 error which is erroneously identifying a non significant model term to be significant because we want this chance to be just
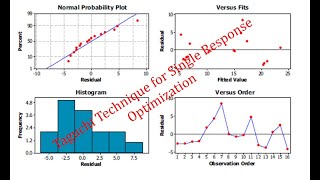
10% we type 90 under graphs we select our preference poor visualization and under results we select the analysis of variance and the regression equation ok we can now inspect the statistical output in the output pane and the second order polynomial can contain a lot of terms as we saw earlier but for product development purposes we don't always want the most complex model we are looking for a model that captures significant changes in the result but not the experimental random noise the ANOVA the analysis of randomness tells us that only factors with p-values less than our
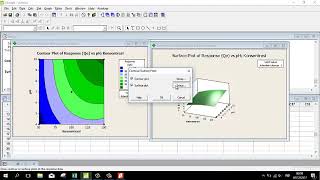
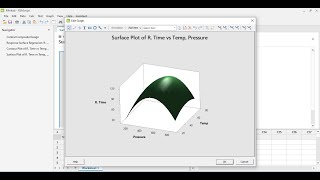
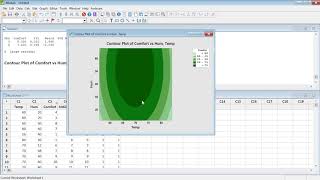
confidence level of 0.1 are statistically significant which we can see from the half normal plot to be factors a B a B a squared B squared is not an important term had it been included without statistical test than our model would have over fitted at the response it would have been too complex most importantly we can get a mathematical model the regression equation that empirically shows the trend in response in our chemical system as always we can obtain surface plots and not true and also contour plots are going to do we respond surface to surface
plot and also controls if further reading is wished these are good resources and to conclude we had a look at how to design it analyze central composite designs in Minitab for optimization purposes feel free to email me for further clarifications thank you very much
Related Videos
7:24
Factorial vs fractional vs response surfac...
Marcel Butschle
2,165 views
13:57
Tutorial: 2-Level Factorial Designs with M...
Luc Dewulf To Be Deleted
19,817 views

49:45
Response Surface Methodology - RSM - tutorial
Vitarka
61,508 views
16:39
Response Surface Methodology Basic, the Ce...
The Open Educator
74,897 views
26:13
RSM Part-2 Central Composite Design with I...
Institute of Quality and Reliability
18,427 views

15:06
Using the Central composite DOE
Paul Allen
1,531 views

29:31
Response Surface Methodology (RSM) dengan ...
Erwin Widodo
4,798 views
26:56
Taguchi Part I (Implementation on Software)
Optimization in Research
3,226 views
6:18
Box Behnken Response Surface Methodology R...
The Open Educator
54,208 views

6:54
Response Surface Methodology in Minitab | ...
Engineering and Info
2,960 views

6:04
RSM: Introduction to Response Surface Meth...
StatDOE by Rosane Rech
54,005 views

13:25
Response surface methodology
Tech gurukul
40,860 views

12:48
Response Surface Methodology Box Behnken D...
Engineering and Info
5,751 views
6:44
Design of experiments - Central composite ...
ProProcessEngineer
12,898 views

3:09
RSM 06 Central Composite Design
StatDOE by Rosane Rech
4,750 views
10:54
box behnken in minitab
K. Christopher
28,381 views
29:30
Design Expert Practice Design of experimen...
obeidi1
75,864 views
9:08
Response Surface Methodology (RSM) analysi...
Science Roast
67,783 views
18:12
Introduction to response surface methodolo...
Erik Vanhatalo
12,427 views
7:57
Response Surface Methodology Design of Exp...
The Open Educator
126,504 views