Happy New Years Bitcoin!
21.07k views3495 WordsCopy TextShare

Benjamin Cowen
Happy New Years everyone!
Into The Cryptoverse Premium SALE:
https://intothecryptoverse.com
Into T...
Video Transcript:
hey everyone and thanks for jumping back into the cryptoverse today we're going to talk about Bitcoin Happy New Year's if you guys like the content make sure you subscribe to the channel give the video a thumbs up and check out the sale on intothe cryptoverse premium at intothe cryptoverse decom let's goad and jump in so it's been a fairly exciting year for Bitcoin it started off the year if we go look at the 12-month candles it started off the year at around $42,000 and at least as of right now it's at 93,000 we are coming
up on the yearly close in just a little bit as I'm making this video you can see the yearly close is just about 55 minutes away so all in all this has been a pretty good year for Bitcoin it's up about 120% last year Bitcoin went up 155% so two fairly strong years here for Bitcoin back to back if you check out the year-to-date Roi for Bitcoin and you look at year-to-date rli in 2024 compared to 2023 it does seem like 2023 was a fairly good blueprint for what would happen in 2024 obviously there's you
know some divergences here and there um but for the most part 2023 and 2024 look fairly similar again also you could compare 2024 to other prior having years like 2020 and see some similarities as well 2016 and 2012 in terms of what kind of happened going into the end of the year there are a lot of similarities between 2024 and 2012 in the sense that there was sort of a rally early on in like November October November but then it kind of stalled out as December arrived furthermore if you look at 2024 compared to 2016
you will see that the year-to-date Roi ended up being about the same it's just that in 2024 it achieved it about a month earlier about half a month before it hit that level in 2016 if you go check out where Bitcoin is with respect to its bull market support be the 20we estimate the1 EMA it's currently again the price of Bitcoin is right around 93k the extension from the 20we ese is still pretty high because the bullmark sport band is all the way down at 77 to 81k um so still well above the bull market
support band levels in fact if you look at this year compared to last year at this time it was also about the same distance above the bull market sport ban and you can actually visualize that even better by just looking at something that we call the shortterm bubble risk the extension from the 20we moving average and then just seeing that you know this is basically the same levels that Bitcoin hit last year around this time in terms of extension from the 20we moving average and then it slowly went back down uh until it was only
about about 14% above the bull market support band right now it's still about 20 to 21% but remember the 20we SME will continue to go higher as long as the price uh remains you know up here okay so obviously when you get into a new year things can change right A lot of times as you go into New Year's market conditions can change we've often seen things like Bitcoin dominance go down in post having years that doesn't always mean it has to happen immediately but it is something to at least be on your radar for
instance right now Bitcoin dominance is at 58% um and if you were to look at 12 12-month candles of Bitcoin dominance you will see in fact that it tends to spend three years going up and then one major year going down right so 2017 it dropped 2021 it dropped but those three years in between you could see Bitcoin dominance went up back in 2021 when we sort of began our Bitcoin dominance Journey we said that it would likely go up for the next 3 years and it has and now the question is is you know
how long until you see a drop like this okay now it could be at any point in 2025 um if you look at you know if you look at at all Bitcoin pairs one of the things you'll notice is that uh even as late as Q4 of 2017 all Bitcoin pairs were actually at 0.25 then even though it was the post having year so just be aware if you're if you're you know studying the Bitcoin pair chart a lot and and wanting to see something repeat it's it's always certainly possible that it occurs early on
like it did at the beginning of 2021 you can see that all Bitcoin pairs got a really strong rally um in early 2021 but there's also a non-negligible chance that it takes a little bit longer to see that same type of rally because that same type of rally back in 2017 didn't really get going until November and again you know when you're trying to figure out you know how is Bitcoin going to do with respect to the other cryptocurrencies monetary policy plays a big role um and if you look at all Bitcoin pairs overlaid by
total assets held by the Federal Reserve one of the things you'll notice is that last cycle we saw a um you know we saw all Bitcoin pairs bottom out when QE started that still hasn't happened yet which is kind of interesting the Counterpoint of course is that the cycle before they got a big rally uh even though quantitative tightening wasn't or even though you know QE wasn't really going on but you can see that the balance sheet of the Fed was flat during that time so I would even I would even go as far to
say that you might get this rally by all Bitcoin pairs um Even If the Fed were to end QT but not start QE but again that is not something that we have seen yet now right now all Bitcoin pairs are trying to hold sport at the bullmark sport band but one of the things you'll also notice is that Bitcoin dominance is trying to do the same right Bitcoin dominance is also trying to hold support at its own bull market support band uh so certainly a lot of interesting things right now in the market in fact
if you were to go look at at the dollar and we talked a lot about this back in in September we said that when the FED starts to cut we will likely see two things happen in in relation to sort of the Forex markets and long and the old curve right we'll see the dollar go up just like it did in 2016 so if you look here the dollar went up in 2016 uh into the end of the year and then it topped out in early the Early part of January okay so we were sort
of just saying all right what if the same thing happens right what if what if the dollar sort of rallies into the end of the year like that um just like it did in 2016 and it seems like that is in fact what has been happening and what will likely continue to happen I don't know exactly how high the dollar is going to go but 109 to 110 was always sort of like at least a preliminary Target it could shoot higher than that uh but that was at least where I was initially thinking sort of
coming back up to where this Wick was right there but again I mean it's it's possible I mean it's certainly possible for it to take out the prior high but again you know at that point it's not as much of a a strong conviction trade it's just saying all right we got on the right side of the move who knows how far it'll go um but the reason we said this because the dollar is has been very highly correlated with the long and of the Yol curve so if you're wondering why Bitcoin has been frankly
struck you know stuck in traffic on struggle Street for the last 2 to 3 weeks of 2024 I think a lot of it has to do with it just being cons you know it behaving like a risk asset because we've seen the S&P doing the same exact thing right if you look at the S&P 500 it's also been struggling a little bit at the end of 2024 and my contention as to what is going on is that the long end of the yeld curve sort of the rise of the long end of the yield curve
soor that's the the the difference between the or the the spread between the 10 year and the 3 month my suggestion is that we're seeing the same thing that happened back in 2023 right where um you also saw a Breakout by the 10-year yield here and then when it back tested the 21 we EMA and then went up risk assets went down in fact if you overlay the S&P 500 onto that chart you'll see what I'm talking about right you'll see as the as 10year yield held support at the 21 we EMA that was when
the S&P got that correction right there and if you overlay Bitcoin onto that chart you'll see the same thing right you'll see that Bitcoin was also struggling during that time and and kind of I I feel like the same thing's kind of happening right now right where you get you're getting this bounce off the 10-year yield and now yields are going up and then the question is is well how long will they go up for back then after the 10-year yield bounced off of its 21 we EMA the tenure yield then topped about three months
later okay so we've already seen it go on for about a month already um it's been about four weeks or so so far hard to say it's if it's going to go the exact amount of time but I will say if you look at you know the you know if you look at bonds if you look at like TLT or something which is you know behaves um sort of the opposite of of this uh then what you'll notice is that it tends to uh double bottom or sweep the prior low so like if if the
long Cur is going up TLT is going down and so a lot of times when when TLT gets these moves it'll form these sort of these double bottoms or where it'll slightly go below the prior low before then bouncing and so you could argue that that is what's happening right now and and furthermore one of the things to consider is that the the the bond market is sort of doing what the FED is unwilling to do um this could be the bond Market's way of saying the FED has in fact cut too soon um there
is a chance that that is the way that this this should be interpreted because normally when the FED starts cutting you can see bounces in the long and the Y curve but they they they tend to be relatively shortlived now fortunately we were on the right side of this because we didn't you know if you follow this channel what we were saying was that as long as you know as long as initial claims as long as initial claims are below 300K then it's not really recessionary therefore at the fed starts getting too aggressive with their
cutting the bond the long and yker might have to go up because then the Market's starting to price in you know inflation again and and reacceleration of that and and growth rather than a Slowdown um so I think one way to interpret what's happening right now in the markets is that the bond market is essentially saying that it's possible the FED has cut too soon and therefore the long and yeld curve has to do what the Fed was UN to um and I I I think that's probably the best interpretation I could could be wrong
absolutely I could be wrong but that's what I think is happening right now with with Bitcoin if you if you're kind if you're if you've been wondering like why is it been struggling here going into the end of the year it might just very well be that the you know the long of the yield curve has just been going up and it's been a drag on risk assets and it's not just Bitcoin right it's it's you know all risk assets you see the NASDAQ dropping we've seen uh the S&P dropping um it's all very similar
in fact I mean if you look at at a correlation um if you look at at a correlation coefficients of of um Bitcoin right if you look at it sorry if I can get this to load um I don't know it seems like it's not loading right this second but if you look at it for crypto and stocks at least maybe we having issues with some of the metals right now but if we look at it for crypto and stocks and we can get this to load uh you'll see that you know Bitcoin tends to
be fairly highly correlated to a lot of the stocks right I mean you can see that it's mostly green um you know 0. 91 correlation with Netflix over the last 60 days um over the last 180 days you can see that Bitcoin has a83 correlation with the s&p500 um it has a093 correlation with Tesla uh if you look over 365 days it's Bitcoin is correlated 77 with the S&P 500 so that kind of explains I I I think uh the current move by Bitcoin if you look at its risk level right now bitcoin's risk is0
576 um so if you were to isolate just the 0.5 to 6 wristbands that's what it looks like um if we were to go check in on the uh some of the other sort of fluffier metrics like the RSI um and we make it so that it's a little bit easier to to to observe you'll notice right and and we'll go to the uh to two we RSI one of the things you'll notice here is that it is it's so the twoe RSI shows sort of diminishing Peaks each cycle um and it also shows sort
of lower lows each cycle and we already tagged at once back in in in February in March but we said back then that was not likely indicative of a market cycle top even though the twoe RSI was up here we also saw that in 2013 we had a double Peak on the twoe RSI and and furthermore this also frankly reminded us of what happened last cycle right where you had um you know a very similar thing happened where you know you you basically had Bitcoin kind of getting ahead of itself and then having to just
bleed for 6 to n months and that's basically the exact same thing that happened here and then eventually it finally broke out and then we got our Landing here it's broken out not we have not got a landing right we have not um and I I would argue that if we do there's a higher chance that it would actually hold this line as support than last time because one of the reasons last time it felt it failed to hold it was likely due to the fact that the unemployment rate just went from you know uh
3 and 12% basically all the way up to 14 to 15% essentially overnight um so I think there's a decent chance it would it would hold it as support if it if it were to get a correction back down there but even if it were to go uh back down it would also have some potential support here at the bull market support band right if you look at this on sort of a daily time frame right you can kind of see that this is where Bitcoin first got up into this range and it was sort
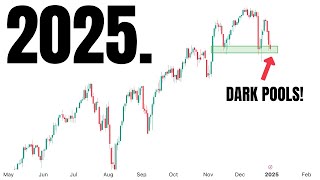
of uh Wicked down was around 85k or so and and again right now the 21 we EMA is already above 80k furthermore uh one of the things we've noticed by Bitcoin in post having years is that at least in the last two there has been a correction in January now what's interesting is this time we've already kind of had a correction in December um but if you look at at at what happened in 2021 there was a correction in January about a 30% drop um if you look at 2017 uh the post tapping year in
January there was also about a 30% drop but the Counterpoint of course is that it they Bitcoin was not really struggling at the end of December was actually going up and then you had a drop in January same thing again in 2021 this time has been a little bit different in that regard as it's bled in in December rather than having gone up um so obviously The Optimist would say well maybe it's just front running the corre ction because everyone's talking about it happening in January therefore why not it happen in December if you look
at a price range here it's already dropped around 15% a 30% drop would actually put it right around the 20we moving average um but I think that you know so so The Optimist would certainly look at that and say well why maybe it's just front running what everyone was already knowing was happening so by the time it actually happens Bitcoin already carried out that move the other way to think about it is you know if there's something inhibiting Bitcoin from going higher and and again it could just simply be due to the to the to
the big rise in in the yields over the last couple of weeks right we didn't see um moves exactly as strong as this in Prior December of having years by the 10-year yield right if you were to Overlay uh the 10-year yield onto this chart you know the 10year yield has never really been this high at this point uh in in bitcoin's history and so that could be that could be the reason and then finally I I guess the last thing to think about is there has been an uninversity associated with that um as to
whether you get sort of the recession that normally follows but again even if we get one even if we get one they're not always the same sometimes they're just sort of very brief like uh 1980s you had sort of a very brief one and then you had another one a year later um all sorts of things can happen with that stuff but again you know as far as that stuff that stuff's not really a tradable thing I I think what I would do is you know again track things like initial claims and if they have
a print 300K it probably means uh there's some more to the labor market weakness than there has been but for for up until this point there hasn't really been that weakness and so you could argue that the reason that risk assets are struggling is not because of weakness in say initial claims or anything like that but just because the long of the old curs going up doing the work that the Fed was unwilling to do so that's essentially where I think we are uh going into 2025 so I would like to say happy New Year's
to bitcoin and to all of you guys and I look forward to being here in 2025 to try to decipher the markets as always I will probably get a lot of things wrong uh but I'll do the best I can to at least outline the different scenarios that make sense to follow if you guys like the content make sure you subscribe to the channel give the video a thumbs up and again check out the sale on into the cryptoverse premium at intothe cryptoverse tocom I'll see you guys next time bye
Related Videos

10:53
The Honey Scam: Explained
Marques Brownlee
1,650,231 views
23:12
What Happens Here Matters...
FX Evolution
17,755 views

7:34
New Year's 2025: Dubai puts on stunning fi...
Global News
2,801,770 views

25:46
3 Days in Arctic Survival Shelter - Solo B...
Outdoor Boys
7,646,955 views

30:31
US Government to BanTP-Link Devices - Live...
Matt Brown
1,066,419 views

13:45
Happy New Year! 🎆 | London Fireworks 2025...
BBC
1,643,488 views

11:01
Why does it feel like the world is falling...
Big Think
441,436 views

17:06
New Year’s 2025: Paris celebrates with daz...
Global News
685,655 views

1:55:27
Worst Fails of the Year | Try Not to Laugh 💩
FailArmy
789,048 views

Cozy Winter New York Balcony Ambience with...
Chill Jazz

8:53
'He stared at me with a quarter of his hea...
The Telegraph
91,944 views

15:02
Spectacular celebrations in London as UK w...
Sky News
72,759 views

21:12
Nightly News Full Broadcast - Dec. 31
NBC News
192,002 views

23:50
I Can’t Stop you from Buying Amazon’s New ...
Linus Tech Tips
832,961 views

10:17
Make $100 PER DAY - The Ultimate Order Bl...
The Moon Show
5,219 views

Get Rid Of All Bad Energy | All 7 Chakra H...
Healing Energy Frequency

2:00:41
Stephen Wolfram on Observer Theory
Wolfram
110,535 views

21:44
The £50,000 Honda Civic Type R FL5 - Can I...
JayEmm on Cars
61,165 views

LIVE New Years 2025: Fireworks, Celebratio...
LiveNOW from FOX

christmas lofi radio 🎄cozy beats to get f...
Lofi Girl