How my AI Agent Team Analyses 427,000 rows in Seconds with n8n (Claude 3.7 and ChatGPT 4.5)
4.71k views7668 WordsCopy TextShare
Frank Nillard
Processing massive datasets manually is outdated—AI agents can do it in seconds!
In this video, I b...
Video Transcript:
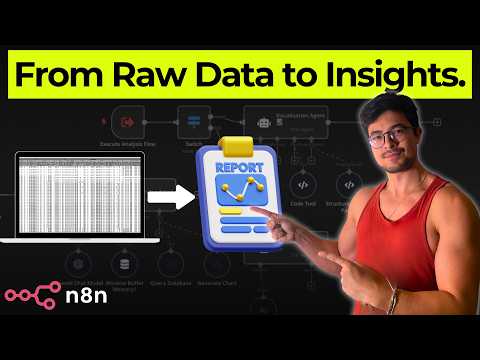
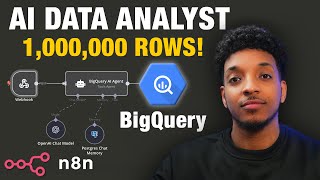
data analyst spend hours and hours pulling data from large databases cleaning that data and then trying to get insights from it but what if I told you that you can ultimate most of that process and get insights in just a few seconds using na10 my name is Frank and I have built this system comprising of three different agents that are going to exactly do that they're going to pull data using SQL from this large database that I found it's a sample database of comprising more than 500,000 rows it's an e-commerce database just going to pull that data and then turn it into a chart for example so that you can just get the insights that you need and make decisions from it really quick using natural language I will also be using the latest models that you got released such as GPT 4. 5 and Claw 3. 7 so that you understand their strengths and weaknesses and to also understand how to set them up inside na10 I think that this workflow if I apply it properly and in the right scenarios can save you tons of hours and also have you not rely on a data analysis team to get insights that can drive your business forward let's cut the fuzz and let's get straight to it I'm going to take you through this quick presentation so that you get a little background on what's going on the way data has been done until recently is the following so we've manually query databases using SQL we copy paste data inside reports and we use business intelligence tools which you know in some way does the complex processes out but they're still clunky and a bit titties to use if you ever used powerbi for example or Tableau these are tools that have a very complex interface and still require you to learn them so it can take weeks for you to learn in order for you to start understanding what's going on right okay so as I said before we're going to build a system that comprises of this orchestrator agent which can then call a SQL agent which is going to search through a database by generating SQL code and then we have this other visualization agent that is going to grab the insights from that SQL agent and then fill in a URL okay that we're then going to send over to an external service which is called quick chart.
this is what's going to generate the chart for us and then with that URL we will be able to render that inside the conversation this doesn't make a lot of sense I'll show you later uh how it works it should it should be more clear essentially you can see it here so this is the workflow and this orchestrator agent that you see here has access to these two tools okay these two represent to these two agents right the visualization agent and then the database agent or the assistant although you might think wow this is this is relatively simple right I didn't know it's going to be that simple uh it looks like it right but the actual PR and the actual testing that goes behind these things actually take a lot of time so you might see a lot of videos out there that build these multi- ective systems with like 20 30 different tools but the reality is that most of these systems don't work in reality right for for when you actually put them in businesses and you put them in practice they actually don't work because the way you got to think about these agents and and the tools that you add to them and and all that stuff they're like humans so if you give this agent 20 tools and then you think about okay this LM that powers this agent has a specific context length Okay let's put it in context let's say 15 uh 15 pages okay the whole context that you can give to it is 15 pages okay given those 15 pages how much you can teach it about the 30 different tools that it has attached to it think about that and then think about another scenario where we have the same 15 pages to write instructions to it but now it only needs to use two tools right 7 half of those pages can be written to teach it how to use one tool and then the other seven and a half pages you can use it to teach the other tool and it's going to have so much knowledge about how to use these tools compared to connecting it to 20 different tools right it's going to know very little about each tool that it's not going to be able to perform you know the tool use effectively so the way you going to think about this is like a human if you give the human 20 different tools and you teach it how to use all these 20 tools versus another human which you only need to tell them how to use one tool how good do you think this person will use this one tool versus this other person using all of the individual tools so have I thought about that and consider these llms and these agents as humans with access to tools and you having to teach them how to use all these different tools they work in a similar way to us okay but anyways I'm going to take you through a demo now so that you see how this works so we're going to use the chat instance in this case I tried to um add this telegram integration here but I was running into two issues so I just want to show you the the simple version and perhaps in another video I can show you how I can integrate it with telegram or another tool so if you're interested about that drop a comment down below and let me know if you want me to you know build this on top of another another tool okay such as telegram or or Whatsapp or or whatever you want okay so let's test this out so uh I'm just going to say hey right so when we trigger it doesn't trigger the other two tools so now I'm going to say um what tables do you have access to now it knows that it needs to access the query database to be able to you know search through the tables and super base we're using super base in this case hey there just briefly want to stop the video again to announce that I have launched the website of my new agency neurotech AI if you're a business owner wanting to have ai Solutions and AI systems implemented within your business processes to save time or increase Revenue make sure to go to our website and book a free AA consultation with us I'll see you there so let it do its thing and it says okay here are the tables I have access to okay so a couple of different things that I've added um I told you before that the system is extremely good at searching through larger databases and more complex queries these queries are not give me all the names in column A this is more involved so this could be anything from I'll give you some examples now but you know quer is like give me the top five performing products by sales region and then generate a chart for it so things that you might possibly see inside a business that can actually drive value from which you can actually make decisions from okay decisions that are going to drive the the business forward or or insights that you might have not known about that can drive the business forward these insights get better and better and better the more data you have because who's going to search in this case right let me let me try to zoom in here who's going to search 542,000 rows so this is just one table imagine you have a million rows and you have 30 of them that could be the case for big companies so there's a lot of potential in in selling these type of products to to larger Enterprises which are struggling with getting good insights or relying on a big data team to get these insights and and you know these little gaps that you know might be might be good for business to know so we have this as I said we have this uh we have this invoices table this is from actually a data set from kagle so this is an e-commerce database from a retail store in the UK okay so in this scenario I'm going to ask we're going to ask the invoices table so inside there's not much variety that we can ask through here but I'm going to use the other tables so that we can get this is going to be just an example of how you can search 542,000 rows quickly using this system and I'm going to have to ask something relatively simple but then with other tables there's more columns so we can ask more complex queries that you know you're not able to do properly with Google Sheets as a tool so in this case given the invoice table inside the invo voice table find the top five best selling product by total revenue along with the descriptions and then create a graph for it okay so now this orchestrated agent knows that it needs to quer the database and you can't see it here because it has this it has this trigger but you can see here on the right what's going on okay so the open hii model knows that we need to query this database and it did just right now it sent a SQL query that it thinks it needs and then this is being sent back uh by SQL agent to the orchestrator agent the llm then decides what needs to do next it triggers the the generate chart tool and then we're going to see response uh right here in the chat right we're going to render this URL that you see here and here it is so here are the top five bed sellic products by total revenue visualized in a bar chart okay so the graph looks a bit dodgy but this is just because you know I didn't put uh weeks or or many many days in building this so this is just a matter of refining The Prompt giving any more context on the quick chart API in this case okay there's another alternative that I mentioned which is uh to you know run na1 locally and install packages which I think you can confirm if I'm wrong but you can install packages that then you can use inside the python environment inside an10 to build other stuff there's other chart packages that are native within python um which are let me try to remember so d3. js is really good a matte plot lib matte plot lib is a really good one and you can create a really cool charts but yeah anyways it did a couple steps as you see here let's go through it so buffer memory it goes through this so in case we mention something in the past that you know needs to have as context let's say I mentioned uh let's use the invoice chart and then afterwards I say the query well it needs to know what table do I need to make this query on then and you know in the past few conversations I mentioned the invoice table so it needs to grab that from the previous convo as context to know what table to use so chat model then we create the database as I mentioned before back to the chat model then okay well I have this information now I'm going to generate a chart and I'm going to uh first generate it's called chart. js it's JavaScript language and then it's going to be converted or going to be added by the visualization agent it's going to package that query inside a URL and then we're going to be able to render that URL in the chat once again it's okay I I'll be covering this later on that goes back into the chat model and then it decides okay well yeah we pretty much got the chart and the inside so we're going to give it back to the user and this is what we get cool isn't it okay now we're going to put in a bit more of an involved query so that you understand the power of SQL over just searching through a normal Google sheet or Excel file okay before we do this I want you to understand that I pa the video because I found some errors that you know uh were happening inside the workflow and and I corrected them now so now nothing in the nature that I saw before should happen again first thing is that the visualization eding before perhaps you didn't catch it but before it was not an actual agent because it didn't have access to a tool why was this an issue well this was an issue because we were sending uh stuff here onto the agent so it would process that input and then and then generate one output it would not be able to use any tool to refine itself so now with access to this code tool now it can look at the that's coming in catch any typos and then correct itself using the speed of code that I added so now it's able to iterate it's able to check and then and then push the output before it was just input and then output and then also change the bits of the prompt so that uh it's a bit more robust and you know a bit better so we're going to we're going to for this second part of the demo we're going to query this us food store sales table uh and it contains a lot of stuff it contains data about an e-commerce store with food products across many different markets and and your total expenses marketing and all that so let's see how it does okay quering the database open a CH model generating the chart cool the highest and lowest average profit margins by state and Market region are Illustrated in this radar chart so this is pretty cool okay let me open this so you can see that we can uh discover insights that we did not know before about our data right in this case I predefined it but perhaps we could ask the agent or or the system hey uh what are some things that perhaps didn't know about my data and then you can search it and perhaps give you an illustration that you have not seen before that could drive growth in your company this is radar chart and we see Central uh Iowa Illinois New York California Massachusetts we see all these regions and the average propage margin of course the graphs are not the best but I think we're kind of pushing the limits already with what quick chart.
can do and what you know we can add uh with the agent inside na10 right so with make this was not possible of course uh with anything you can do stuff but you know there's always there's always a top wall that you end up hitting if you're doing a bit more uh stuff that's involved right as I said I'm I was building my my my startup right this dockys spere startup you know I was doing it in code you know with code you have you have infinite flexibility with things which you know sometimes you can't do with this so I feel like we're pushing the boundaries with what we can do here of course I didn't try the local version of na10 perhaps you can install as I said local libraries then perhaps we can use matte plot lip for example uh we can install this library and then and then do a bit more a bit better visuals but the quick chart doio I think it's a you know pretty generic API and and it's limited to chart. js language and and obviously their their API but yeah you can see that you can see uh visualization highlight that Illinois as Central Market has the highest average profit margin okay we can ask as well um are there insights that I could have might have not known about these products that could drive business growth or could increase my margins prepare visual as well and or could decrease my losses okay very generic let's see what it comes up with doing pretty good I thought it was going to take much more time given the type of work that it's doing honestly imagine having a team doing this for you right a t of analyst searching through SQL and all that stuff uh obviously generating the insights using a business intelligence tool right it would take time so here are some key insights from the data which identify errors for potential business growth coffee has the average has the highest average margin indicating strong profitability and potential for expanded marketing or specialized coffee products herbal T expresso so Jr margins te still cons profitability though slightly lower than coffee based beverages signaling room for strategic pricing or premium positioning and then we get the average profit profit margin per product type obviously the coloring is not good and that's that's because uh we probably need to make the prompt a bit better if I perhaps uh spend a bit more time uh into this system I I'm pretty sure that you know I could I could fix this issue but yeah still gives really good data that I could act on right that's that's the whole point and I didn't spend much on it so so that just shows you the power of doing these type of things that actually have a real use case okay another good query that that I made to the to the system was the following so the similar thing thing right in this case I got tech product sales table and it has other other information about phones and whatnot so here are the key insights about your top products right just for you to understand that you know it can make other visuals as well in this case it's a it's a double bar graph it says the key insights so now nice coloring strategically you could consider optimizing pricing focusing on marketing efforts and whatever but you see that the graph is really nice and you get to see you get something out of it right that's all I wanted to show uh yeah let's keep going with the video okay I think we were here so yeah just to quickly understand the difference I think I already explained but I'm just going to say it again SQL is great for you know these complex queries cuz it's so quick to to get a retrieval on databases or or tables within databases that are you know hundreds of thousands of rows long you saw how quick that was right for the for the first one 52 something thousand rows and it took what 30 20 seconds to bring a good Insight from so you're can understand that you know Google sheet and and Exel are great but they reach they reach a they reach a top right they reach a ceiling and then that's where SQL then comes along and then you know starts from that ceiling onwards this just shows that you know both of them are are good they are good but they're for different use cases right SQL is more for production for for larger Enterprise uh Solutions so there's still the possibility for an A1 to you know if if prompted properly and if you spend enough time to create stuff for for larger companies so I encourage you to to look into this a bit more and and and you know fiddle it with it I'll leave the the tool in in the description uh so you can download it okay so I'm dropping some information on these two models although I think that you know especially recently every week they release uh new versions of these models I still think it's important to just lay out uh the the improvements and most importantly the strength of each because you know every model has a specific strength that you know if you understand then you can leverage each of these in different use cases perhaps you know if you have a larger system you know which model to use for what and I think it's still really important more than more than showing you the latest updates and what you know these models are now better at because they're always going to be better right every every single every single release is going to be better than the previous one I mean hopefully but yeah you get the idea so I put this out more than more than that I want to show you that club 3. 3 3.
7 sorry you know apart from obviously the fact that it can hold more tokens it's getting really good at at using external apis which is obviously a plus the hybrid reasoning as well so actually something that that is important here this is I think one of the first models that it's able to think slow and think quick you know interchangeably so it can it it can choose to just answer quick and then it can choose to do it slowly so I think CLA did not have that before so I guess this is this is a a nice update to have for this new model but the important part is the coding skills coding skills is something that cloud cloud in general the cloud models are really really good at especially in this case 3. 7 is really good at and you're going to see it when I when I run it I mean you already saw it already uh in the demo but I'm going to do it again and I'm going to show you how to how to add it uh 4. 5 is really easy to add um I think they added it already in the in the the drop down uh I tried it and it's pretty good at at calling the right tools although in this system you know nothing nothing crazy is going on I've tried it already with other you know with my personal agent for example and it it does pretty good but yeah as I mentioned so if 3.
7 is good ACC coding then that means that that it's pretty good then at generating SQL queries and I tried it for with other models used to take so long to get that SQL query um completed right so in this database assistant which has access to the database that you don't see the tool as I explained in the previous video but uh but yeah it's using a tool in the background it's it's really good and yeah I was putting an example here you know the different queries okay so for this this works really good in Google Sheets and this is going to be a bit more of a struggle to do accurately on Google Sheets and with SQL it's it's it's a breeze this is a breeze so yep that's pretty much the end of the presentation and we're going to go to the build I'm going to show you how I've built this okay so let's go through this we had a chat message trigger I don't know if I mentioned before but I was working on this telegram integration that's why this is called telegram SQL agent but but yeah so what I wanted to do was to send the charts as an image through telegram as well so if you want to see a video like that let me know I can make a video of it I just need to figure out how that works perhaps I need to install this locally and and then install some libraries but you know if you guys want it I can I can figure out a way I'm pretty sure so when a CH is it receive in this case um we are sending this to the orchestrator agent going to run this so that you get to see you know perhaps a little flow on how this would work so let's say give me the top three Tech products and create a bar chart something quick okay so we have something let's see what we have okay we have this but the whole point was to you know to go through this with uh information with data already pre-filled so when chat message is received we pass this onto the orchestrator agent and here we add the query okay some people add the prompt here so they put something like do this and that Etc and then they put here's here's the user input I don't think this is the way to do it because then why would na10 put a system would allow you to add a system message below here okay A lot of people do it this way but if you want to keep good practices I suggest you only add you only add the input from you know from the user here and perhaps you want to do some manipulations perhaps you want to add rejects right a regular expression to change uh the format of this input if you want to do that go ahead and do it on the text box but I don't suggest you put the the system prompt or anything similar uh here okay I think that's that's where the system message comes along so I added this prompt orchestrator agent system prompt as robes on objectives it has the or in which uh you trigger the tools and whatnot so yeah pretty much everything's the same you see here chat input and well this I mean we already have uh the completed agent output because it goes first through uh these processes right it calls these tools and all that so what we see here is the the final tool okay so here's the Bara displaying so I I'll explain you now how we can see uh the other parts in between the other mid executions if you may sub workflow if you want to call it that okay but anyways we add that here okay that's that should be straightforward we have this chat model here so we pass obviously the tool and and yeah so in this case we're using 4. 5 uh in this case you can just add it straight away okay if you don't have it then I suggest that you upgrade to the latest version of na10 if you don't see it so the way to do that is to go to I'm just going to duplicate that so I don't lose anything here I can go back to it quickly you go to this admin panel here on the left uh part hit that main panel and then go to manage and then you know upgrade to the latest version and hit save okay we're here on the open chat model just choose 4. 5 preview that's all you need to do and then obviously if you want to add a credentials for openi to add the API key you find that by going to platform.
open. com and go to API keys right here okay that's where you can create your own API key and paste it here then hit save the base URL should be there already okay now we add a window buffer memory so the session ID comes from uh the first node right this one here and I put context window 10 so you can add a postgress SQL um let me show you here one of the previous videos I added this postgress chat memory and that allows you to store the chat memory in a database right similar to here you can add another table I think I can show you perhaps uh here so this is another project and you can store the chat conversations here I store them as vectors right it's sort of a rag I don't want to get to deep into it but I have another video explaining that how to do that uh but yeah just for now we don't buffer memory does the job but I said you can use this for analytics if you're building a solution out of this to track or to do anything with the with the conversations but anyways the important part is here okay so let's put this like this so that it makes sense in terms of order of how we are triggering these tools okay because first of all no matter what we do if we trigger any tools the first tool that we have to trigger is the query database trigger then comes the generate chart sometimes we don't trigger anything and that's fine but you know if we trigger something first has to be the query database and we state that on the system message okay there's an order you see number one and I explain it you know explicitly so let's go back to this you know we add a description name the source is database so database in this case is the anything database which holds all of your workflows and and yeah the ID you can get the ID here right if you go to the URL this is the name of the workflow why are we using the same workflow this is because we're doing a little trick here right this node that you see here usually it's added on other workflows the the idea is that you know you you have a a nice little workflow here and then you trigger another workflow and then you know you do what you need and then the answer comes back but you can do this little trick to save space and you know to save the number of workflows that you have to make because if you are on the paid plan in na1 they only allow you to have five life workflows right so you know therefore this is pretty nice comes in pretty handy also it's just nicer to to look at right rather than having to switch between two different workflows but anyways that's what we do so we are basically calling the same workflow and by calling the same workflow here we are calling this trigger and these two and this is kind of kind of the the Nexus between you know communication between orchestrator agent and these two agents okay but anyways we had a description to let you know what to do workflow ID you can also select from list okay this case it's called telegram SQL agent because this initially I don't know if I explain you this was going to be uh this right what I have here but with integration wrapped around it so that you know you can chat directly through voice as well on Telegram and it can it can you know send you back images as well but I'm not doing that at the moment because you know it's getting a bit lengthy and I wanted to get you know value there already because I have a I have a schedule so if you want me to make a another video on the telegram agent right this wrapped around the telegram integration let me know I can make a video about it I can figure it out let's come back to this and the most important thing here is the query and the event okay so this is what we're sending through to this node that then is going to decide what agent to trigger we add these two and then in this case we have the event to be set to sequel okay I think we can just you know we don't need this and we can just set it to SQL all the time so that we don't let the agent decide you know cuz at the end of the day language models are non-deterministic so perhaps this is the better way to do it right okay let's leave it like that and we're going to do the same with the generary chart okay same we have another description and we add a little bit of uh this is important so that it knows what format to retrieve the URL in because we needs to be in a specific format right so we're constructing this quick chart. URL which then gets rendered as an image so we need that URL to be very specific so we are stating that here same again same again right query describing the chart to generate so basically what's happening is that I'm sending a query onto here and depending on okay let me change that actually and what was Visual and depending if it says depending if the event is visual or SQL it's going to trigger one or the other agent okay so this is the concept of agent as a tool I'm choosing which agent to trigger and get get an answer back from I mean you can see that there but you can even see this here right I'm triggering it as a tool right I'm sending a query a structured query and then I'm I'm triggering the agents I'm getting a result from the agent sending it back to the orchestrator agent so that's what's happening so you see here that we don't see any executions why the reason is because this is considered as a subw workflow okay so this is the main workflow that is triggering another sub workflow because we have this trigger essentially and if you want to see this trigger you have to do something thing you have to go to executions and then you can go to the last ones and what usually happens is that so yeah we trigger this first as you see right this first part and then this this second part it usually follows in order so first one is the SQL agent gets triggered and then you can see obviously you can you can see what happens so let's have a look through this so what comes in the in here we get a query okay the vent is sequel therefore this gets triggered as SQL we come down here and then this database agent gets that query and then we do some things with it okay we uh write a prompt and then we essentially what do we do we it actually does the action of going through the the super base uh table and then retrieving the right information back okay so you can see that here right so that's what it does and in this case um I don't if you realized well I didn't realize I didn't tell you I will be using the Sonet 3.
7 model I'll show you now how to do that okay but it essentially actually showed you this already isn't it and then what we're doing is setting a response okay just so that we're making sure we're sending the right thing back to the tool okay because this tool right here sare database we're sending an input and then we're receiving an output from here okay we want to make sure we we're sending only the right information so that's why we set this node okay now we're going to see this one here this is the second part which generates a visualization so now the switch is Visual and now we are triggering this visualization agine and we have this prompt here so we have a prompt that uh explains to this agent that I wanted to generate chart. js it's very specific okay it's a language that then we wrap inside a larger URL okay but this little section this this little section that changes okay and that that change is based on the type of graph that we want so we want a blue bar chart with certain things and the x is in a different name or whatever that gets all defined inside chart. js so we're telling this visualization agent to generate that based on the insights that we have from the SQL agent okay this gets already uh predefined by by the orchestrated agent so we run this database uh tool we get a agent we get an answer back okay an inside and then the agent the orchestrate agent is like okay now we have this now I'm going to send that information as a structured query to the generator chart tool okay the type is visual okay this is coming to the visualization agent and now I'm going to generate chart.
js okay cool here we're using uh again CLA okay in this case it's 3. 5 that's fine we're not doing anything crazy but I'm going to show you now how to set up uh 3. 7 here CL 3.
7 because it's generating SQL and you know the better the model the more accurate output so so yeah that's what we do here and we added the code tool I ended up adding this because uh there used to be some little things that uh that were happening in consistencies that uh you know I had to fix so adding this this code tool was was very helpful and then we have this output structure parser so uh we received information from the orchestrator now we are generating chart. JDs and now we need a specific format for it okay so chart. js we need a very specific input schema for this okay let me see if I can put it on Json format yeah so we receive this and then we have this very specific input schema and then you know this gets filled in and then we have this set response and essentially what we have here so you see this right this is what we actually end up rendering on the conversation okay so this this Json output is the chart.
js okay the thing that I was telling you before so that gets placed here and then we Define uh the quick chart doio by the way this is a free service we set up the width to be 400 I found that that's a good width you can change it to whatever and then we are uh we need to do some encoding and stringify in the Json and then we add that that chart. js dialect or whatever you want to call it and then once you do all that right you do these Transformations you get the following URL okay and that's what you can do to then you know copy that perhaps you want and if you paste it here you can see uh the actual bar chart that gets stored within their servers but we can call as a URL back in the N1 server right so it's pretty neat it's pretty smart that means we don't have to you know deal with all that stuff and we can you know this is perfect for automation tools um because Cloud automation tools don't have uh inbuilt libraries normally uh but yeah that's what happens here but I covered this I covered that and yeah we don't need memory here CU just generating SQL I need to understand if if memory will be important but I I think it's good okay so the last thing that we're going to do is change this model to uh thropic 3. 7 okay and people think that you can just do it like this okay I saw a couple videos uh saying that you know you can just change uh this to three point you know that's it and in the surface it looks like it actually works so let me show you not to call anyone but I saw a couple videos just having a look at 3.
7 and n and all that so look at that so queres the database right and it contains seven tables okay so it looks like it works right if but then look at the executions and then you're going to see that um so let's go to here okay let's look the module responsible for the querying of the database this one right if you go to the logs and here you are going to see if you go on Json going to see that the model used is 3 it defaults back to the 3. 5 Sonet model so no this proven it doesn't work can't just do that okay you either so let's let's delete this you either uh do it with open router or you directly send an HTTP request to Claude okay I'm going to do with open router because either though it's a bit more expensive it's more flexible to do uh because you can add other models and and it's very quick right so if if money is not a big of a concern to you it's not even that expensive to be honest depends on how much time you're saving for your client but but anyways set it there and we're going to create a new credential so so we're going to go to open router. a and then we're going to sign in I'm going to sign in cool I'm in and now we're going to go to uh my keys okay I used a couple Keys um but essentially we can create a new key so any test let's create that copy that okay and then we go here create the credential add in your API key and you should be good to go okay save that now you can choose between all sorts of models okay we have we have a lot uh these seem to be all open source you perplexity here quen we have open AI so if you go and search um anthropic and then Cloud 3.
7 Sonet okay we have the thinking model and we have Sonet so there you go so that's how you select it okay okay so let's reset everything and let's just say bring me a valuable inside from the invoices table okay so if the usage of the claw 3. 7 model works we should be able to get an inside from the table and we should successfully trigger the database tool so let's see that works and we should get an Insight from this meaning that uh we successfully triggered claw 3. 7 there you go perfect so we got some sales performance data that's amazing and that's pretty much it so you saw how easy it is to just go to open router and set that and you know there's there's this way of doing it and as I said uh you can also do an HTTP request but I choose to do it this way because you have a crazy amount of model choices here and it's just easy to switch them right if you want to test something out quickly in your environment cool so that was an insight for you regarding how to use clo 3.
7 and also how to set up GPT 4. 5 and you know their use cases what they're good at and where they good at so as you saw claw 3. 7 and just the claw family in general really good with coding and especially generating SQL which is part of the the the coding environment right the coding set of things and gbt 4.
Related Videos
25:47
Building AI Agents is Now Easier Than Ever...
Frank Nillard
2,794 views

12:44
I Switched 50% of My AI Work to Claude, He...
Jeff Su
317,567 views

20:18
Model Context Protocol (MCP), clearly expl...
Greg Isenberg
652,179 views

27:41
Build the Ultimate AI Lead Outreach Machin...
Frank Nillard
1,604 views

2:32:10
AI AGENTS EMERGENCY DEBATE: These Jobs Won...
The Diary Of A CEO
1,281,580 views

17:17
Turn Claude to Powerful AI Agents, Automat...
Grace Leung
24,917 views

40:53
8 Insane AI Agent Use Cases in N8N! (autom...
AI Foundations
180,828 views
1:19:35
AI Agent Powered Content MACHINE! (n8n, Sl...
Stephen G. Pope
28,361 views

24:47
How To Build a Startup Team of AI Agents (...
Simon Høiberg
599,768 views
58:00
I Have Built the Ultimate WhatsApp AI Agen...
Frank Nillard
86,856 views

21:43
Clean Knowledge Bases: Crawl4AI Scraping +...
Umbral
7,739 views

23:16
How Google A2A Protocol Is Changing AI Age...
Frank Nillard
1,017 views

19:01
The #1 Mistake You’re Making when Building...
Frank Nillard
1,149 views
8:40
This N8N AI Agent Can Query ANY Database (...
Ahmed Mukhtar | AI Automations
17,615 views

18:30
How I'd Teach AI Agents to A 13 Year Old (...
Frank Nillard
900 views

19:16
Store All Data Types with Agentic RAG in n8n
Nate Herk | AI Automation
52,353 views

2:08:46
Replit Agent - Full Course - App Developme...
NamanX AI
41,089 views

38:54
The Master Prompt Method: Unlock AI’s Full...
Tiago Forte
200,665 views

10:09
AI Agents, Clearly Explained
Jeff Su
980,278 views

30:07
This Hybrid RAG Trick Makes Your AI Agents...
The AI Automators
9,976 views