🔴 STRENGTH INDEX Trading (Say BYE-BYE to false signals)
232.42k Aufrufe3369 WörterText kopierenTeilen
Trader DNA
🔴 THE MOTHER OF ALL INDICATORS:
https://traderversity.com/heiken-ashi-strength-index-trading.html
h...
Video-Transkript:
hey what's up everyone welcome back to Trader DNA in last week's video we went all in on the mother of all indicators and when I say all in I mean we broke it down completely if you watch that video all the way through you're already on your way to becoming a market analysis master and trading like a pro with the right indicators but today today we're kicking it up a notch no actually we're blasting it to overdrive we're taking everything you learned and moving to the next level remember remember those moving averages we set up
last week yeah those green lines that were pure gold for short to medium-term Trends we're sticking with them because they're the best of the best now if you're ready to go from pretty accurate to insanely accurate you're in the right place we're diving into strength index trading this strategy is designed to give you laser focus Precision in every trade you make we're talking about pushing your accuracy to 90% or higher how do we do it with the dynamic duo hiken Ashy and RSI these tools are going to be your secret weapons for leveling up your
trading game so buckle up because this tutorial is going to change the way you trade forever let's get started did you know that by mastering this strategy you're about to unlock four of the most important keys in trading whether it's Forex stocks or even crypto let me show you how this can completely transform the way you trade key number one the easiest way to reduce Market noise yep I'm talking about a method so simple you'll wonder why you didn't use it sooner after this say goodbye to all that annoying Market noise forever key number two
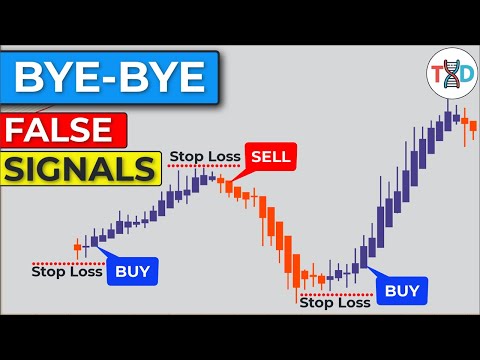
two powerful confirmations that never fail to identify market trends with this you'll know exactly when the market is trending or just waiting around trying to figure out where it's headed next no more guessing games this method makes it Crystal Clear key number three say bye-bye to false signals if you've been opening positions based on bad signals or if your trades keep failing because of inaccurate signals you're dealing with false signals but not anymore soon you'll easily filter out those fake signals and wave goodbye to all that frustration and finally key number four Crystal Clear entry
and exit points this is huge guys pinpointing the right moments to enter and exit trades is crucial think of it like pressing the launch button on an ICBM there's zero room for error this method makes it super simple so you'll always know the right move with these four keys from strength index trading you're about to level up your trading game big time no more confusing theories or complicated analyses to straightforward effective trading that works so let's dive in and get started on making you a winner in Forex stocks and crypto all right let's jump right
into the first key key number one the easiest way to reduce Market noise one of the biggest headaches in trading is those wild price fluctuations that make everything look confusing especially when you're using regular Candlestick charts but don't worry I've got the perfect solution the absolute best way to cut through that market noise is by combining hike and usy candles with the green moving average lines we talked about in last week's video the mother of all indicators and if you miss that video no problem I'll drop the link in the description so you can go
back and check it out trust me it's worth it now since we've already covered everything about those green moving average lines in detail today I'm going to break down how hen usy candles work let's get right into it all right guys let's jump into the main function of haken Ashi and trust me this is going to change your trading game forever hen ASI is all about filtering out that annoying Market Noise by using an averaging method for each candle what does that mean for you a smoother chart where the big trends just pop out making
it so much easier to spot by cutting through the noise hiashi gives you a super clear view of market trends and directions helping you hit those price movements with pinpoint accuracy how awesome is that now here's how you can get started with hiashi in just two simple Steps step one switch your Candlestick chart to hik anashi mode it's easy step two check out the difference between hiken Ashi and those boring traditional candlesticks the biggest difference is that hiken Ashi uses a modified formula based on moving averages instead of the regular open high low and close
prices this gives you a chart that's way smoother and helps you spot Trends and reversals like a pro plus hike and ushy charts hide all those pesky gaps and messy price dates that clutter up traditional charts look over here Candlestick chart on the left and hi kanashi on the right see that with hik Andi the chart is so smooth it's like a hot knife through butter making those Trends just jump out at you compared to traditional candlesticks and that is why so many Forex Traders love using High kanashi candles they cut the noise Make Trend
analysis of Breeze and help you trade smarter all right that's our Deep dive into hinachi now let's back to the main event the easiest way to reduce Market noise the easiest way to slice through all that annoying Market noise is by combining the green moving average lines with hiken ashy candles perfect now Market noise doesn't stand a chance and guess what we're diving right into key number two two powerful confirmations that never fail to identify market trends if you're thinking hey um key number one and key number number two seem like a dynamic duo you're
absolutely right these two indicators are like peanut butter and jelly they just work better together to give you the clearest picture of market trends so how do we use these two Powerhouse tools to rake in those profits let's kick it off with the green moving average lines trust me even without getting super technical you can easily spot when we're in a bearish trend or a bullish Trend just by the way these green lines move check this out here's a bearish trend and here's a bullish Trend now look at this another bearish Trend followed by a
bullish Trend if the market isn't giving us these clear formations then guess what we're not in a trending Market easy peasy right no tricks no gimmicks just straight up facts but sadly a lot of beginner Traders get caught up in overthinking and complicating Trend analysis which leads to confusion all right now that you've mastered the green moving average lines let's let crank it up a notch we're going to blend these with hik and ashy candles taking our analysis to the next level all right let us begin with this section here the formation of the green
moving average lines clearly indicates a bullish Trend as we previously discussed you should now have a thorough understanding of how these green L green lines represent a bullish Trend and how they forming a bearish trend now we bring hik and Ashi into the discussion what role does it serve in this analysis the key lies in understanding the hike and ashy price action patterns which are essential for accurately interpreting Market movements using this method hiken ashy price action patterns in traditional Candlestick charts there are numerous price action patterns such as the dogee gravestone dogee dragonfly dogee
pin bars and engulfing candlesticks among many others however with hiashi bars we streamline the analysis to three principal types of price action patterns one bullish bars these are typically blue with a wick at the top and none at the bottom indicating a strong upward Trend two bearish bars these are usually red with a wick at the bottom and none at the top signifying a downward Trend three indecision bars these may appear in either red or blue with Wicks at both the top and bottom reflecting Market indecision by focusing on these three primary patterns we can
reduce Market noise and clearly identify Trends and potential reversals one bullish hiashi bars all right let's talk about bullish hiashi bars these are easy to identify just look for bars with a wick only at the top and none at the bottom if the bar is moving up with no Wick at the bottom and only at the top that's a clear bullish signal in this example we've highlighted the bullish hiken ashy bars in blue two bearish hik and Ashi bars now bearish hik and Ashi bars are are the exact opposite they have a wick at the
bottom but none at the top so if the bar is heading down has no wick on top and there's a wick at the bottom we recognize this as a bearish signal in this case we've marked These Bars in red for easy distinction three indecision hiken Ashi bars let's move on to indecision hiken Ashi bars these are the bars with Wicks on both the top and bottom it doesn't matter if they're bullish or bearish if there are Wicks on both ends they're classified as IND indecision hiken ashy bars in our example these can appear in either
red or blue when you see indecision hik and ashy bars it's time to prepare be ready to open positions if a bullish or bearish hik in ashib bar forms following the rules of our trading strategy These Bars can also serve as a signal to either Exit the market or stay in now that you have a solid grasp of the green moving average lines and high Kashi candles for identifying Trends in our strength index trading strategy let's move to Key number three saying byebye to false signals as I mentioned earlier if you've been dealing with bad
signals that's about to change with this strategy um you'll quickly spot those false signals and eliminate them for good after this you're going to say goodbye to those false signals but hold up in trading there's no such thing as a Holy Grail no signal is ever going to be 100% accurate no one and I mean no one can predict exactly what's going to happen in the market in the next second minute hour day week month or even year trading is all about probabilities not certainties that's why we need stop losses profit targets and of course
money management now let's jump into key number three and trust me it's a GameChanger here's what you need for high probability signals in the strength index trading strategy first up the green moving average lines have to show a clear bullish or bearish Trend if you don't see this formation or something similar this strategy says hey there's no clear Trend stay out of the market remember we're hunting for Perfect Trading signals so we're not getting tricked by false ones next the RSI line needs to be above the 50 level I didn't bring up the RSI indicator
earlier because it could get confusing but here's the deal in this strategy the RSI shows the strength of the trend not the direction so if the RSI lines above 50 it means the bullish trend is strong below 50 the bearish trend is strong when this happens you should be on the lookout to time your sell or buy position just right based on the trend shown by the hik in ashy candles and those green moving average lines and finally the rally and pullback phases this is what you've been waiting for before diving in for a sell
or buy entry um check out this chart High Kashi candles turn red showing a shift from bullish to bearish with those bearish hiashi bars but hold on this bearish move seems temporary because the indecision hiashi bars are followed by bullish hiashi bars and the RSI line stays at above 50 so these bullish hiashi bars give us a solid Buy Signal even though the blue moving average line hasn't crossed the green ones yet if you're feeling unsure about this early signal just hold off until that blue line crosses the green moving averages this this is exactly
how the strength index trading strategy helps you nail high accuracy trading signals stick to the rules be disciplined there's no room for slip UPS if you want to crush it in trading and finally key number four Crystal Clear entry and exit points all right here's the deal Traders can't afford to mess up when jumping into the market whether it's a buy or sell position why because if you mess up you lose money and if you keep messing up your whole trading Capital gone If This Were a company it would be wiped out completely with nothing
left so I really hope you're getting how serious this is no more Reckless ruless decisions when you're entering or exiting the market every single move has to be based on well-tested trading rules followed with absolute discipline no compromises now to stay 100% disciplined when you enter or exit the market you've got to rely on signals that are crystal clear consistent logical and can't be swayed by opinions or emotions and guess what the trading signals we're using in the strength index trading strategy check all those boxes to make this even easier for you let's jump right
into step number four with a case study on a buy entry signal let's go all right guys check out this chart we're diving in right here where the green moving average lines are showing us a super strong bullish Trend like perfectly formed but wait there's more let's zoom in on the RSI window down below look at that line above 50 that's a clear sign the bullish trend is holding strong now things are about to get interesting the bullish hik in Ashi bars turn into bearish hik in ashib bars and you know what that means two
possible outcomes in the market first the bullish Trend might flip into a bearish trend or this could just be a market correction meaning the bullish Trend could come back even stronger after it ends I hope you're following along because this part is crucial uh look at the hik in ashib bars closely after two bearish hik in Ashi bars the sequence shrinks down to a bearish indecision hike in ASI bar followed by a small bearish hik in Ashi bar and then it transitions into a bullish indecision hike in ashib bar now if you're an experienced Trader
you know this formation is a clear sign that the market is gearing up to continue its bullish Trend and here's why first the blue moving average line stays above the green ones uh even during the correction boom and second the RSI line holds strong above the 50 level this bullish trend is still going strong at this point you should totally get what I'm showing you I've broken this down in a super detailed clear and straightforward way to make it easy for you to understand all right let's keep going next we get a bullish highin ASI
bar and you know what that means a crystal clear Buy Signal this is a high probability buy and I'm super confident that if you spot this formation like I just described especially in the first wave of the trend you've got a massive opportunity for huge profits by opening a position with this strategy now let's talk about stop-loss placement you've got two options first put your stop loss below the green moving average lines for a buy and above them for a sell or go with the second option below the nearest swing low for a buy and
above the nearest swing high for a sell it depends on where the price is when you enter uh I broke this all down in in last week's video the mother of all indicators I'll drop the link at the end and in the description you need to check it out it's a game Cher all right the same rules apply when we're looking for a sell signal but flipped take a look at this chart and you'll see it's super clear those green moving average lines they're screaming strong bearish Trend and these bearish hik and ashy bars they
confirm that the mark is really truly bearish right now plus check out the RSI line below the 50 level telling us that this bearish trend is no joke it's strong now when those bearish High inashi bars shift into bullish High inashi bars we've got two possible outcomes first the bearish trend could flip into a bullish Trend or second we could be in a rally phase meaning the bearish trend might just pick right back up after this temporary price High TI ends but here's where it gets exciting we start to see signs that this little bullish
trend is about to run out of steam how with the bullish indecision hike in ashib bar followed by a bearish hik in ashib bar boom there's your clue another big confirmation is the RSI line staying below the 50 level this tells us the market still has plenty of muscle to keep that strong bearish Trend going so this is a legit cell entry signal folks you can jump into a cell because the blue moving average Line is now chilling below the bearish green moving average lines coming up I'll walk you through how to set your exit
points in a way that makes sense no guess workor just solid disciplined moves so stick around for that all right guys we're about to dive into how to nail your exit points like a pro now unlike traditional Candlestick strategies we're using the trend index trading strategy with hik inashi bars here's the deal when you're in a buy scenario the moment those bullish hik in Ashi bars flip to bearish or even to a bearish indecision bar it's time to exit the market on the next candle and for a sell scenario it's just the opposite exit when
the bearish bars turn bullish or into a bullish indecision bar simple right now let's check out a real example boom here's a chart this bullish hike in Ashley bar that's our Buy Signal and we place our stop loss right below the red moving average line and then we see two indecision bars normally we'd exit but since we're just starting we stick to the initial stop loss we exit when a bearish hike in Ashi bar forms right here next let's jump to a sell example following the same rules this bearish hik in Ashi bar signals our
cell entry with a stop loss above the red line the price drops and we exit here after a bullish high and Asi bar shows up simple but wait we get another bearish bar and with the RSI still under 50 the bearish trend is strong stop loss goes above the red line the price drops again and we exit when a bullish indecision bar forms easy so there you have it folks crystal clear and ready to apply be disciplined follow these steps exactly and only enter when the market gives you that perfect signal patience pays don't rush
it now if you want to set this up super easily grab the template in the description it'll plot everything perfectly ly so you don't have to lift a finger and for maximizing profit check out my video on the mother of all indicators trust me you don't want to miss it click the video right here and I'll see you there bam that's how we do it [Music]
Ähnliche Videos

16:55
🔴 The MOTHER of All Indicators (Dangerous...
Trader DNA
323,213 views

34:09
🔴 This NON-REPAINTING Indicator Can Make ...
Trader DNA
13,004 views

22:39
🔴 The Mother of All Price Actions... Brea...
Trader DNA
141,713 views

11:14
STOP Using the Heiken Ashi! This Indicator...
Data Trader
901,860 views

55:11
Master This ONE Candlestick Pattern TODAY ...
Ross Cameron - Warrior Trading
1,320,730 views

39:19
Support And Resistance Didn't Work Till I ...
Rayner Teo
2,081,573 views

9:28
This Oscillator Tells You Exactly Where To...
PineTrades
147,831 views

17:50
Trading Strategy had 100% Win Rate in 2024...
The Transparent Trader
136,522 views

20:32
🔴 The LAW OF MACD… Here’s What No One Tel...
Trader DNA
43,746 views

8:39
20 EMA High & Low Trading Strategy – Live ...
GeekOnDaily
81,558 views

29:58
NEW Deepseek AI Good For Creating Trading ...
Michael Automates
918,651 views

28:37
🔴 This Trading Hack Makes PROs RICH (Insa...
Trader DNA
67,136 views

16:24
🔴 EMA-Heiken Ashi | This is The Trading S...
Trader DNA
2,672,873 views

29:02
Manipulation Candlestick Patterns Banks Us...
The Secret Mindset
231,780 views

15:08
🔴 This Moving Average Strategy Will Make ...
Trader DNA
70,266 views

29:47
The Ultimate Guide to Swing Trading for Be...
Humbled Trader
156,275 views

30:09
I Wasted $5,000 on Trading Education, Only...
The Secret Mindset
434,422 views
9:55
This Zero-Lag BUY SELL Indicator Makes All...
PineTrades
220,784 views
12:42
1 Indicator, 3 Uses! Most Powerful Trading...
PineTrades
557,535 views
55:18
How to Read Candlestick Charts (with ZERO ...
Ross Cameron - Warrior Trading
3,158,944 views